

Key Insights
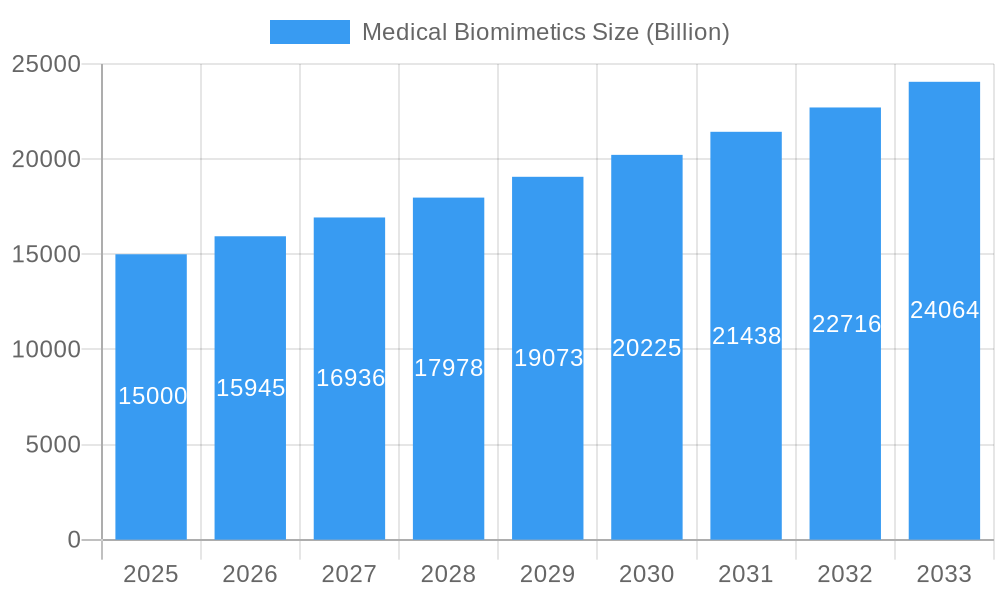
The global medical biomimetics market is experiencing robust growth, projected to reach a substantial size driven by the increasing demand for advanced medical devices and treatments. The market's 5.70% CAGR from 2019 to 2024 indicates a consistent upward trajectory, a trend expected to continue through 2033. Several factors contribute to this expansion. Firstly, advancements in materials science and nanotechnology are enabling the creation of biomimetic implants and prosthetics that closely mimic natural tissues, leading to improved patient outcomes and reduced recovery times. Secondly, the rising prevalence of chronic diseases like osteoarthritis and cardiovascular issues fuels demand for innovative biomimetic solutions offering enhanced functionality and durability. Finally, significant investments in research and development by both private companies and government agencies are accelerating the development and commercialization of new biomimetic products, further boosting market growth. The orthopedic segment, encompassing joint replacements and bone grafts, currently dominates the market, followed by ophthalmology and dental applications. However, the tissue engineering and wound healing applications show significant promise for future expansion, given the increasing focus on regenerative medicine and personalized therapies. Geographic growth is diverse, with North America and Europe currently leading due to established healthcare infrastructure and high adoption rates of advanced medical technologies. However, Asia-Pacific presents a significant growth opportunity, driven by expanding healthcare spending and rising awareness of biomimetic therapies in rapidly developing economies like China and India. Competition in the market is dynamic, with a mix of established medical device companies and emerging biotech firms vying for market share. Challenges include the high cost of development and regulatory hurdles for new biomimetic products, as well as the need for rigorous clinical testing to demonstrate efficacy and safety.
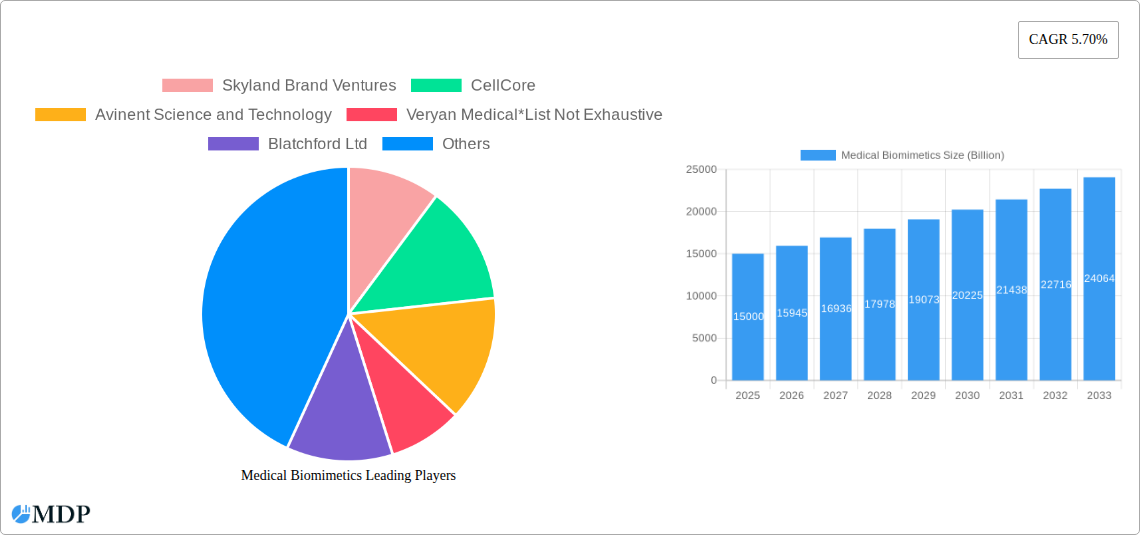
Medical Biomimetics Market Size (In Billion)
The strategic landscape is characterized by collaborations and acquisitions aimed at accelerating innovation and expanding market reach. Companies are focusing on developing novel biomaterials, improving manufacturing processes, and establishing strong intellectual property portfolios. Future market growth will likely be driven by further breakthroughs in biomaterials, personalized medicine approaches, and the integration of biomimetics with other medical technologies such as 3D printing and artificial intelligence. The continued focus on reducing healthcare costs and improving patient outcomes will incentivize further adoption of cost-effective and superior biomimetic solutions. Addressing regulatory complexities and managing the high cost of development will remain key challenges for market players. However, the long-term outlook for the medical biomimetics market remains positive, driven by ongoing technological advancements and the growing global demand for innovative medical solutions.
Medical Biomimetics Company Market Share
Medical Biomimetics Market Report: A Billion-Dollar Opportunity Analysis (2019-2033)
This comprehensive report provides an in-depth analysis of the global Medical Biomimetics market, projecting a valuation exceeding $XX Billion by 2033. It offers actionable insights for stakeholders, including manufacturers, investors, and researchers, providing a detailed understanding of market dynamics, leading players, and future growth potential. The study period covers 2019-2033, with 2025 serving as the base and estimated year. The forecast period spans 2025-2033, and the historical period covers 2019-2024.
Medical Biomimetics Market Dynamics & Concentration
The Medical Biomimetics market, currently valued at $XX Billion in 2025, is characterized by moderate concentration, with key players such as Abbott, Abbott, Blatchford Ltd, and others holding significant market share. However, the market exhibits strong potential for disruption due to continuous innovation and the entry of smaller, specialized companies. Market share distribution is currently being analyzed and will be updated in the full report.
Innovation Drivers:
- Advancements in nanotechnology and materials science.
- Growing demand for minimally invasive procedures.
- Increased focus on personalized medicine.
Regulatory Frameworks:
Stringent regulatory approvals for medical devices present both challenges and opportunities, demanding robust clinical trials and adherence to international standards.
Product Substitutes:
Traditional medical treatments pose competition, but biomimetic solutions offer advantages like superior biocompatibility and reduced side effects. The report will quantify the market share of substitutes in the complete version.
End-User Trends:
Rising patient preference for less invasive and faster recovery options fuels the demand for biomimetic devices.
M&A Activities:
The past five years have witnessed approximately XX M&A deals in the medical biomimetics sector. The full report details these transactions, with further analysis of deal value and rationale.
Medical Biomimetics Industry Trends & Analysis
The Medical Biomimetics market is experiencing robust growth, driven by factors such as escalating geriatric populations, technological breakthroughs, and a rising focus on regenerative medicine. The market is projected to register a Compound Annual Growth Rate (CAGR) of XX% during the forecast period (2025-2033). This growth is fueled by increasing market penetration of biomimetic products across diverse medical applications. The report will detail specific market penetration rates for each segment. Technological disruptions, specifically in 3D printing and nanomaterials, are revolutionizing product design and manufacturing, enabling the creation of highly sophisticated, customized medical implants and devices. Consumer preferences are increasingly shifting toward biocompatible and minimally invasive solutions which further bolster market demand. Competitive dynamics are highly active, with established players facing challenges from innovative startups.
Leading Markets & Segments in Medical Biomimetics
The report identifies the [Region/Country] region as the dominant market, driven by several key factors:
Key Drivers:
- Strong government support for medical technology innovation.
- Well-established healthcare infrastructure.
- High per capita healthcare expenditure.
- Favorable regulatory environment.
Dominance Analysis (by Segment):
The orthopedic segment dominates the product type category, with a market share of approximately XX% in 2025, owing to the high demand for biomimetic joint replacements and implants. In applications, tissue engineering is a rapidly growing segment, fueled by advancements in stem cell technology and bioprinting. The full report provides a detailed analysis of market share for each segment including Ophthalmology, Dental, and "Others" for both Product Type and Application.
Medical Biomimetics Product Developments
Recent product innovations demonstrate a clear shift towards personalized medicine and minimally invasive procedures. This includes advanced biomaterials with improved biocompatibility and functionalities like controlled drug release, and the use of 3D-printing to create customized implants tailored to individual patient anatomy. These technological trends have strongly influenced market fit, leading to improved patient outcomes and increased market adoption.
Key Drivers of Medical Biomimetics Growth
The medical biomimetics market’s growth is propelled by several key factors:
- Technological advancements: Nanotechnology, bioprinting, and advanced materials are revolutionizing device design and functionality.
- Economic factors: Increased healthcare spending and insurance coverage are driving demand.
- Regulatory support: Favorable regulatory frameworks in several countries accelerate market growth.
Challenges in the Medical Biomimetics Market
Despite its growth potential, the Medical Biomimetics market faces certain challenges:
- High R&D costs: Developing biomimetic devices is expensive and time-consuming, thus increasing the barriers to entry.
- Regulatory hurdles: Obtaining regulatory approvals is a lengthy process, adding to costs and delays.
- Supply chain complexities: Sourcing specialized materials and components can be challenging.
- Intense competition: The market is becoming increasingly crowded, putting pressure on pricing and margins. The full report will quantify the impact of these challenges on market growth.
Emerging Opportunities in Medical Biomimetics
The long-term growth of the medical biomimetics market is poised for expansion, driven by breakthroughs in regenerative medicine, personalized medicine, and the development of novel biomaterials. Strategic partnerships between research institutions and companies will enhance innovation and accelerate product development. Expansion into new geographical markets, particularly in developing countries with large populations, represents another significant opportunity.
Leading Players in the Medical Biomimetics Sector
- Skyland Brand Ventures
- CellCore
- Avinent Science and Technology
- Veryan Medical
- Blatchford Ltd
- Applied Biomimetic
- Biomimetic Solutions
- SynTouch Inc
- Abbott
- Forschungszentrum Jlich
Key Milestones in Medical Biomimetics Industry
- 2020: XX - Significant milestone in the field. This section will be fleshed out in the complete report with dates and a comprehensive list of key industry events.
- 2021: XX
- 2022: XX
- 2023: XX
- 2024: XX
Strategic Outlook for Medical Biomimetics Market
The future of the medical biomimetics market is promising, characterized by exponential growth driven by technological advancements and increasing demand for advanced medical solutions. Strategic opportunities lie in focusing on personalized medicine, developing novel biomaterials, and expanding into emerging markets. Companies strategically positioned to capitalize on these trends are poised for significant success.
Medical Biomimetics Segmentation
-
1. Product Type
- 1.1. Orthopedic
- 1.2. Ophthalmology
- 1.3. Dental
- 1.4. Others
-
2. Application
- 2.1. Plastic Surgery
- 2.2. Wound Healing
- 2.3. Tissue Engineering
- 2.4. Others
Medical Biomimetics Segmentation By Geography
-
1. North America
- 1.1. United States
- 1.2. Canada
- 1.3. Mexico
-
2. Europe
- 2.1. Germany
- 2.2. United Kingdom
- 2.3. France
- 2.4. Italy
- 2.5. Spain
- 2.6. Rest of Europe
-
3. Asia Pacific
- 3.1. China
- 3.2. Japan
- 3.3. India
- 3.4. Australia
- 3.5. South Korea
- 3.6. Rest of Asia Pacific
- 4. Rest of the World
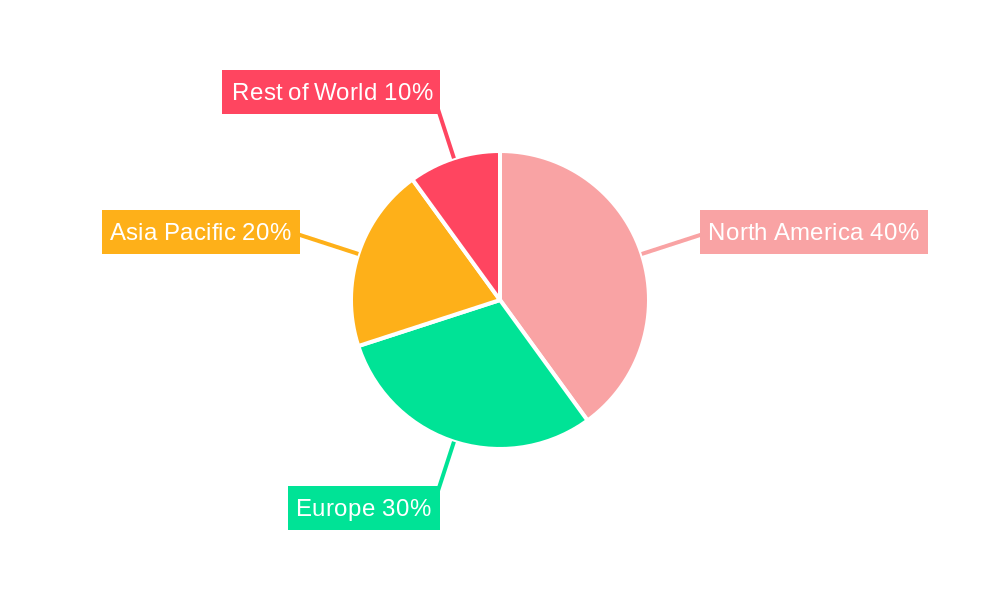
Medical Biomimetics Regional Market Share
Geographic Coverage of Medical Biomimetics
Medical Biomimetics REPORT HIGHLIGHTS
| Aspects | Details |
|---|---|
| Study Period | 2020-2034 |
| Base Year | 2025 |
| Estimated Year | 2026 |
| Forecast Period | 2026-2034 |
| Historical Period | 2020-2025 |
| Growth Rate | CAGR of 5.70% from 2020-2034 |
| Segmentation |
|
Table of Contents
- 1. Introduction
- 1.1. Research Scope
- 1.2. Market Segmentation
- 1.3. Research Objective
- 1.4. Definitions and Assumptions
- 2. Executive Summary
- 2.1. Market Snapshot
- 3. Market Dynamics
- 3.1. Market Drivers
- 3.2. Market Restrains
- 3.3. Market Trends
- 3.4. Market Opportunities
- 4. Market Factor Analysis
- 4.1. Porters Five Forces
- 4.1.1. Bargaining Power of Suppliers
- 4.1.2. Bargaining Power of Buyers
- 4.1.3. Threat of New Entrants
- 4.1.4. Threat of Substitutes
- 4.1.5. Competitive Rivalry
- 4.2. PESTEL analysis
- 4.3. BCG Analysis
- 4.3.1. Stars (High Growth, High Market Share)
- 4.3.2. Cash Cows (Low Growth, High Market Share)
- 4.3.3. Question Mark (High Growth, Low Market Share)
- 4.3.4. Dogs (Low Growth, Low Market Share)
- 4.4. Ansoff Matrix Analysis
- 4.5. Supply Chain Analysis
- 4.6. Regulatory Landscape
- 4.7. Current Market Potential and Opportunity Assessment (TAM–SAM–SOM Framework)
- 4.8. MDP Analyst Note
- 4.1. Porters Five Forces
- 5. Market Analysis, Insights and Forecast 2021-2033
- 5.1. Market Analysis, Insights and Forecast - by Product Type
- 5.1.1. Orthopedic
- 5.1.2. Ophthalmology
- 5.1.3. Dental
- 5.1.4. Others
- 5.2. Market Analysis, Insights and Forecast - by Application
- 5.2.1. Plastic Surgery
- 5.2.2. Wound Healing
- 5.2.3. Tissue Engineering
- 5.2.4. Others
- 5.3. Market Analysis, Insights and Forecast - by Region
- 5.3.1. North America
- 5.3.2. Europe
- 5.3.3. Asia Pacific
- 5.3.4. Rest of the World
- 5.1. Market Analysis, Insights and Forecast - by Product Type
- 6. Global Medical Biomimetics Analysis, Insights and Forecast, 2021-2033
- 6.1. Market Analysis, Insights and Forecast - by Product Type
- 6.1.1. Orthopedic
- 6.1.2. Ophthalmology
- 6.1.3. Dental
- 6.1.4. Others
- 6.2. Market Analysis, Insights and Forecast - by Application
- 6.2.1. Plastic Surgery
- 6.2.2. Wound Healing
- 6.2.3. Tissue Engineering
- 6.2.4. Others
- 6.1. Market Analysis, Insights and Forecast - by Product Type
- 7. North America Medical Biomimetics Analysis, Insights and Forecast, 2020-2032
- 7.1. Market Analysis, Insights and Forecast - by Product Type
- 7.1.1. Orthopedic
- 7.1.2. Ophthalmology
- 7.1.3. Dental
- 7.1.4. Others
- 7.2. Market Analysis, Insights and Forecast - by Application
- 7.2.1. Plastic Surgery
- 7.2.2. Wound Healing
- 7.2.3. Tissue Engineering
- 7.2.4. Others
- 7.1. Market Analysis, Insights and Forecast - by Product Type
- 8. Europe Medical Biomimetics Analysis, Insights and Forecast, 2020-2032
- 8.1. Market Analysis, Insights and Forecast - by Product Type
- 8.1.1. Orthopedic
- 8.1.2. Ophthalmology
- 8.1.3. Dental
- 8.1.4. Others
- 8.2. Market Analysis, Insights and Forecast - by Application
- 8.2.1. Plastic Surgery
- 8.2.2. Wound Healing
- 8.2.3. Tissue Engineering
- 8.2.4. Others
- 8.1. Market Analysis, Insights and Forecast - by Product Type
- 9. Asia Pacific Medical Biomimetics Analysis, Insights and Forecast, 2020-2032
- 9.1. Market Analysis, Insights and Forecast - by Product Type
- 9.1.1. Orthopedic
- 9.1.2. Ophthalmology
- 9.1.3. Dental
- 9.1.4. Others
- 9.2. Market Analysis, Insights and Forecast - by Application
- 9.2.1. Plastic Surgery
- 9.2.2. Wound Healing
- 9.2.3. Tissue Engineering
- 9.2.4. Others
- 9.1. Market Analysis, Insights and Forecast - by Product Type
- 10. Rest of the World Medical Biomimetics Analysis, Insights and Forecast, 2020-2032
- 10.1. Market Analysis, Insights and Forecast - by Product Type
- 10.1.1. Orthopedic
- 10.1.2. Ophthalmology
- 10.1.3. Dental
- 10.1.4. Others
- 10.2. Market Analysis, Insights and Forecast - by Application
- 10.2.1. Plastic Surgery
- 10.2.2. Wound Healing
- 10.2.3. Tissue Engineering
- 10.2.4. Others
- 10.1. Market Analysis, Insights and Forecast - by Product Type
- 11. Competitive Analysis
- 11.1. Company Profiles
- 11.1.1 Skyland Brand Ventures
- 11.1.1.1. Company Overview
- 11.1.1.2. Products
- 11.1.1.3. Company Financials
- 11.1.1.4. SWOT Analysis
- 11.1.2 CellCore
- 11.1.2.1. Company Overview
- 11.1.2.2. Products
- 11.1.2.3. Company Financials
- 11.1.2.4. SWOT Analysis
- 11.1.3 Avinent Science and Technology
- 11.1.3.1. Company Overview
- 11.1.3.2. Products
- 11.1.3.3. Company Financials
- 11.1.3.4. SWOT Analysis
- 11.1.4 Veryan Medical*List Not Exhaustive
- 11.1.4.1. Company Overview
- 11.1.4.2. Products
- 11.1.4.3. Company Financials
- 11.1.4.4. SWOT Analysis
- 11.1.5 Blatchford Ltd
- 11.1.5.1. Company Overview
- 11.1.5.2. Products
- 11.1.5.3. Company Financials
- 11.1.5.4. SWOT Analysis
- 11.1.6 Applied Biomimetic
- 11.1.6.1. Company Overview
- 11.1.6.2. Products
- 11.1.6.3. Company Financials
- 11.1.6.4. SWOT Analysis
- 11.1.7 Biomimetic Solutions
- 11.1.7.1. Company Overview
- 11.1.7.2. Products
- 11.1.7.3. Company Financials
- 11.1.7.4. SWOT Analysis
- 11.1.8 SynTouch Inc
- 11.1.8.1. Company Overview
- 11.1.8.2. Products
- 11.1.8.3. Company Financials
- 11.1.8.4. SWOT Analysis
- 11.1.9 Abbott
- 11.1.9.1. Company Overview
- 11.1.9.2. Products
- 11.1.9.3. Company Financials
- 11.1.9.4. SWOT Analysis
- 11.1.10 Forschungszentrum Jlich
- 11.1.10.1. Company Overview
- 11.1.10.2. Products
- 11.1.10.3. Company Financials
- 11.1.10.4. SWOT Analysis
- 11.1.1 Skyland Brand Ventures
- 11.2. Market Entropy
- 11.2.1 Company's Key Areas Served
- 11.2.2 Recent Developments
- 11.3. Company Market Share Analysis 2025
- 11.3.1 Top 5 Companies Market Share Analysis
- 11.3.2 Top 3 Companies Market Share Analysis
- 11.4. List of Potential Customers
- 12. Research Methodology
List of Figures
- Figure 1: Global Medical Biomimetics Revenue Breakdown (Billion, %) by Region 2025 & 2033
- Figure 2: North America Medical Biomimetics Revenue (Billion), by Product Type 2025 & 2033
- Figure 3: North America Medical Biomimetics Revenue Share (%), by Product Type 2025 & 2033
- Figure 4: North America Medical Biomimetics Revenue (Billion), by Application 2025 & 2033
- Figure 5: North America Medical Biomimetics Revenue Share (%), by Application 2025 & 2033
- Figure 6: North America Medical Biomimetics Revenue (Billion), by Country 2025 & 2033
- Figure 7: North America Medical Biomimetics Revenue Share (%), by Country 2025 & 2033
- Figure 8: Europe Medical Biomimetics Revenue (Billion), by Product Type 2025 & 2033
- Figure 9: Europe Medical Biomimetics Revenue Share (%), by Product Type 2025 & 2033
- Figure 10: Europe Medical Biomimetics Revenue (Billion), by Application 2025 & 2033
- Figure 11: Europe Medical Biomimetics Revenue Share (%), by Application 2025 & 2033
- Figure 12: Europe Medical Biomimetics Revenue (Billion), by Country 2025 & 2033
- Figure 13: Europe Medical Biomimetics Revenue Share (%), by Country 2025 & 2033
- Figure 14: Asia Pacific Medical Biomimetics Revenue (Billion), by Product Type 2025 & 2033
- Figure 15: Asia Pacific Medical Biomimetics Revenue Share (%), by Product Type 2025 & 2033
- Figure 16: Asia Pacific Medical Biomimetics Revenue (Billion), by Application 2025 & 2033
- Figure 17: Asia Pacific Medical Biomimetics Revenue Share (%), by Application 2025 & 2033
- Figure 18: Asia Pacific Medical Biomimetics Revenue (Billion), by Country 2025 & 2033
- Figure 19: Asia Pacific Medical Biomimetics Revenue Share (%), by Country 2025 & 2033
- Figure 20: Rest of the World Medical Biomimetics Revenue (Billion), by Product Type 2025 & 2033
- Figure 21: Rest of the World Medical Biomimetics Revenue Share (%), by Product Type 2025 & 2033
- Figure 22: Rest of the World Medical Biomimetics Revenue (Billion), by Application 2025 & 2033
- Figure 23: Rest of the World Medical Biomimetics Revenue Share (%), by Application 2025 & 2033
- Figure 24: Rest of the World Medical Biomimetics Revenue (Billion), by Country 2025 & 2033
- Figure 25: Rest of the World Medical Biomimetics Revenue Share (%), by Country 2025 & 2033
List of Tables
- Table 1: Global Medical Biomimetics Revenue Billion Forecast, by Product Type 2020 & 2033
- Table 2: Global Medical Biomimetics Revenue Billion Forecast, by Application 2020 & 2033
- Table 3: Global Medical Biomimetics Revenue Billion Forecast, by Region 2020 & 2033
- Table 4: Global Medical Biomimetics Revenue Billion Forecast, by Product Type 2020 & 2033
- Table 5: Global Medical Biomimetics Revenue Billion Forecast, by Application 2020 & 2033
- Table 6: Global Medical Biomimetics Revenue Billion Forecast, by Country 2020 & 2033
- Table 7: United States Medical Biomimetics Revenue (Billion) Forecast, by Application 2020 & 2033
- Table 8: Canada Medical Biomimetics Revenue (Billion) Forecast, by Application 2020 & 2033
- Table 9: Mexico Medical Biomimetics Revenue (Billion) Forecast, by Application 2020 & 2033
- Table 10: Global Medical Biomimetics Revenue Billion Forecast, by Product Type 2020 & 2033
- Table 11: Global Medical Biomimetics Revenue Billion Forecast, by Application 2020 & 2033
- Table 12: Global Medical Biomimetics Revenue Billion Forecast, by Country 2020 & 2033
- Table 13: Germany Medical Biomimetics Revenue (Billion) Forecast, by Application 2020 & 2033
- Table 14: United Kingdom Medical Biomimetics Revenue (Billion) Forecast, by Application 2020 & 2033
- Table 15: France Medical Biomimetics Revenue (Billion) Forecast, by Application 2020 & 2033
- Table 16: Italy Medical Biomimetics Revenue (Billion) Forecast, by Application 2020 & 2033
- Table 17: Spain Medical Biomimetics Revenue (Billion) Forecast, by Application 2020 & 2033
- Table 18: Rest of Europe Medical Biomimetics Revenue (Billion) Forecast, by Application 2020 & 2033
- Table 19: Global Medical Biomimetics Revenue Billion Forecast, by Product Type 2020 & 2033
- Table 20: Global Medical Biomimetics Revenue Billion Forecast, by Application 2020 & 2033
- Table 21: Global Medical Biomimetics Revenue Billion Forecast, by Country 2020 & 2033
- Table 22: China Medical Biomimetics Revenue (Billion) Forecast, by Application 2020 & 2033
- Table 23: Japan Medical Biomimetics Revenue (Billion) Forecast, by Application 2020 & 2033
- Table 24: India Medical Biomimetics Revenue (Billion) Forecast, by Application 2020 & 2033
- Table 25: Australia Medical Biomimetics Revenue (Billion) Forecast, by Application 2020 & 2033
- Table 26: South Korea Medical Biomimetics Revenue (Billion) Forecast, by Application 2020 & 2033
- Table 27: Rest of Asia Pacific Medical Biomimetics Revenue (Billion) Forecast, by Application 2020 & 2033
- Table 28: Global Medical Biomimetics Revenue Billion Forecast, by Product Type 2020 & 2033
- Table 29: Global Medical Biomimetics Revenue Billion Forecast, by Application 2020 & 2033
- Table 30: Global Medical Biomimetics Revenue Billion Forecast, by Country 2020 & 2033
Frequently Asked Questions
1. What is the projected Compound Annual Growth Rate (CAGR) of the Medical Biomimetics?
The projected CAGR is approximately 5.70%.
2. Which companies are prominent players in the Medical Biomimetics?
Key companies in the market include Skyland Brand Ventures, CellCore, Avinent Science and Technology, Veryan Medical*List Not Exhaustive, Blatchford Ltd, Applied Biomimetic, Biomimetic Solutions, SynTouch Inc, Abbott, Forschungszentrum Jlich.
3. What are the main segments of the Medical Biomimetics?
The market segments include Product Type, Application.
4. Can you provide details about the market size?
The market size is estimated to be USD XX Billion as of 2022.
5. What are some drivers contributing to market growth?
; Growing Advancement in Nanotechnology; Growing Tissue Engineering Market.
6. What are the notable trends driving market growth?
Orthopaedic is Expected to Exhibit a Significant Growth Over the Forecast Period.
7. Are there any restraints impacting market growth?
Stringent Regulatory Framework.
8. Can you provide examples of recent developments in the market?
N/A
9. What pricing options are available for accessing the report?
Pricing options include single-user, multi-user, and enterprise licenses priced at USD 4750, USD 5250, and USD 8750 respectively.
10. Is the market size provided in terms of value or volume?
The market size is provided in terms of value, measured in Billion.
11. Are there any specific market keywords associated with the report?
Yes, the market keyword associated with the report is "Medical Biomimetics," which aids in identifying and referencing the specific market segment covered.
12. How do I determine which pricing option suits my needs best?
The pricing options vary based on user requirements and access needs. Individual users may opt for single-user licenses, while businesses requiring broader access may choose multi-user or enterprise licenses for cost-effective access to the report.
13. Are there any additional resources or data provided in the Medical Biomimetics report?
While the report offers comprehensive insights, it's advisable to review the specific contents or supplementary materials provided to ascertain if additional resources or data are available.
14. How can I stay updated on further developments or reports in the Medical Biomimetics?
To stay informed about further developments, trends, and reports in the Medical Biomimetics, consider subscribing to industry newsletters, following relevant companies and organizations, or regularly checking reputable industry news sources and publications.
Methodology
Step 1 - Identification of Relevant Samples Size from Population Database


Step 2 - Approaches for Defining Global Market Size (Value, Volume* & Price*)

Note*: In applicable scenarios
Step 3 - Data Sources
Primary Research
- Web Analytics
- Survey Reports
- Research Institute
- Latest Research Reports
- Opinion Leaders
Secondary Research
- Annual Reports
- White Paper
- Latest Press Release
- Industry Association
- Paid Database
- Investor Presentations

Step 4 - Data Triangulation
Involves using different sources of information in order to increase the validity of a study
These sources are likely to be stakeholders in a program - participants, other researchers, program staff, other community members, and so on.
Then we put all data in single framework & apply various statistical tools to find out the dynamic on the market.
During the analysis stage, feedback from the stakeholder groups would be compared to determine areas of agreement as well as areas of divergence