

Key Insights
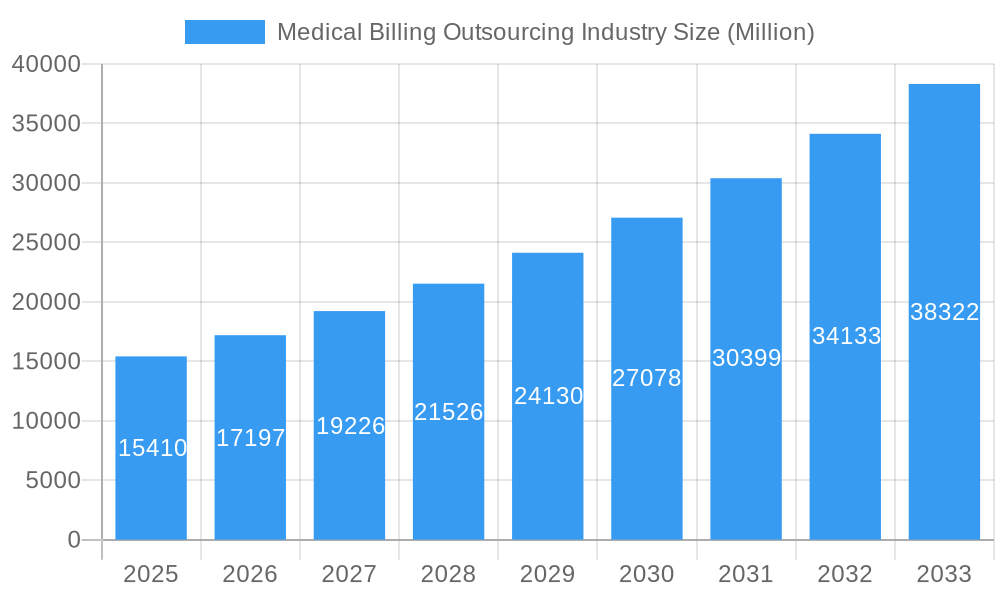
The medical billing outsourcing market is experiencing robust growth, projected to reach \$15.41 billion in 2025 and exhibiting a Compound Annual Growth Rate (CAGR) of 11.36% from 2025 to 2033. This expansion is driven by several key factors. The increasing administrative burden on healthcare providers, coupled with the rising complexity of medical billing and coding regulations, necessitates outsourcing to specialized firms. Hospitals and physician offices are increasingly adopting this strategy to improve operational efficiency, reduce costs associated with in-house billing departments, and enhance revenue cycle management. Technological advancements, such as AI-powered automation and cloud-based solutions, are further streamlining processes and improving accuracy, contributing to market growth. The shift towards value-based care models also plays a significant role, as providers seek solutions to optimize reimbursements and manage financial performance more effectively. North America currently holds the largest market share due to high healthcare spending and early adoption of outsourcing solutions, but the Asia-Pacific region is projected to witness significant growth fueled by increasing healthcare expenditure and technological infrastructure development.
Medical Billing Outsourcing Industry Market Size (In Billion)
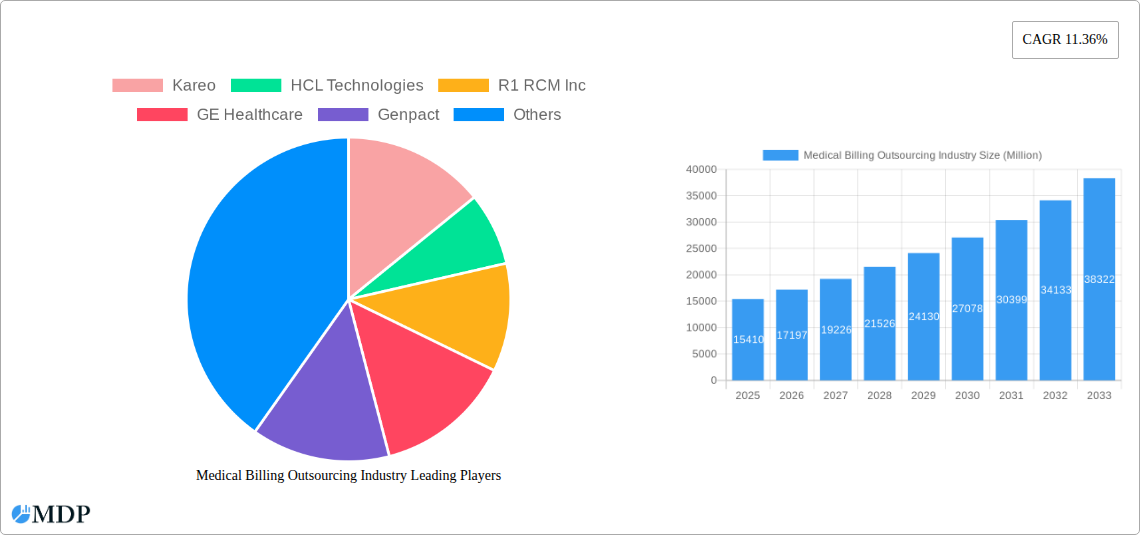
Segmentation analysis reveals strong growth in both front-end and back-end medical billing outsourcing services. Front-end services, including patient registration and insurance verification, are experiencing high demand due to their impact on claim accuracy and timely processing. Back-end services, such as claims submission, denial management, and accounts receivable follow-up, remain crucial for revenue maximization and efficient cash flow. Competition in this market is intense, with established players such as Kareo, HCL Technologies, and R1 RCM Inc. vying for market share alongside other prominent companies like GE Healthcare, Genpact, and Cerner Corporation. The market is expected to consolidate further as larger players acquire smaller firms and technology continues to drive efficiency gains. Future growth will be influenced by factors such as evolving healthcare regulations, the adoption of advanced analytics, and the ongoing digital transformation of the healthcare industry.
Medical Billing Outsourcing Industry Company Market Share
Medical Billing Outsourcing Market Report: 2019-2033 Forecast
This comprehensive report provides an in-depth analysis of the Medical Billing Outsourcing industry, projecting a market value exceeding $XX Billion by 2033. We explore market dynamics, leading players, emerging trends, and future growth opportunities, providing actionable insights for stakeholders across the healthcare ecosystem. The study period covers 2019-2033, with a base year of 2025 and a forecast period of 2025-2033.
Medical Billing Outsourcing Industry Market Dynamics & Concentration
The medical billing outsourcing market exhibits moderate concentration, with key players such as Kareo, HCL Technologies, R1 RCM Inc., GE Healthcare, and Genpact holding significant market share. However, the market also accommodates numerous smaller players, fostering competition. Innovation drivers include advancements in AI-powered automation, cloud-based solutions, and data analytics to enhance efficiency and accuracy. Stringent HIPAA regulations and data privacy laws form the core of the regulatory framework, impacting market practices. Product substitutes are limited, given the specialized nature of medical billing. End-user trends show a growing preference for outsourced solutions due to cost optimization and focus on core competencies. M&A activity is notable, with significant deals shaping market dynamics. For example, the acquisition of Cerner's RevWorks by R1 RCM in 2020 significantly altered the competitive landscape. During the historical period (2019-2024), approximately xx M&A deals occurred, with an estimated xx% increase in market concentration.
- Market Share: Top 5 players account for approximately xx% of the market.
- M&A Activity: An average of xx deals per year were observed between 2019 and 2024.
- Regulatory Landscape: HIPAA compliance remains a major factor influencing market strategies.
Medical Billing Outsourcing Industry Industry Trends & Analysis
The Medical Billing Outsourcing market is experiencing robust growth, driven by the increasing volume of healthcare claims, rising healthcare costs, and the growing adoption of electronic health records (EHRs). The Compound Annual Growth Rate (CAGR) is projected at xx% during the forecast period (2025-2033). Technological disruptions, particularly in AI and machine learning, are streamlining billing processes, improving accuracy, and reducing operational costs. Consumer preferences are shifting towards providers offering comprehensive solutions and enhanced patient engagement capabilities. The competitive dynamics are characterized by intense competition among established players and the emergence of niche providers focusing on specific healthcare segments. Market penetration of outsourced billing solutions is steadily rising, particularly among smaller healthcare providers seeking cost-effective solutions. In 2025, the market penetration rate is estimated at xx%.
Leading Markets & Segments in Medical Billing Outsourcing Industry
The North American region currently dominates the medical billing outsourcing market, driven by factors such as high healthcare expenditure, advanced technological infrastructure, and a robust regulatory framework. Within the segments:
By Service: The back-end segment holds a larger market share than the front-end segment due to higher complexity and specialization in claims processing and payment posting.
By End-User: Hospitals account for the largest share of the market due to the substantial volume of billing transactions involved in their operations. However, the physician's office segment is expected to exhibit higher growth due to their increasing adoption of outsourcing solutions. Other end-users include ambulatory surgery centers and long-term care facilities.
Key Drivers:
- North America: High healthcare expenditure, strong regulatory environment, advanced infrastructure.
- Hospitals: High billing volumes, need for efficient revenue cycle management.
- Physician Offices: Increased adoption of EHR systems, need for cost-effective billing solutions.
Medical Billing Outsourcing Industry Product Developments
Recent product innovations include cloud-based platforms that offer enhanced security, scalability, and accessibility. AI-powered solutions are becoming increasingly prevalent, automating tasks such as claims processing and payment reconciliation. These innovations offer competitive advantages by improving accuracy, reducing costs, and enhancing efficiency. The focus is on integration with existing EHR systems and data analytics capabilities for better revenue cycle management.
Key Drivers of Medical Billing Outsourcing Industry Growth
Technological advancements, particularly in AI and automation, are significantly contributing to market growth by streamlining processes and improving accuracy. Economic factors such as rising healthcare costs and the need for cost optimization are driving the adoption of outsourced billing solutions. Furthermore, stringent regulatory requirements around HIPAA compliance are pushing healthcare providers to seek expertise from specialized outsourcing providers.
Challenges in the Medical Billing Outsourcing Industry Market
Key challenges include maintaining data security and complying with stringent regulatory standards like HIPAA. Supply chain disruptions and fluctuating labor costs can impact operational efficiency. Moreover, intense competition and price pressures from other players can impact profitability.
Emerging Opportunities in Medical Billing Outsourcing Industry
Strategic partnerships between billing outsourcing firms and healthcare technology providers hold significant potential for market expansion. Technological breakthroughs in AI and machine learning are opening new avenues for process automation and improved revenue cycle management. Expanding into emerging markets with growing healthcare sectors presents substantial growth opportunities.
Leading Players in the Medical Billing Outsourcing Industry Sector
Key Milestones in Medical Billing Outsourcing Industry Industry
- November 2020: Conduent Incorporated's partnership with Experian Health to enhance patient engagement and accelerate prescription drug assistance approvals. This improved patient experience and streamlined processes.
- June 2020: R1 RCM Inc.'s acquisition of Cerner's RevWorks, expanding their market share and service offerings in revenue cycle management. This deal solidified R1 RCM's position as a major player in the market.
Strategic Outlook for Medical Billing Outsourcing Industry Market
The Medical Billing Outsourcing market is poised for significant growth driven by technological innovation, increasing healthcare expenditure, and a growing preference for specialized services. Strategic partnerships and investments in AI and automation will be critical for achieving a competitive edge. Expanding into underserved markets and offering customized solutions will further enhance growth potential.
Medical Billing Outsourcing Industry Segmentation
-
1. Service
- 1.1. Front End
- 1.2. Back End
-
2. End User
- 2.1. Hospitals
- 2.2. Physicians Office
- 2.3. Other End Users
Medical Billing Outsourcing Industry Segmentation By Geography
-
1. North America
- 1.1. United States
- 1.2. Canada
- 1.3. Mexico
-
2. Europe
- 2.1. Germany
- 2.2. United Kingdom
- 2.3. France
- 2.4. Italy
- 2.5. Spain
- 2.6. Rest of Europe
-
3. Asia Pacific
- 3.1. China
- 3.2. Japan
- 3.3. India
- 3.4. Australia
- 3.5. South Korea
- 3.6. Rest of Asia Pacific
-
4. Middle East and Africa
- 4.1. GCC
- 4.2. South Africa
- 4.3. Rest of Middle East and Africa
-
5. South America
- 5.1. Brazil
- 5.2. Argentina
- 5.3. Rest of South America
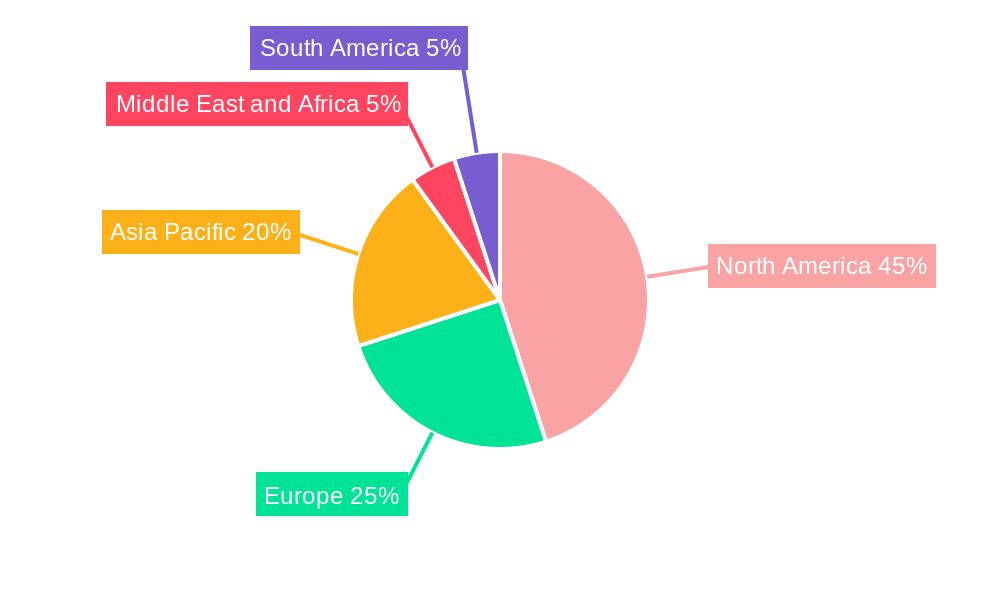
Medical Billing Outsourcing Industry Regional Market Share
Geographic Coverage of Medical Billing Outsourcing Industry
Medical Billing Outsourcing Industry REPORT HIGHLIGHTS
| Aspects | Details |
|---|---|
| Study Period | 2020-2034 |
| Base Year | 2025 |
| Estimated Year | 2026 |
| Forecast Period | 2026-2034 |
| Historical Period | 2020-2025 |
| Growth Rate | CAGR of 11.36% from 2020-2034 |
| Segmentation |
|
Table of Contents
- 1. Introduction
- 1.1. Research Scope
- 1.2. Market Segmentation
- 1.3. Research Objective
- 1.4. Definitions and Assumptions
- 2. Executive Summary
- 2.1. Market Snapshot
- 3. Market Dynamics
- 3.1. Market Drivers
- 3.2. Market Restrains
- 3.3. Market Trends
- 3.4. Market Opportunities
- 4. Market Factor Analysis
- 4.1. Porters Five Forces
- 4.1.1. Bargaining Power of Suppliers
- 4.1.2. Bargaining Power of Buyers
- 4.1.3. Threat of New Entrants
- 4.1.4. Threat of Substitutes
- 4.1.5. Competitive Rivalry
- 4.2. PESTEL analysis
- 4.3. BCG Analysis
- 4.3.1. Stars (High Growth, High Market Share)
- 4.3.2. Cash Cows (Low Growth, High Market Share)
- 4.3.3. Question Mark (High Growth, Low Market Share)
- 4.3.4. Dogs (Low Growth, Low Market Share)
- 4.4. Ansoff Matrix Analysis
- 4.5. Supply Chain Analysis
- 4.6. Regulatory Landscape
- 4.7. Current Market Potential and Opportunity Assessment (TAM–SAM–SOM Framework)
- 4.8. MDP Analyst Note
- 4.1. Porters Five Forces
- 5. Market Analysis, Insights and Forecast 2021-2033
- 5.1. Market Analysis, Insights and Forecast - by Service
- 5.1.1. Front End
- 5.1.2. Back End
- 5.2. Market Analysis, Insights and Forecast - by End User
- 5.2.1. Hospitals
- 5.2.2. Physicians Office
- 5.2.3. Other End Users
- 5.3. Market Analysis, Insights and Forecast - by Region
- 5.3.1. North America
- 5.3.2. Europe
- 5.3.3. Asia Pacific
- 5.3.4. Middle East and Africa
- 5.3.5. South America
- 5.1. Market Analysis, Insights and Forecast - by Service
- 6. Global Medical Billing Outsourcing Industry Analysis, Insights and Forecast, 2021-2033
- 6.1. Market Analysis, Insights and Forecast - by Service
- 6.1.1. Front End
- 6.1.2. Back End
- 6.2. Market Analysis, Insights and Forecast - by End User
- 6.2.1. Hospitals
- 6.2.2. Physicians Office
- 6.2.3. Other End Users
- 6.1. Market Analysis, Insights and Forecast - by Service
- 7. North America Medical Billing Outsourcing Industry Analysis, Insights and Forecast, 2020-2032
- 7.1. Market Analysis, Insights and Forecast - by Service
- 7.1.1. Front End
- 7.1.2. Back End
- 7.2. Market Analysis, Insights and Forecast - by End User
- 7.2.1. Hospitals
- 7.2.2. Physicians Office
- 7.2.3. Other End Users
- 7.1. Market Analysis, Insights and Forecast - by Service
- 8. Europe Medical Billing Outsourcing Industry Analysis, Insights and Forecast, 2020-2032
- 8.1. Market Analysis, Insights and Forecast - by Service
- 8.1.1. Front End
- 8.1.2. Back End
- 8.2. Market Analysis, Insights and Forecast - by End User
- 8.2.1. Hospitals
- 8.2.2. Physicians Office
- 8.2.3. Other End Users
- 8.1. Market Analysis, Insights and Forecast - by Service
- 9. Asia Pacific Medical Billing Outsourcing Industry Analysis, Insights and Forecast, 2020-2032
- 9.1. Market Analysis, Insights and Forecast - by Service
- 9.1.1. Front End
- 9.1.2. Back End
- 9.2. Market Analysis, Insights and Forecast - by End User
- 9.2.1. Hospitals
- 9.2.2. Physicians Office
- 9.2.3. Other End Users
- 9.1. Market Analysis, Insights and Forecast - by Service
- 10. Middle East and Africa Medical Billing Outsourcing Industry Analysis, Insights and Forecast, 2020-2032
- 10.1. Market Analysis, Insights and Forecast - by Service
- 10.1.1. Front End
- 10.1.2. Back End
- 10.2. Market Analysis, Insights and Forecast - by End User
- 10.2.1. Hospitals
- 10.2.2. Physicians Office
- 10.2.3. Other End Users
- 10.1. Market Analysis, Insights and Forecast - by Service
- 11. South America Medical Billing Outsourcing Industry Analysis, Insights and Forecast, 2020-2032
- 11.1. Market Analysis, Insights and Forecast - by Service
- 11.1.1. Front End
- 11.1.2. Back End
- 11.2. Market Analysis, Insights and Forecast - by End User
- 11.2.1. Hospitals
- 11.2.2. Physicians Office
- 11.2.3. Other End Users
- 11.1. Market Analysis, Insights and Forecast - by Service
- 12. Competitive Analysis
- 12.1. Company Profiles
- 12.1.1 Kareo
- 12.1.1.1. Company Overview
- 12.1.1.2. Products
- 12.1.1.3. Company Financials
- 12.1.1.4. SWOT Analysis
- 12.1.2 HCL Technologies
- 12.1.2.1. Company Overview
- 12.1.2.2. Products
- 12.1.2.3. Company Financials
- 12.1.2.4. SWOT Analysis
- 12.1.3 R1 RCM Inc
- 12.1.3.1. Company Overview
- 12.1.3.2. Products
- 12.1.3.3. Company Financials
- 12.1.3.4. SWOT Analysis
- 12.1.4 GE Healthcare
- 12.1.4.1. Company Overview
- 12.1.4.2. Products
- 12.1.4.3. Company Financials
- 12.1.4.4. SWOT Analysis
- 12.1.5 Genpact
- 12.1.5.1. Company Overview
- 12.1.5.2. Products
- 12.1.5.3. Company Financials
- 12.1.5.4. SWOT Analysis
- 12.1.6 Experian Information Solutions Inc
- 12.1.6.1. Company Overview
- 12.1.6.2. Products
- 12.1.6.3. Company Financials
- 12.1.6.4. SWOT Analysis
- 12.1.7 Quest Diagnostics
- 12.1.7.1. Company Overview
- 12.1.7.2. Products
- 12.1.7.3. Company Financials
- 12.1.7.4. SWOT Analysis
- 12.1.8 Cerner Corporation
- 12.1.8.1. Company Overview
- 12.1.8.2. Products
- 12.1.8.3. Company Financials
- 12.1.8.4. SWOT Analysis
- 12.1.9 Allscripts Healthcare Solutions Inc
- 12.1.9.1. Company Overview
- 12.1.9.2. Products
- 12.1.9.3. Company Financials
- 12.1.9.4. SWOT Analysis
- 12.1.10 The SSI Groups
- 12.1.10.1. Company Overview
- 12.1.10.2. Products
- 12.1.10.3. Company Financials
- 12.1.10.4. SWOT Analysis
- 12.1.11 McKesson Corporation
- 12.1.11.1. Company Overview
- 12.1.11.2. Products
- 12.1.11.3. Company Financials
- 12.1.11.4. SWOT Analysis
- 12.1.12 EClinicalWorks
- 12.1.12.1. Company Overview
- 12.1.12.2. Products
- 12.1.12.3. Company Financials
- 12.1.12.4. SWOT Analysis
- 12.1.1 Kareo
- 12.2. Market Entropy
- 12.2.1 Company's Key Areas Served
- 12.2.2 Recent Developments
- 12.3. Company Market Share Analysis 2025
- 12.3.1 Top 5 Companies Market Share Analysis
- 12.3.2 Top 3 Companies Market Share Analysis
- 12.4. List of Potential Customers
- 13. Research Methodology
List of Figures
- Figure 1: Global Medical Billing Outsourcing Industry Revenue Breakdown (Million, %) by Region 2025 & 2033
- Figure 2: Global Medical Billing Outsourcing Industry Volume Breakdown (K Unit, %) by Region 2025 & 2033
- Figure 3: North America Medical Billing Outsourcing Industry Revenue (Million), by Service 2025 & 2033
- Figure 4: North America Medical Billing Outsourcing Industry Volume (K Unit), by Service 2025 & 2033
- Figure 5: North America Medical Billing Outsourcing Industry Revenue Share (%), by Service 2025 & 2033
- Figure 6: North America Medical Billing Outsourcing Industry Volume Share (%), by Service 2025 & 2033
- Figure 7: North America Medical Billing Outsourcing Industry Revenue (Million), by End User 2025 & 2033
- Figure 8: North America Medical Billing Outsourcing Industry Volume (K Unit), by End User 2025 & 2033
- Figure 9: North America Medical Billing Outsourcing Industry Revenue Share (%), by End User 2025 & 2033
- Figure 10: North America Medical Billing Outsourcing Industry Volume Share (%), by End User 2025 & 2033
- Figure 11: North America Medical Billing Outsourcing Industry Revenue (Million), by Country 2025 & 2033
- Figure 12: North America Medical Billing Outsourcing Industry Volume (K Unit), by Country 2025 & 2033
- Figure 13: North America Medical Billing Outsourcing Industry Revenue Share (%), by Country 2025 & 2033
- Figure 14: North America Medical Billing Outsourcing Industry Volume Share (%), by Country 2025 & 2033
- Figure 15: Europe Medical Billing Outsourcing Industry Revenue (Million), by Service 2025 & 2033
- Figure 16: Europe Medical Billing Outsourcing Industry Volume (K Unit), by Service 2025 & 2033
- Figure 17: Europe Medical Billing Outsourcing Industry Revenue Share (%), by Service 2025 & 2033
- Figure 18: Europe Medical Billing Outsourcing Industry Volume Share (%), by Service 2025 & 2033
- Figure 19: Europe Medical Billing Outsourcing Industry Revenue (Million), by End User 2025 & 2033
- Figure 20: Europe Medical Billing Outsourcing Industry Volume (K Unit), by End User 2025 & 2033
- Figure 21: Europe Medical Billing Outsourcing Industry Revenue Share (%), by End User 2025 & 2033
- Figure 22: Europe Medical Billing Outsourcing Industry Volume Share (%), by End User 2025 & 2033
- Figure 23: Europe Medical Billing Outsourcing Industry Revenue (Million), by Country 2025 & 2033
- Figure 24: Europe Medical Billing Outsourcing Industry Volume (K Unit), by Country 2025 & 2033
- Figure 25: Europe Medical Billing Outsourcing Industry Revenue Share (%), by Country 2025 & 2033
- Figure 26: Europe Medical Billing Outsourcing Industry Volume Share (%), by Country 2025 & 2033
- Figure 27: Asia Pacific Medical Billing Outsourcing Industry Revenue (Million), by Service 2025 & 2033
- Figure 28: Asia Pacific Medical Billing Outsourcing Industry Volume (K Unit), by Service 2025 & 2033
- Figure 29: Asia Pacific Medical Billing Outsourcing Industry Revenue Share (%), by Service 2025 & 2033
- Figure 30: Asia Pacific Medical Billing Outsourcing Industry Volume Share (%), by Service 2025 & 2033
- Figure 31: Asia Pacific Medical Billing Outsourcing Industry Revenue (Million), by End User 2025 & 2033
- Figure 32: Asia Pacific Medical Billing Outsourcing Industry Volume (K Unit), by End User 2025 & 2033
- Figure 33: Asia Pacific Medical Billing Outsourcing Industry Revenue Share (%), by End User 2025 & 2033
- Figure 34: Asia Pacific Medical Billing Outsourcing Industry Volume Share (%), by End User 2025 & 2033
- Figure 35: Asia Pacific Medical Billing Outsourcing Industry Revenue (Million), by Country 2025 & 2033
- Figure 36: Asia Pacific Medical Billing Outsourcing Industry Volume (K Unit), by Country 2025 & 2033
- Figure 37: Asia Pacific Medical Billing Outsourcing Industry Revenue Share (%), by Country 2025 & 2033
- Figure 38: Asia Pacific Medical Billing Outsourcing Industry Volume Share (%), by Country 2025 & 2033
- Figure 39: Middle East and Africa Medical Billing Outsourcing Industry Revenue (Million), by Service 2025 & 2033
- Figure 40: Middle East and Africa Medical Billing Outsourcing Industry Volume (K Unit), by Service 2025 & 2033
- Figure 41: Middle East and Africa Medical Billing Outsourcing Industry Revenue Share (%), by Service 2025 & 2033
- Figure 42: Middle East and Africa Medical Billing Outsourcing Industry Volume Share (%), by Service 2025 & 2033
- Figure 43: Middle East and Africa Medical Billing Outsourcing Industry Revenue (Million), by End User 2025 & 2033
- Figure 44: Middle East and Africa Medical Billing Outsourcing Industry Volume (K Unit), by End User 2025 & 2033
- Figure 45: Middle East and Africa Medical Billing Outsourcing Industry Revenue Share (%), by End User 2025 & 2033
- Figure 46: Middle East and Africa Medical Billing Outsourcing Industry Volume Share (%), by End User 2025 & 2033
- Figure 47: Middle East and Africa Medical Billing Outsourcing Industry Revenue (Million), by Country 2025 & 2033
- Figure 48: Middle East and Africa Medical Billing Outsourcing Industry Volume (K Unit), by Country 2025 & 2033
- Figure 49: Middle East and Africa Medical Billing Outsourcing Industry Revenue Share (%), by Country 2025 & 2033
- Figure 50: Middle East and Africa Medical Billing Outsourcing Industry Volume Share (%), by Country 2025 & 2033
- Figure 51: South America Medical Billing Outsourcing Industry Revenue (Million), by Service 2025 & 2033
- Figure 52: South America Medical Billing Outsourcing Industry Volume (K Unit), by Service 2025 & 2033
- Figure 53: South America Medical Billing Outsourcing Industry Revenue Share (%), by Service 2025 & 2033
- Figure 54: South America Medical Billing Outsourcing Industry Volume Share (%), by Service 2025 & 2033
- Figure 55: South America Medical Billing Outsourcing Industry Revenue (Million), by End User 2025 & 2033
- Figure 56: South America Medical Billing Outsourcing Industry Volume (K Unit), by End User 2025 & 2033
- Figure 57: South America Medical Billing Outsourcing Industry Revenue Share (%), by End User 2025 & 2033
- Figure 58: South America Medical Billing Outsourcing Industry Volume Share (%), by End User 2025 & 2033
- Figure 59: South America Medical Billing Outsourcing Industry Revenue (Million), by Country 2025 & 2033
- Figure 60: South America Medical Billing Outsourcing Industry Volume (K Unit), by Country 2025 & 2033
- Figure 61: South America Medical Billing Outsourcing Industry Revenue Share (%), by Country 2025 & 2033
- Figure 62: South America Medical Billing Outsourcing Industry Volume Share (%), by Country 2025 & 2033
List of Tables
- Table 1: Global Medical Billing Outsourcing Industry Revenue Million Forecast, by Service 2020 & 2033
- Table 2: Global Medical Billing Outsourcing Industry Volume K Unit Forecast, by Service 2020 & 2033
- Table 3: Global Medical Billing Outsourcing Industry Revenue Million Forecast, by End User 2020 & 2033
- Table 4: Global Medical Billing Outsourcing Industry Volume K Unit Forecast, by End User 2020 & 2033
- Table 5: Global Medical Billing Outsourcing Industry Revenue Million Forecast, by Region 2020 & 2033
- Table 6: Global Medical Billing Outsourcing Industry Volume K Unit Forecast, by Region 2020 & 2033
- Table 7: Global Medical Billing Outsourcing Industry Revenue Million Forecast, by Service 2020 & 2033
- Table 8: Global Medical Billing Outsourcing Industry Volume K Unit Forecast, by Service 2020 & 2033
- Table 9: Global Medical Billing Outsourcing Industry Revenue Million Forecast, by End User 2020 & 2033
- Table 10: Global Medical Billing Outsourcing Industry Volume K Unit Forecast, by End User 2020 & 2033
- Table 11: Global Medical Billing Outsourcing Industry Revenue Million Forecast, by Country 2020 & 2033
- Table 12: Global Medical Billing Outsourcing Industry Volume K Unit Forecast, by Country 2020 & 2033
- Table 13: United States Medical Billing Outsourcing Industry Revenue (Million) Forecast, by Application 2020 & 2033
- Table 14: United States Medical Billing Outsourcing Industry Volume (K Unit) Forecast, by Application 2020 & 2033
- Table 15: Canada Medical Billing Outsourcing Industry Revenue (Million) Forecast, by Application 2020 & 2033
- Table 16: Canada Medical Billing Outsourcing Industry Volume (K Unit) Forecast, by Application 2020 & 2033
- Table 17: Mexico Medical Billing Outsourcing Industry Revenue (Million) Forecast, by Application 2020 & 2033
- Table 18: Mexico Medical Billing Outsourcing Industry Volume (K Unit) Forecast, by Application 2020 & 2033
- Table 19: Global Medical Billing Outsourcing Industry Revenue Million Forecast, by Service 2020 & 2033
- Table 20: Global Medical Billing Outsourcing Industry Volume K Unit Forecast, by Service 2020 & 2033
- Table 21: Global Medical Billing Outsourcing Industry Revenue Million Forecast, by End User 2020 & 2033
- Table 22: Global Medical Billing Outsourcing Industry Volume K Unit Forecast, by End User 2020 & 2033
- Table 23: Global Medical Billing Outsourcing Industry Revenue Million Forecast, by Country 2020 & 2033
- Table 24: Global Medical Billing Outsourcing Industry Volume K Unit Forecast, by Country 2020 & 2033
- Table 25: Germany Medical Billing Outsourcing Industry Revenue (Million) Forecast, by Application 2020 & 2033
- Table 26: Germany Medical Billing Outsourcing Industry Volume (K Unit) Forecast, by Application 2020 & 2033
- Table 27: United Kingdom Medical Billing Outsourcing Industry Revenue (Million) Forecast, by Application 2020 & 2033
- Table 28: United Kingdom Medical Billing Outsourcing Industry Volume (K Unit) Forecast, by Application 2020 & 2033
- Table 29: France Medical Billing Outsourcing Industry Revenue (Million) Forecast, by Application 2020 & 2033
- Table 30: France Medical Billing Outsourcing Industry Volume (K Unit) Forecast, by Application 2020 & 2033
- Table 31: Italy Medical Billing Outsourcing Industry Revenue (Million) Forecast, by Application 2020 & 2033
- Table 32: Italy Medical Billing Outsourcing Industry Volume (K Unit) Forecast, by Application 2020 & 2033
- Table 33: Spain Medical Billing Outsourcing Industry Revenue (Million) Forecast, by Application 2020 & 2033
- Table 34: Spain Medical Billing Outsourcing Industry Volume (K Unit) Forecast, by Application 2020 & 2033
- Table 35: Rest of Europe Medical Billing Outsourcing Industry Revenue (Million) Forecast, by Application 2020 & 2033
- Table 36: Rest of Europe Medical Billing Outsourcing Industry Volume (K Unit) Forecast, by Application 2020 & 2033
- Table 37: Global Medical Billing Outsourcing Industry Revenue Million Forecast, by Service 2020 & 2033
- Table 38: Global Medical Billing Outsourcing Industry Volume K Unit Forecast, by Service 2020 & 2033
- Table 39: Global Medical Billing Outsourcing Industry Revenue Million Forecast, by End User 2020 & 2033
- Table 40: Global Medical Billing Outsourcing Industry Volume K Unit Forecast, by End User 2020 & 2033
- Table 41: Global Medical Billing Outsourcing Industry Revenue Million Forecast, by Country 2020 & 2033
- Table 42: Global Medical Billing Outsourcing Industry Volume K Unit Forecast, by Country 2020 & 2033
- Table 43: China Medical Billing Outsourcing Industry Revenue (Million) Forecast, by Application 2020 & 2033
- Table 44: China Medical Billing Outsourcing Industry Volume (K Unit) Forecast, by Application 2020 & 2033
- Table 45: Japan Medical Billing Outsourcing Industry Revenue (Million) Forecast, by Application 2020 & 2033
- Table 46: Japan Medical Billing Outsourcing Industry Volume (K Unit) Forecast, by Application 2020 & 2033
- Table 47: India Medical Billing Outsourcing Industry Revenue (Million) Forecast, by Application 2020 & 2033
- Table 48: India Medical Billing Outsourcing Industry Volume (K Unit) Forecast, by Application 2020 & 2033
- Table 49: Australia Medical Billing Outsourcing Industry Revenue (Million) Forecast, by Application 2020 & 2033
- Table 50: Australia Medical Billing Outsourcing Industry Volume (K Unit) Forecast, by Application 2020 & 2033
- Table 51: South Korea Medical Billing Outsourcing Industry Revenue (Million) Forecast, by Application 2020 & 2033
- Table 52: South Korea Medical Billing Outsourcing Industry Volume (K Unit) Forecast, by Application 2020 & 2033
- Table 53: Rest of Asia Pacific Medical Billing Outsourcing Industry Revenue (Million) Forecast, by Application 2020 & 2033
- Table 54: Rest of Asia Pacific Medical Billing Outsourcing Industry Volume (K Unit) Forecast, by Application 2020 & 2033
- Table 55: Global Medical Billing Outsourcing Industry Revenue Million Forecast, by Service 2020 & 2033
- Table 56: Global Medical Billing Outsourcing Industry Volume K Unit Forecast, by Service 2020 & 2033
- Table 57: Global Medical Billing Outsourcing Industry Revenue Million Forecast, by End User 2020 & 2033
- Table 58: Global Medical Billing Outsourcing Industry Volume K Unit Forecast, by End User 2020 & 2033
- Table 59: Global Medical Billing Outsourcing Industry Revenue Million Forecast, by Country 2020 & 2033
- Table 60: Global Medical Billing Outsourcing Industry Volume K Unit Forecast, by Country 2020 & 2033
- Table 61: GCC Medical Billing Outsourcing Industry Revenue (Million) Forecast, by Application 2020 & 2033
- Table 62: GCC Medical Billing Outsourcing Industry Volume (K Unit) Forecast, by Application 2020 & 2033
- Table 63: South Africa Medical Billing Outsourcing Industry Revenue (Million) Forecast, by Application 2020 & 2033
- Table 64: South Africa Medical Billing Outsourcing Industry Volume (K Unit) Forecast, by Application 2020 & 2033
- Table 65: Rest of Middle East and Africa Medical Billing Outsourcing Industry Revenue (Million) Forecast, by Application 2020 & 2033
- Table 66: Rest of Middle East and Africa Medical Billing Outsourcing Industry Volume (K Unit) Forecast, by Application 2020 & 2033
- Table 67: Global Medical Billing Outsourcing Industry Revenue Million Forecast, by Service 2020 & 2033
- Table 68: Global Medical Billing Outsourcing Industry Volume K Unit Forecast, by Service 2020 & 2033
- Table 69: Global Medical Billing Outsourcing Industry Revenue Million Forecast, by End User 2020 & 2033
- Table 70: Global Medical Billing Outsourcing Industry Volume K Unit Forecast, by End User 2020 & 2033
- Table 71: Global Medical Billing Outsourcing Industry Revenue Million Forecast, by Country 2020 & 2033
- Table 72: Global Medical Billing Outsourcing Industry Volume K Unit Forecast, by Country 2020 & 2033
- Table 73: Brazil Medical Billing Outsourcing Industry Revenue (Million) Forecast, by Application 2020 & 2033
- Table 74: Brazil Medical Billing Outsourcing Industry Volume (K Unit) Forecast, by Application 2020 & 2033
- Table 75: Argentina Medical Billing Outsourcing Industry Revenue (Million) Forecast, by Application 2020 & 2033
- Table 76: Argentina Medical Billing Outsourcing Industry Volume (K Unit) Forecast, by Application 2020 & 2033
- Table 77: Rest of South America Medical Billing Outsourcing Industry Revenue (Million) Forecast, by Application 2020 & 2033
- Table 78: Rest of South America Medical Billing Outsourcing Industry Volume (K Unit) Forecast, by Application 2020 & 2033
Frequently Asked Questions
1. What is the projected Compound Annual Growth Rate (CAGR) of the Medical Billing Outsourcing Industry?
The projected CAGR is approximately 11.36%.
2. Which companies are prominent players in the Medical Billing Outsourcing Industry?
Key companies in the market include Kareo, HCL Technologies, R1 RCM Inc, GE Healthcare, Genpact, Experian Information Solutions Inc, Quest Diagnostics, Cerner Corporation, Allscripts Healthcare Solutions Inc, The SSI Groups, McKesson Corporation, EClinicalWorks.
3. What are the main segments of the Medical Billing Outsourcing Industry?
The market segments include Service, End User.
4. Can you provide details about the market size?
The market size is estimated to be USD 15.41 Million as of 2022.
5. What are some drivers contributing to market growth?
Growing Emphasis on Compliance and Risk Management; Increasing Need to Make Billing Processes Efficient; Efforts to Contain and Decrease In-house Processing Costs.
6. What are the notable trends driving market growth?
Hospital Outsourced Medical Billing is Expected to Grow at a Good Rate Over the Forecast Period.
7. Are there any restraints impacting market growth?
Increasing Legislative and Regulatory Pressure; High Costs of Technology and Privacy Issues.
8. Can you provide examples of recent developments in the market?
In November 2020, Conduent Incorporated announced a commercial agreement with Experian Health, a leading provider of revenue cycle management products that include patient engagement, patient access, and patient collections. The agreement allows Conduent's digital IntelliHealth platform to connect with Experian's consumer data and electronic income verification tool to speed prescription drug assistance approvals and shorten prescription fulfillment and time to therapy.
9. What pricing options are available for accessing the report?
Pricing options include single-user, multi-user, and enterprise licenses priced at USD 4750, USD 5250, and USD 8750 respectively.
10. Is the market size provided in terms of value or volume?
The market size is provided in terms of value, measured in Million and volume, measured in K Unit.
11. Are there any specific market keywords associated with the report?
Yes, the market keyword associated with the report is "Medical Billing Outsourcing Industry," which aids in identifying and referencing the specific market segment covered.
12. How do I determine which pricing option suits my needs best?
The pricing options vary based on user requirements and access needs. Individual users may opt for single-user licenses, while businesses requiring broader access may choose multi-user or enterprise licenses for cost-effective access to the report.
13. Are there any additional resources or data provided in the Medical Billing Outsourcing Industry report?
While the report offers comprehensive insights, it's advisable to review the specific contents or supplementary materials provided to ascertain if additional resources or data are available.
14. How can I stay updated on further developments or reports in the Medical Billing Outsourcing Industry?
To stay informed about further developments, trends, and reports in the Medical Billing Outsourcing Industry, consider subscribing to industry newsletters, following relevant companies and organizations, or regularly checking reputable industry news sources and publications.
Methodology
Step 1 - Identification of Relevant Samples Size from Population Database


Step 2 - Approaches for Defining Global Market Size (Value, Volume* & Price*)

Note*: In applicable scenarios
Step 3 - Data Sources
Primary Research
- Web Analytics
- Survey Reports
- Research Institute
- Latest Research Reports
- Opinion Leaders
Secondary Research
- Annual Reports
- White Paper
- Latest Press Release
- Industry Association
- Paid Database
- Investor Presentations

Step 4 - Data Triangulation
Involves using different sources of information in order to increase the validity of a study
These sources are likely to be stakeholders in a program - participants, other researchers, program staff, other community members, and so on.
Then we put all data in single framework & apply various statistical tools to find out the dynamic on the market.
During the analysis stage, feedback from the stakeholder groups would be compared to determine areas of agreement as well as areas of divergence