

Key Insights
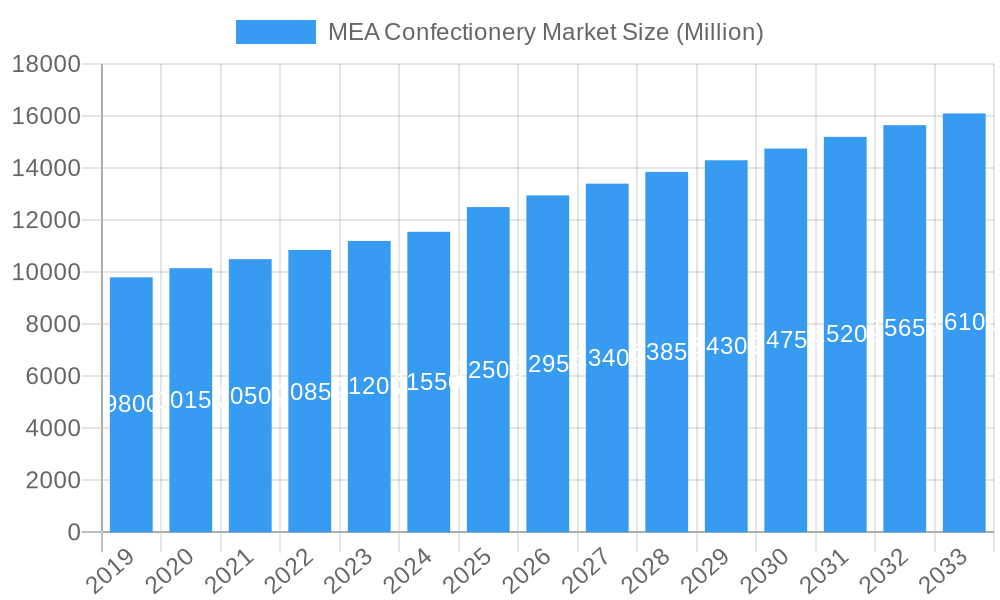
The Middle East & Africa (MEA) confectionery market is poised for robust growth, projected to reach a substantial market size of approximately USD 12,500 million by 2025, exhibiting a Compound Annual Growth Rate (CAGR) of 4.20% from 2019 to 2033. This expansion is primarily fueled by a confluence of evolving consumer preferences, increasing disposable incomes, and a growing demand for premium and indulgence products. Key market drivers include the rising popularity of chocolate-based confectionery, particularly among younger demographics, and the expanding retail infrastructure across the region, with supermarkets, hypermarkets, and online platforms playing increasingly significant roles in product accessibility. Furthermore, the cultural significance of gifting confectionery, especially during festive seasons, continues to underpin market demand.
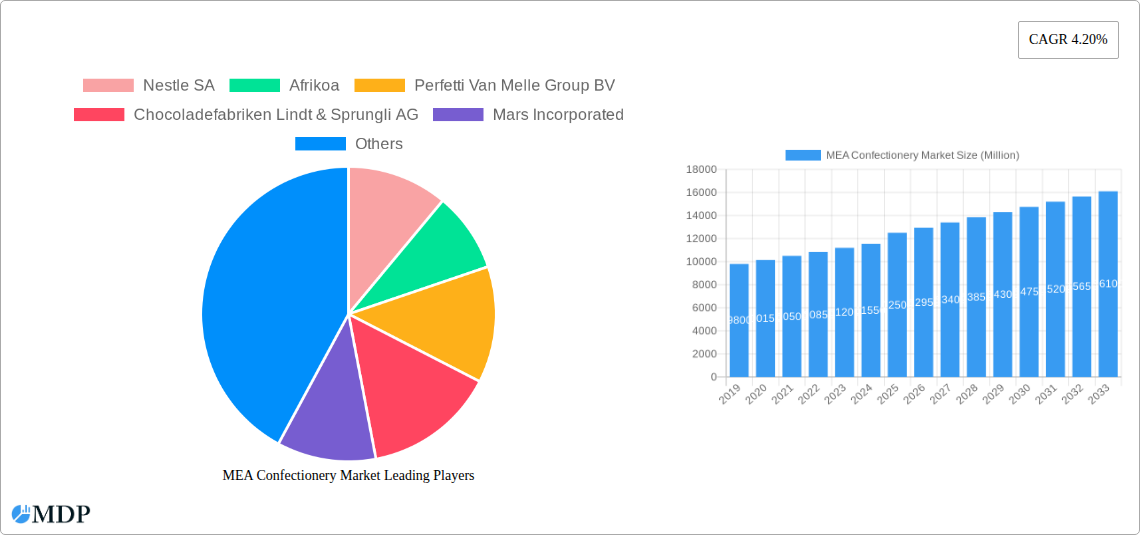
MEA Confectionery Market Market Size (In Billion)
The MEA confectionery landscape is characterized by a diverse product segmentation, with chocolates, sugar confectionery, and snack bars forming the dominant categories. Within chocolates, softlines/selflines, boxed assortments, and countlines are experiencing steady demand. Sugar confectionery, including mints, pastilles, jellies, and toffees, caters to a broad consumer base seeking affordable treats. Snack bars, particularly energy and cereal bars, are gaining traction as consumers prioritize healthier on-the-go options. Key players like Nestle SA, Mars Incorporated, and The Hershey Company are actively investing in product innovation, marketing, and distribution network expansion to capture market share. However, challenges such as fluctuating raw material prices, particularly cocoa and sugar, and increasing competition from local and international brands can temper growth. Despite these restraints, the MEA confectionery market presents significant opportunities, especially in regions like North Africa and the GCC, driven by a young and expanding population with a growing appetite for sweet indulgence.
MEA Confectionery Market Company Market Share
This comprehensive MEA Confectionery Market report offers an in-depth analysis of the evolving landscape, market dynamics, and future trajectory of the confectionery industry across the Middle East and Africa. Covering a study period from 2019 to 2033, with a base year of 2025 and a forecast period of 2025–2033, this report provides actionable insights for stakeholders seeking to capitalize on the burgeoning opportunities in this vibrant region. Discover key trends, dominant segments, leading players, and strategic imperatives to drive success in the MEA confectionery sector.
MEA Confectionery Market Market Dynamics & Concentration
The MEA Confectionery Market is characterized by a dynamic and evolving concentration of players and influencing factors. Innovation remains a pivotal driver, with companies continually investing in product development to cater to diverse consumer preferences and dietary trends. Regulatory frameworks are also gaining prominence, with evolving health and safety standards impacting product formulations and labeling. Product substitutes, such as healthier snack options and functional foods, present a growing challenge, necessitating continuous adaptation by confectionery manufacturers. End-user trends are heavily influenced by rising disposable incomes, urbanization, and a growing demand for premium and indulgence products, particularly in the chocolate segment. Mergers and acquisitions (M&A) activities are expected to play a significant role in shaping market concentration. For instance, the historical period (2019-2024) witnessed approximately 5-10 significant M&A deals, indicating a trend towards consolidation and expansion. Key players like Nestle SA and Mars Incorporated are likely to maintain substantial market shares, estimated to be between 15% and 20% each, while smaller regional players focus on niche segments. The market's competitive intensity is moderate to high, with an increasing focus on localized product offerings and sustainable sourcing practices.
MEA Confectionery Market Industry Trends & Analysis
The MEA Confectionery Market is poised for robust growth, driven by a confluence of economic, social, and technological factors. The Compound Annual Growth Rate (CAGR) is projected to be approximately 6.5% during the forecast period (2025–2033). This expansion is fueled by a burgeoning young population, increasing urbanization, and a rising middle class with greater disposable income, leading to higher per capita consumption of confectionery products. Technological disruptions, particularly in packaging and manufacturing, are enhancing product appeal and shelf-life. The online retail channel is experiencing significant traction, with e-commerce platforms becoming crucial for product distribution and accessibility, contributing to an estimated 15% of total sales by 2025. Consumer preferences are shifting towards healthier options, with a growing demand for sugar-free, low-calorie, and plant-based confectionery. This has spurred innovation in product formulations, incorporating natural sweeteners and functional ingredients. The competitive landscape is intensifying, with both global giants and agile local players vying for market share. Global brands are focusing on localized marketing campaigns and product variants to resonate with regional tastes and cultural nuances. The market penetration of premium confectionery is also on the rise, indicating a growing appetite for high-quality, indulgent treats. For instance, the chocolate segment is expected to grow at a CAGR of approximately 7%, outpacing other confectionery categories due to its perceived premium appeal. The sugar confectionery segment, while mature, continues to attract consumers with its affordability and wide variety of flavors. Snack bars are also witnessing substantial growth, driven by health-conscious consumers seeking convenient and energizing options.
Leading Markets & Segments in MEA Confectionery Market
The MEA Confectionery Market exhibits distinct regional dominance and segment preferences. The GCC (Gulf Cooperation Council) countries, including Saudi Arabia, UAE, and Qatar, are leading markets due to their high per capita income, robust tourism sector, and sophisticated retail infrastructure. Saudi Arabia, in particular, is expected to represent over 25% of the regional market share by 2025.
Dominant Segments:
- Product Type:
- Chocolates: This segment holds the largest market share, driven by a strong consumer preference for indulgence and gifting.
- Boxed Assortments: These are particularly popular during festive seasons and for gifting purposes, contributing significantly to sales in affluent markets.
- Countlines: Single-serve chocolate bars are in high demand for on-the-go consumption.
- Molded Chocolate: This category offers versatility for product innovation and premium offerings.
- Sugar Confectionery: This segment, encompassing a wide array of products, remains a staple due to its affordability and diverse flavor profiles.
- Gums: Chewing gums are popular among younger demographics and as breath fresheners.
- Jellies and Chews: These offer a chewy texture and a wide range of fruity flavors, appealing to a broad consumer base.
- Toffees, Caramels, and Nougat: These offer a richer, more indulgent experience and are popular in specific sub-regions.
- Snack Bars:
- Energy Bars: Driven by the growing health and wellness trend, energy bars are gaining traction for their perceived nutritional benefits.
- Chocolates: This segment holds the largest market share, driven by a strong consumer preference for indulgence and gifting.
- Distribution Channel:
- Supermarkets/Hypermarkets: These remain the dominant distribution channel due to their wide reach and one-stop shopping convenience, accounting for approximately 40% of sales.
- Online Retail Stores: This channel is rapidly expanding, driven by the increasing adoption of e-commerce and convenience-seeking consumers, projected to capture around 15% of the market by 2025.
- Convenience Stores: These cater to impulse purchases and on-the-go consumption, especially in urban areas.
Key drivers of dominance in these segments include economic policies promoting consumer spending, the development of modern retail infrastructure, and effective marketing strategies that cater to local cultural preferences. For instance, the increasing disposable income in North African countries is driving the demand for affordable sugar confectionery, while the GCC nations are witnessing a surge in premium chocolate consumption.
MEA Confectionery Market Product Developments
Product innovation in the MEA Confectionery Market is increasingly focused on catering to evolving consumer demands for healthier, more convenient, and ethically sourced options. Companies are actively developing sugar-free and low-calorie alternatives, utilizing natural sweeteners and functional ingredients like vitamins and proteins. Plant-based and vegan confectionery lines are emerging to address the growing vegan and flexitarian consumer base. Advances in flavor profiles, incorporating exotic fruits and regional spices, are also a key trend. Packaging innovations are enhancing product appeal, shelf-life, and sustainability, with a growing emphasis on recyclable and biodegradable materials. These developments provide competitive advantages by meeting specific market niches and addressing health consciousness, thereby driving consumer adoption and brand loyalty.
Key Drivers of MEA Confectionery Market Growth
The MEA Confectionery Market's growth is propelled by several key factors. Economic upliftment and rising disposable incomes across various MEA nations are significantly boosting consumer spending on discretionary items like confectionery. A young and rapidly growing population base creates a sustained demand for sweet treats. The increasing urbanization and expansion of modern retail formats, including supermarkets and hypermarkets, enhance product accessibility. Furthermore, evolving consumer preferences towards premium, indulgence, and health-conscious options are driving innovation and market expansion. Technological advancements in manufacturing and distribution also contribute to more efficient and wider product availability.
Challenges in the MEA Confectionery Market Market
Despite the growth potential, the MEA Confectionery Market faces several challenges. Fluctuating raw material prices, particularly for cocoa and sugar, can impact profit margins. Regulatory hurdles, including import restrictions and evolving food safety standards in some countries, can create operational complexities. Intense competition from both global and local players necessitates continuous innovation and aggressive pricing strategies. Supply chain disruptions, exacerbated by logistical challenges in certain regions, can affect product availability and distribution efficiency. Furthermore, a growing consumer awareness of health issues associated with high sugar intake poses a significant restraint, pushing for healthier alternatives.
Emerging Opportunities in MEA Confectionery Market
Emerging opportunities in the MEA Confectionery Market lie in leveraging the growing demand for healthier and more sustainable products. The expansion of e-commerce platforms presents a significant avenue for reaching a wider consumer base, particularly in remote areas. Strategic partnerships with local distributors and retailers can unlock untapped regional markets. Investing in product innovation that caters to specific cultural tastes and dietary preferences, such as Halal-certified and sugar-free options, will be crucial. Furthermore, exploring the potential of functional confectionery, incorporating vitamins, minerals, and prebiotics, can tap into the growing health and wellness trend.
Leading Players in the MEA Confectionery Market Sector
- Nestle SA
- Afrikoa
- Perfetti Van Melle Group BV
- Chocoladefabriken Lindt & Sprungli AG
- Mars Incorporated
- Pladis Global
- The Hershey Company
- Mondelez International
Key Milestones in MEA Confectionery Market Industry
- 2019: Increased focus on sustainable sourcing of cocoa and palm oil by major manufacturers.
- 2020: Accelerated growth in online confectionery sales due to the global pandemic.
- 2021: Introduction of several sugar-free and plant-based confectionery options across the region.
- 2022: Expansion of distribution networks into emerging African markets by several multinational corporations.
- 2023: Growing consumer interest in premium and artisan chocolate brands.
- 2024: Increased investment in localized flavor profiles and product variants tailored to specific MEA markets.
Strategic Outlook for MEA Confectionery Market Market
The strategic outlook for the MEA Confectionery Market is optimistic, driven by continued economic development and demographic advantages. Key growth accelerators include a sustained focus on product innovation, particularly in the health and wellness segment, and the expansion of e-commerce capabilities. Companies that can effectively navigate diverse regulatory landscapes and build strong local partnerships will be well-positioned for success. Diversification of product portfolios to include a wider range of sugar-free, plant-based, and functional confectionery will be crucial for capturing market share. Embracing sustainable packaging solutions and transparent sourcing practices will further enhance brand appeal and consumer trust, paving the way for long-term market leadership.
MEA Confectionery Market Segmentation
-
1. Product Type
-
1.1. Chocolates
- 1.1.1. Softlines/Selflines
- 1.1.2. Boxed Assortments
- 1.1.3. Countlines
- 1.1.4. Molded Chocolate
- 1.1.5. Other Chocolates
- 1.2. Gums
-
1.3. Sugar Confectionery
- 1.3.1. Mints
- 1.3.2. Pastilles, Jellies, and Chews
- 1.3.3. Toffees, Caramels, and Nougat
- 1.3.4. Other Sugar Confectioneries
-
1.4. Snack Bars
- 1.4.1. Cereal Bars
- 1.4.2. Energy Bars
-
1.1. Chocolates
-
2. Distribution Channel
- 2.1. Supermarkets/Hypermarkets
- 2.2. Convenience Stores
- 2.3. Online Retail Stores
- 2.4. Other Distribution Channels
MEA Confectionery Market Segmentation By Geography
-
1. North America
- 1.1. United States
- 1.2. Canada
- 1.3. Mexico
-
2. South America
- 2.1. Brazil
- 2.2. Argentina
- 2.3. Rest of South America
-
3. Europe
- 3.1. United Kingdom
- 3.2. Germany
- 3.3. France
- 3.4. Italy
- 3.5. Spain
- 3.6. Russia
- 3.7. Benelux
- 3.8. Nordics
- 3.9. Rest of Europe
-
4. Middle East & Africa
- 4.1. Turkey
- 4.2. Israel
- 4.3. GCC
- 4.4. North Africa
- 4.5. South Africa
- 4.6. Rest of Middle East & Africa
-
5. Asia Pacific
- 5.1. China
- 5.2. India
- 5.3. Japan
- 5.4. South Korea
- 5.5. ASEAN
- 5.6. Oceania
- 5.7. Rest of Asia Pacific
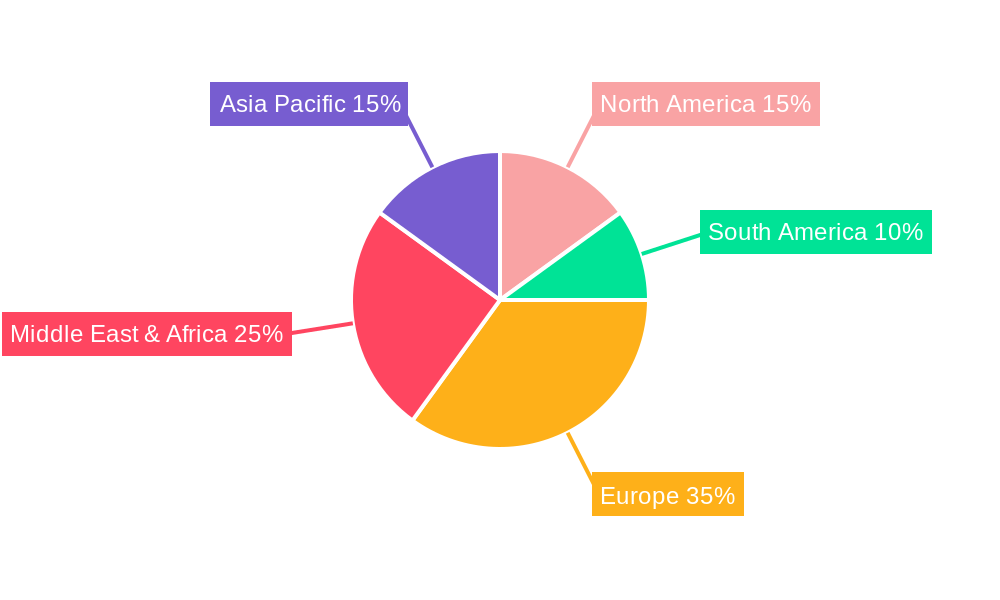
MEA Confectionery Market Regional Market Share
Geographic Coverage of MEA Confectionery Market
MEA Confectionery Market REPORT HIGHLIGHTS
| Aspects | Details |
|---|---|
| Study Period | 2020-2034 |
| Base Year | 2025 |
| Estimated Year | 2026 |
| Forecast Period | 2026-2034 |
| Historical Period | 2020-2025 |
| Growth Rate | CAGR of 6.92% from 2020-2034 |
| Segmentation |
|
Table of Contents
- 1. Introduction
- 1.1. Research Scope
- 1.2. Market Segmentation
- 1.3. Research Methodology
- 1.4. Definitions and Assumptions
- 2. Executive Summary
- 2.1. Introduction
- 3. Market Dynamics
- 3.1. Introduction
- 3.2. Market Drivers
- 3.2.1. Increasing Sports Participation; Increasing Awareness about Health and Fitness
- 3.3. Market Restrains
- 3.3.1. Adverse Effects of Overconsumption of Products
- 3.4. Market Trends
- 3.4.1. INCREASING DEMAND FOR PREMIUM AND ARTISAN CHOCOLATES
- 4. Market Factor Analysis
- 4.1. Porters Five Forces
- 4.2. Supply/Value Chain
- 4.3. PESTEL analysis
- 4.4. Market Entropy
- 4.5. Patent/Trademark Analysis
- 5. Global MEA Confectionery Market Analysis, Insights and Forecast, 2020-2032
- 5.1. Market Analysis, Insights and Forecast - by Product Type
- 5.1.1. Chocolates
- 5.1.1.1. Softlines/Selflines
- 5.1.1.2. Boxed Assortments
- 5.1.1.3. Countlines
- 5.1.1.4. Molded Chocolate
- 5.1.1.5. Other Chocolates
- 5.1.2. Gums
- 5.1.3. Sugar Confectionery
- 5.1.3.1. Mints
- 5.1.3.2. Pastilles, Jellies, and Chews
- 5.1.3.3. Toffees, Caramels, and Nougat
- 5.1.3.4. Other Sugar Confectioneries
- 5.1.4. Snack Bars
- 5.1.4.1. Cereal Bars
- 5.1.4.2. Energy Bars
- 5.1.1. Chocolates
- 5.2. Market Analysis, Insights and Forecast - by Distribution Channel
- 5.2.1. Supermarkets/Hypermarkets
- 5.2.2. Convenience Stores
- 5.2.3. Online Retail Stores
- 5.2.4. Other Distribution Channels
- 5.3. Market Analysis, Insights and Forecast - by Region
- 5.3.1. North America
- 5.3.2. South America
- 5.3.3. Europe
- 5.3.4. Middle East & Africa
- 5.3.5. Asia Pacific
- 5.1. Market Analysis, Insights and Forecast - by Product Type
- 6. North America MEA Confectionery Market Analysis, Insights and Forecast, 2020-2032
- 6.1. Market Analysis, Insights and Forecast - by Product Type
- 6.1.1. Chocolates
- 6.1.1.1. Softlines/Selflines
- 6.1.1.2. Boxed Assortments
- 6.1.1.3. Countlines
- 6.1.1.4. Molded Chocolate
- 6.1.1.5. Other Chocolates
- 6.1.2. Gums
- 6.1.3. Sugar Confectionery
- 6.1.3.1. Mints
- 6.1.3.2. Pastilles, Jellies, and Chews
- 6.1.3.3. Toffees, Caramels, and Nougat
- 6.1.3.4. Other Sugar Confectioneries
- 6.1.4. Snack Bars
- 6.1.4.1. Cereal Bars
- 6.1.4.2. Energy Bars
- 6.1.1. Chocolates
- 6.2. Market Analysis, Insights and Forecast - by Distribution Channel
- 6.2.1. Supermarkets/Hypermarkets
- 6.2.2. Convenience Stores
- 6.2.3. Online Retail Stores
- 6.2.4. Other Distribution Channels
- 6.1. Market Analysis, Insights and Forecast - by Product Type
- 7. South America MEA Confectionery Market Analysis, Insights and Forecast, 2020-2032
- 7.1. Market Analysis, Insights and Forecast - by Product Type
- 7.1.1. Chocolates
- 7.1.1.1. Softlines/Selflines
- 7.1.1.2. Boxed Assortments
- 7.1.1.3. Countlines
- 7.1.1.4. Molded Chocolate
- 7.1.1.5. Other Chocolates
- 7.1.2. Gums
- 7.1.3. Sugar Confectionery
- 7.1.3.1. Mints
- 7.1.3.2. Pastilles, Jellies, and Chews
- 7.1.3.3. Toffees, Caramels, and Nougat
- 7.1.3.4. Other Sugar Confectioneries
- 7.1.4. Snack Bars
- 7.1.4.1. Cereal Bars
- 7.1.4.2. Energy Bars
- 7.1.1. Chocolates
- 7.2. Market Analysis, Insights and Forecast - by Distribution Channel
- 7.2.1. Supermarkets/Hypermarkets
- 7.2.2. Convenience Stores
- 7.2.3. Online Retail Stores
- 7.2.4. Other Distribution Channels
- 7.1. Market Analysis, Insights and Forecast - by Product Type
- 8. Europe MEA Confectionery Market Analysis, Insights and Forecast, 2020-2032
- 8.1. Market Analysis, Insights and Forecast - by Product Type
- 8.1.1. Chocolates
- 8.1.1.1. Softlines/Selflines
- 8.1.1.2. Boxed Assortments
- 8.1.1.3. Countlines
- 8.1.1.4. Molded Chocolate
- 8.1.1.5. Other Chocolates
- 8.1.2. Gums
- 8.1.3. Sugar Confectionery
- 8.1.3.1. Mints
- 8.1.3.2. Pastilles, Jellies, and Chews
- 8.1.3.3. Toffees, Caramels, and Nougat
- 8.1.3.4. Other Sugar Confectioneries
- 8.1.4. Snack Bars
- 8.1.4.1. Cereal Bars
- 8.1.4.2. Energy Bars
- 8.1.1. Chocolates
- 8.2. Market Analysis, Insights and Forecast - by Distribution Channel
- 8.2.1. Supermarkets/Hypermarkets
- 8.2.2. Convenience Stores
- 8.2.3. Online Retail Stores
- 8.2.4. Other Distribution Channels
- 8.1. Market Analysis, Insights and Forecast - by Product Type
- 9. Middle East & Africa MEA Confectionery Market Analysis, Insights and Forecast, 2020-2032
- 9.1. Market Analysis, Insights and Forecast - by Product Type
- 9.1.1. Chocolates
- 9.1.1.1. Softlines/Selflines
- 9.1.1.2. Boxed Assortments
- 9.1.1.3. Countlines
- 9.1.1.4. Molded Chocolate
- 9.1.1.5. Other Chocolates
- 9.1.2. Gums
- 9.1.3. Sugar Confectionery
- 9.1.3.1. Mints
- 9.1.3.2. Pastilles, Jellies, and Chews
- 9.1.3.3. Toffees, Caramels, and Nougat
- 9.1.3.4. Other Sugar Confectioneries
- 9.1.4. Snack Bars
- 9.1.4.1. Cereal Bars
- 9.1.4.2. Energy Bars
- 9.1.1. Chocolates
- 9.2. Market Analysis, Insights and Forecast - by Distribution Channel
- 9.2.1. Supermarkets/Hypermarkets
- 9.2.2. Convenience Stores
- 9.2.3. Online Retail Stores
- 9.2.4. Other Distribution Channels
- 9.1. Market Analysis, Insights and Forecast - by Product Type
- 10. Asia Pacific MEA Confectionery Market Analysis, Insights and Forecast, 2020-2032
- 10.1. Market Analysis, Insights and Forecast - by Product Type
- 10.1.1. Chocolates
- 10.1.1.1. Softlines/Selflines
- 10.1.1.2. Boxed Assortments
- 10.1.1.3. Countlines
- 10.1.1.4. Molded Chocolate
- 10.1.1.5. Other Chocolates
- 10.1.2. Gums
- 10.1.3. Sugar Confectionery
- 10.1.3.1. Mints
- 10.1.3.2. Pastilles, Jellies, and Chews
- 10.1.3.3. Toffees, Caramels, and Nougat
- 10.1.3.4. Other Sugar Confectioneries
- 10.1.4. Snack Bars
- 10.1.4.1. Cereal Bars
- 10.1.4.2. Energy Bars
- 10.1.1. Chocolates
- 10.2. Market Analysis, Insights and Forecast - by Distribution Channel
- 10.2.1. Supermarkets/Hypermarkets
- 10.2.2. Convenience Stores
- 10.2.3. Online Retail Stores
- 10.2.4. Other Distribution Channels
- 10.1. Market Analysis, Insights and Forecast - by Product Type
- 11. Competitive Analysis
- 11.1. Global Market Share Analysis 2025
- 11.2. Company Profiles
- 11.2.1 Nestle SA
- 11.2.1.1. Overview
- 11.2.1.2. Products
- 11.2.1.3. SWOT Analysis
- 11.2.1.4. Recent Developments
- 11.2.1.5. Financials (Based on Availability)
- 11.2.2 Afrikoa
- 11.2.2.1. Overview
- 11.2.2.2. Products
- 11.2.2.3. SWOT Analysis
- 11.2.2.4. Recent Developments
- 11.2.2.5. Financials (Based on Availability)
- 11.2.3 Perfetti Van Melle Group BV
- 11.2.3.1. Overview
- 11.2.3.2. Products
- 11.2.3.3. SWOT Analysis
- 11.2.3.4. Recent Developments
- 11.2.3.5. Financials (Based on Availability)
- 11.2.4 Chocoladefabriken Lindt & Sprungli AG
- 11.2.4.1. Overview
- 11.2.4.2. Products
- 11.2.4.3. SWOT Analysis
- 11.2.4.4. Recent Developments
- 11.2.4.5. Financials (Based on Availability)
- 11.2.5 Mars Incorporated
- 11.2.5.1. Overview
- 11.2.5.2. Products
- 11.2.5.3. SWOT Analysis
- 11.2.5.4. Recent Developments
- 11.2.5.5. Financials (Based on Availability)
- 11.2.6 Pladis Global
- 11.2.6.1. Overview
- 11.2.6.2. Products
- 11.2.6.3. SWOT Analysis
- 11.2.6.4. Recent Developments
- 11.2.6.5. Financials (Based on Availability)
- 11.2.7 The Hershey Company
- 11.2.7.1. Overview
- 11.2.7.2. Products
- 11.2.7.3. SWOT Analysis
- 11.2.7.4. Recent Developments
- 11.2.7.5. Financials (Based on Availability)
- 11.2.8 Mondelez International
- 11.2.8.1. Overview
- 11.2.8.2. Products
- 11.2.8.3. SWOT Analysis
- 11.2.8.4. Recent Developments
- 11.2.8.5. Financials (Based on Availability)
- 11.2.1 Nestle SA
List of Figures
- Figure 1: Global MEA Confectionery Market Revenue Breakdown (undefined, %) by Region 2025 & 2033
- Figure 2: North America MEA Confectionery Market Revenue (undefined), by Product Type 2025 & 2033
- Figure 3: North America MEA Confectionery Market Revenue Share (%), by Product Type 2025 & 2033
- Figure 4: North America MEA Confectionery Market Revenue (undefined), by Distribution Channel 2025 & 2033
- Figure 5: North America MEA Confectionery Market Revenue Share (%), by Distribution Channel 2025 & 2033
- Figure 6: North America MEA Confectionery Market Revenue (undefined), by Country 2025 & 2033
- Figure 7: North America MEA Confectionery Market Revenue Share (%), by Country 2025 & 2033
- Figure 8: South America MEA Confectionery Market Revenue (undefined), by Product Type 2025 & 2033
- Figure 9: South America MEA Confectionery Market Revenue Share (%), by Product Type 2025 & 2033
- Figure 10: South America MEA Confectionery Market Revenue (undefined), by Distribution Channel 2025 & 2033
- Figure 11: South America MEA Confectionery Market Revenue Share (%), by Distribution Channel 2025 & 2033
- Figure 12: South America MEA Confectionery Market Revenue (undefined), by Country 2025 & 2033
- Figure 13: South America MEA Confectionery Market Revenue Share (%), by Country 2025 & 2033
- Figure 14: Europe MEA Confectionery Market Revenue (undefined), by Product Type 2025 & 2033
- Figure 15: Europe MEA Confectionery Market Revenue Share (%), by Product Type 2025 & 2033
- Figure 16: Europe MEA Confectionery Market Revenue (undefined), by Distribution Channel 2025 & 2033
- Figure 17: Europe MEA Confectionery Market Revenue Share (%), by Distribution Channel 2025 & 2033
- Figure 18: Europe MEA Confectionery Market Revenue (undefined), by Country 2025 & 2033
- Figure 19: Europe MEA Confectionery Market Revenue Share (%), by Country 2025 & 2033
- Figure 20: Middle East & Africa MEA Confectionery Market Revenue (undefined), by Product Type 2025 & 2033
- Figure 21: Middle East & Africa MEA Confectionery Market Revenue Share (%), by Product Type 2025 & 2033
- Figure 22: Middle East & Africa MEA Confectionery Market Revenue (undefined), by Distribution Channel 2025 & 2033
- Figure 23: Middle East & Africa MEA Confectionery Market Revenue Share (%), by Distribution Channel 2025 & 2033
- Figure 24: Middle East & Africa MEA Confectionery Market Revenue (undefined), by Country 2025 & 2033
- Figure 25: Middle East & Africa MEA Confectionery Market Revenue Share (%), by Country 2025 & 2033
- Figure 26: Asia Pacific MEA Confectionery Market Revenue (undefined), by Product Type 2025 & 2033
- Figure 27: Asia Pacific MEA Confectionery Market Revenue Share (%), by Product Type 2025 & 2033
- Figure 28: Asia Pacific MEA Confectionery Market Revenue (undefined), by Distribution Channel 2025 & 2033
- Figure 29: Asia Pacific MEA Confectionery Market Revenue Share (%), by Distribution Channel 2025 & 2033
- Figure 30: Asia Pacific MEA Confectionery Market Revenue (undefined), by Country 2025 & 2033
- Figure 31: Asia Pacific MEA Confectionery Market Revenue Share (%), by Country 2025 & 2033
List of Tables
- Table 1: Global MEA Confectionery Market Revenue undefined Forecast, by Product Type 2020 & 2033
- Table 2: Global MEA Confectionery Market Revenue undefined Forecast, by Distribution Channel 2020 & 2033
- Table 3: Global MEA Confectionery Market Revenue undefined Forecast, by Region 2020 & 2033
- Table 4: Global MEA Confectionery Market Revenue undefined Forecast, by Product Type 2020 & 2033
- Table 5: Global MEA Confectionery Market Revenue undefined Forecast, by Distribution Channel 2020 & 2033
- Table 6: Global MEA Confectionery Market Revenue undefined Forecast, by Country 2020 & 2033
- Table 7: United States MEA Confectionery Market Revenue (undefined) Forecast, by Application 2020 & 2033
- Table 8: Canada MEA Confectionery Market Revenue (undefined) Forecast, by Application 2020 & 2033
- Table 9: Mexico MEA Confectionery Market Revenue (undefined) Forecast, by Application 2020 & 2033
- Table 10: Global MEA Confectionery Market Revenue undefined Forecast, by Product Type 2020 & 2033
- Table 11: Global MEA Confectionery Market Revenue undefined Forecast, by Distribution Channel 2020 & 2033
- Table 12: Global MEA Confectionery Market Revenue undefined Forecast, by Country 2020 & 2033
- Table 13: Brazil MEA Confectionery Market Revenue (undefined) Forecast, by Application 2020 & 2033
- Table 14: Argentina MEA Confectionery Market Revenue (undefined) Forecast, by Application 2020 & 2033
- Table 15: Rest of South America MEA Confectionery Market Revenue (undefined) Forecast, by Application 2020 & 2033
- Table 16: Global MEA Confectionery Market Revenue undefined Forecast, by Product Type 2020 & 2033
- Table 17: Global MEA Confectionery Market Revenue undefined Forecast, by Distribution Channel 2020 & 2033
- Table 18: Global MEA Confectionery Market Revenue undefined Forecast, by Country 2020 & 2033
- Table 19: United Kingdom MEA Confectionery Market Revenue (undefined) Forecast, by Application 2020 & 2033
- Table 20: Germany MEA Confectionery Market Revenue (undefined) Forecast, by Application 2020 & 2033
- Table 21: France MEA Confectionery Market Revenue (undefined) Forecast, by Application 2020 & 2033
- Table 22: Italy MEA Confectionery Market Revenue (undefined) Forecast, by Application 2020 & 2033
- Table 23: Spain MEA Confectionery Market Revenue (undefined) Forecast, by Application 2020 & 2033
- Table 24: Russia MEA Confectionery Market Revenue (undefined) Forecast, by Application 2020 & 2033
- Table 25: Benelux MEA Confectionery Market Revenue (undefined) Forecast, by Application 2020 & 2033
- Table 26: Nordics MEA Confectionery Market Revenue (undefined) Forecast, by Application 2020 & 2033
- Table 27: Rest of Europe MEA Confectionery Market Revenue (undefined) Forecast, by Application 2020 & 2033
- Table 28: Global MEA Confectionery Market Revenue undefined Forecast, by Product Type 2020 & 2033
- Table 29: Global MEA Confectionery Market Revenue undefined Forecast, by Distribution Channel 2020 & 2033
- Table 30: Global MEA Confectionery Market Revenue undefined Forecast, by Country 2020 & 2033
- Table 31: Turkey MEA Confectionery Market Revenue (undefined) Forecast, by Application 2020 & 2033
- Table 32: Israel MEA Confectionery Market Revenue (undefined) Forecast, by Application 2020 & 2033
- Table 33: GCC MEA Confectionery Market Revenue (undefined) Forecast, by Application 2020 & 2033
- Table 34: North Africa MEA Confectionery Market Revenue (undefined) Forecast, by Application 2020 & 2033
- Table 35: South Africa MEA Confectionery Market Revenue (undefined) Forecast, by Application 2020 & 2033
- Table 36: Rest of Middle East & Africa MEA Confectionery Market Revenue (undefined) Forecast, by Application 2020 & 2033
- Table 37: Global MEA Confectionery Market Revenue undefined Forecast, by Product Type 2020 & 2033
- Table 38: Global MEA Confectionery Market Revenue undefined Forecast, by Distribution Channel 2020 & 2033
- Table 39: Global MEA Confectionery Market Revenue undefined Forecast, by Country 2020 & 2033
- Table 40: China MEA Confectionery Market Revenue (undefined) Forecast, by Application 2020 & 2033
- Table 41: India MEA Confectionery Market Revenue (undefined) Forecast, by Application 2020 & 2033
- Table 42: Japan MEA Confectionery Market Revenue (undefined) Forecast, by Application 2020 & 2033
- Table 43: South Korea MEA Confectionery Market Revenue (undefined) Forecast, by Application 2020 & 2033
- Table 44: ASEAN MEA Confectionery Market Revenue (undefined) Forecast, by Application 2020 & 2033
- Table 45: Oceania MEA Confectionery Market Revenue (undefined) Forecast, by Application 2020 & 2033
- Table 46: Rest of Asia Pacific MEA Confectionery Market Revenue (undefined) Forecast, by Application 2020 & 2033
Frequently Asked Questions
1. What is the projected Compound Annual Growth Rate (CAGR) of the MEA Confectionery Market?
The projected CAGR is approximately 6.92%.
2. Which companies are prominent players in the MEA Confectionery Market?
Key companies in the market include Nestle SA, Afrikoa, Perfetti Van Melle Group BV, Chocoladefabriken Lindt & Sprungli AG, Mars Incorporated, Pladis Global, The Hershey Company, Mondelez International.
3. What are the main segments of the MEA Confectionery Market?
The market segments include Product Type, Distribution Channel.
4. Can you provide details about the market size?
The market size is estimated to be USD XXX N/A as of 2022.
5. What are some drivers contributing to market growth?
Increasing Sports Participation; Increasing Awareness about Health and Fitness.
6. What are the notable trends driving market growth?
INCREASING DEMAND FOR PREMIUM AND ARTISAN CHOCOLATES.
7. Are there any restraints impacting market growth?
Adverse Effects of Overconsumption of Products.
8. Can you provide examples of recent developments in the market?
N/A
9. What pricing options are available for accessing the report?
Pricing options include single-user, multi-user, and enterprise licenses priced at USD 4750, USD 5250, and USD 8750 respectively.
10. Is the market size provided in terms of value or volume?
The market size is provided in terms of value, measured in N/A.
11. Are there any specific market keywords associated with the report?
Yes, the market keyword associated with the report is "MEA Confectionery Market," which aids in identifying and referencing the specific market segment covered.
12. How do I determine which pricing option suits my needs best?
The pricing options vary based on user requirements and access needs. Individual users may opt for single-user licenses, while businesses requiring broader access may choose multi-user or enterprise licenses for cost-effective access to the report.
13. Are there any additional resources or data provided in the MEA Confectionery Market report?
While the report offers comprehensive insights, it's advisable to review the specific contents or supplementary materials provided to ascertain if additional resources or data are available.
14. How can I stay updated on further developments or reports in the MEA Confectionery Market?
To stay informed about further developments, trends, and reports in the MEA Confectionery Market, consider subscribing to industry newsletters, following relevant companies and organizations, or regularly checking reputable industry news sources and publications.
Methodology
Step 1 - Identification of Relevant Samples Size from Population Database


Step 2 - Approaches for Defining Global Market Size (Value, Volume* & Price*)

Note*: In applicable scenarios
Step 3 - Data Sources
Primary Research
- Web Analytics
- Survey Reports
- Research Institute
- Latest Research Reports
- Opinion Leaders
Secondary Research
- Annual Reports
- White Paper
- Latest Press Release
- Industry Association
- Paid Database
- Investor Presentations

Step 4 - Data Triangulation
Involves using different sources of information in order to increase the validity of a study
These sources are likely to be stakeholders in a program - participants, other researchers, program staff, other community members, and so on.
Then we put all data in single framework & apply various statistical tools to find out the dynamic on the market.
During the analysis stage, feedback from the stakeholder groups would be compared to determine areas of agreement as well as areas of divergence