

Key Insights
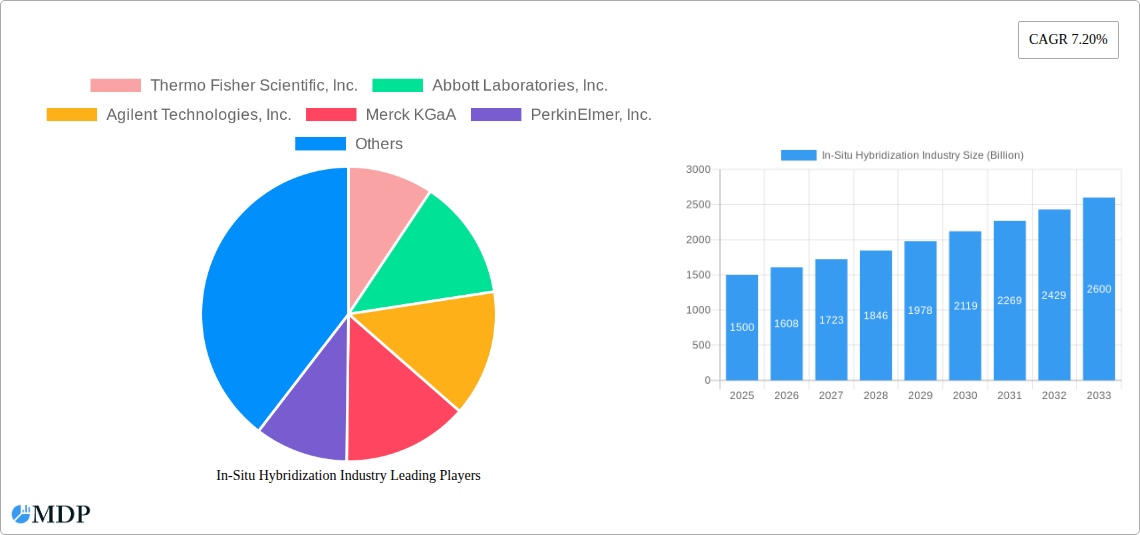
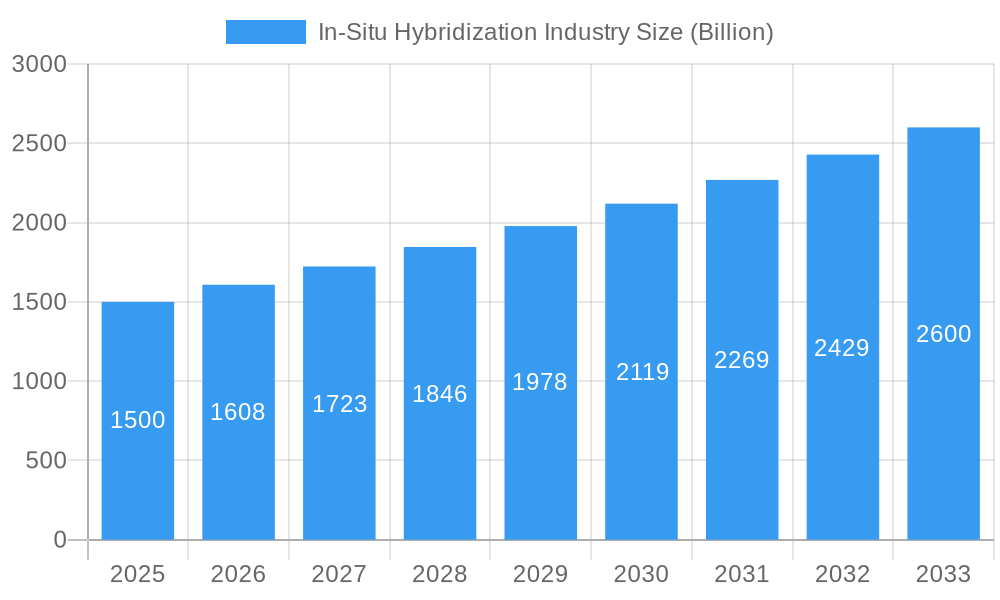
The In-Situ Hybridization (ISH) market, valued at $1.5 billion in 2025, is projected to experience robust growth, driven by a Compound Annual Growth Rate (CAGR) of 7.20% from 2025 to 2033. This expansion is fueled by several key factors. The increasing prevalence of cancer and infectious diseases globally necessitates advanced diagnostic tools, significantly boosting the demand for ISH techniques like Fluorescence In Situ Hybridization (FISH) and Chromogenic In Situ Hybridization (CISH). Furthermore, technological advancements leading to improved sensitivity, specificity, and automation of ISH assays are accelerating market adoption. The rising adoption of personalized medicine and the growing need for accurate and rapid diagnostic solutions in clinical settings are also contributing to market growth. Significant investment in research and development by key players like Thermo Fisher Scientific, Abbott Laboratories, and Agilent Technologies is further propelling innovation and expanding market opportunities. The diverse application segments—cancer diagnostics being the largest—along with the growing involvement of contract research organizations (CROs) further contribute to the overall market expansion.
In-Situ Hybridization Industry Market Size (In Billion)
Growth within the ISH market is expected to be geographically diverse, with North America and Europe maintaining significant market shares due to established healthcare infrastructure and high adoption rates of advanced diagnostic technologies. However, the Asia-Pacific region is anticipated to witness the fastest growth due to increasing healthcare expenditure, rising awareness of diagnostic procedures, and a growing number of research and diagnostic laboratories. Despite these positive factors, the market may face some challenges, such as stringent regulatory approvals for new ISH products and the high cost associated with these advanced techniques, potentially limiting accessibility in certain regions. Nevertheless, the overall outlook for the ISH market remains positive, with substantial potential for continued growth over the forecast period driven by technological innovation and increasing global healthcare demands.
In-Situ Hybridization Industry Company Market Share
In-Situ Hybridization (ISH) Market Report: A Billion-Dollar Analysis (2019-2033)
This comprehensive report provides an in-depth analysis of the In-Situ Hybridization (ISH) industry, projecting a market value exceeding $XX Billion by 2033. It covers market dynamics, leading players, technological advancements, and future growth opportunities, offering actionable insights for stakeholders across the value chain. This report is crucial for companies involved in FISH, CISH, and related technologies, diagnostics, research, and the broader healthcare sector. The study period is 2019-2033, with 2025 as the base and estimated year.
In-Situ Hybridization Industry Market Dynamics & Concentration
The In-Situ Hybridization market, valued at $XX Billion in 2025, exhibits a moderately consolidated structure. Key players, including Thermo Fisher Scientific, Inc., Abbott Laboratories, Inc., Agilent Technologies, Inc., Merck KGaA, PerkinElmer, Inc., Bio-Rad Laboratories, Inc., F. Hoffmann-La Roche Ltd, Danaher Corporation, Abnova Corporation, and BioGenex Laboratories, hold significant market share, with Thermo Fisher and Abbott potentially leading with a combined share of approximately 35%. However, the market also features several smaller players, contributing to a dynamic competitive landscape.
Innovation is a key driver, with ongoing advancements in instrumentation, reagent development, and software solutions driving market growth. Stringent regulatory frameworks, particularly in healthcare, influence market access and product development. The market faces competition from alternative diagnostic techniques, but ISH's advantages in spatial resolution and cellular context maintain its relevance. End-user trends, particularly the increasing adoption of ISH in personalized medicine and cancer diagnostics, propel market expansion. M&A activity in the sector has been relatively moderate over the past five years, with approximately xx deals recorded, mainly focused on enhancing technology portfolios and expanding market reach.
In-Situ Hybridization Industry Industry Trends & Analysis
The global In-Situ Hybridization market is experiencing robust growth, projected to achieve a CAGR of xx% during the forecast period (2025-2033). This growth is primarily fueled by the rising prevalence of chronic diseases, particularly cancer, and the increasing demand for precise diagnostic tools. Technological advancements, including the development of high-throughput platforms and automated systems, further contribute to market expansion. The market penetration of ISH in various applications is gradually increasing. Fluorescent ISH (FISH) remains dominant, owing to its superior sensitivity and versatility, while chromogenic ISH (CISH) is witnessing growth due to its simplicity and cost-effectiveness. The adoption of advanced data analysis software is also increasing, enhancing the diagnostic capabilities and overall efficiency of ISH techniques. Consumer preferences are shifting towards higher throughput, faster turnaround times and user-friendly systems, driving further innovation. The competitive dynamics are characterized by both fierce competition among established players and the emergence of new players with innovative technologies.
Leading Markets & Segments in In-Situ Hybridization Industry
The North American market holds the largest share of the In-Situ Hybridization market, driven by robust healthcare infrastructure, high research expenditure, and early adoption of advanced technologies. Within the segments:
- Product: Kits and Reagents constitute the largest segment due to higher demand and recurring nature of consumables. Analytical instruments and software & services follow.
- Technique: Fluorescence In Situ Hybridization (FISH) dominates due to its high sensitivity and versatility.
- Application: Cancer diagnostics represents the largest application area for ISH, owing to its role in tumor characterization and prognosis.
- End User: Diagnostics laboratories and academic & research institutions contribute the majority of market revenue.
Key Drivers:
- North America: High healthcare expenditure, robust research infrastructure, stringent regulatory environment.
- Europe: Growing focus on personalized medicine, increasing prevalence of chronic diseases.
- Asia Pacific: Rising healthcare expenditure, increasing awareness regarding advanced diagnostics.
In-Situ Hybridization Industry Product Developments
Recent product innovations have centered on improving assay speed, sensitivity, and multiplexing capabilities. The launch of high-speed in-situ hybridization staining platforms and co-detection kits capable of simultaneously analyzing RNA and proteins exemplify these trends. These innovations improve workflow efficiency and provide richer diagnostic data, enhancing the market appeal and broadening ISH’s applications in research and diagnostics. This, coupled with the integration of advanced image analysis software, enhances the overall efficiency and accuracy of the process, making it more attractive to various stakeholders.
Key Drivers of In-Situ Hybridization Industry Growth
The In-Situ Hybridization market's growth is propelled by several factors: the increasing prevalence of cancer and infectious diseases necessitating accurate diagnostics; advancements in ISH technology leading to improved sensitivity, specificity, and throughput; increasing research activities across various fields, and government support for research and development. Furthermore, the rising adoption of personalized medicine and the growing demand for point-of-care diagnostics are significantly contributing to market expansion.
Challenges in the In-Situ Hybridization Industry Market
The market faces challenges such as high costs associated with ISH assays and equipment, the need for specialized personnel for operation and data analysis, and the potential for inconsistencies in results between different laboratories. Moreover, stringent regulatory requirements for diagnostic applications and potential supply chain disruptions related to reagents and consumables pose additional hurdles, potentially impacting market growth by xx%.
Emerging Opportunities in In-Situ Hybridization Industry
The future of the ISH market appears promising. Emerging opportunities include the development of novel ISH-based assays for emerging infectious diseases, the integration of ISH with other advanced technologies (e.g., next-generation sequencing), and the expansion of ISH applications into new therapeutic areas. Strategic partnerships between technology providers and diagnostic companies are also expected to contribute significantly to future market growth.
Leading Players in the In-Situ Hybridization Industry Sector
- Thermo Fisher Scientific, Inc.
- Abbott Laboratories, Inc.
- Agilent Technologies, Inc.
- Merck KGaA
- PerkinElmer, Inc.
- Bio-Rad Laboratories, Inc.
- F. Hoffmann-La Roche Ltd
- Danaher Corporation
- Abnova Corporation
- BioGenex Laboratories
Key Milestones in In-Situ Hybridization Industry Industry
- September 2022: Vizgen launched Merscope Protein co-detection kits, enhancing spatial multi-omics analysis. This significantly broadened the capabilities of MERFISH, enabling more comprehensive research.
- May 2022: Leica Biosystems launched a high-speed in situ hybridization staining platform, improving workflow efficiency and accessibility. This increased throughput and streamlined the process within diagnostic laboratories.
Strategic Outlook for In-Situ Hybridization Industry Market
The In-Situ Hybridization market is poised for continued growth, driven by technological innovations, expanding applications, and the increasing prevalence of diseases requiring precise diagnostics. Strategic investments in R&D, collaborations, and expansion into emerging markets will be key for companies to capitalize on future opportunities. The market is predicted to reach $XX Billion by 2033, presenting significant potential for industry players.
In-Situ Hybridization Industry Segmentation
-
1. Product
- 1.1. Analytical Instruments
- 1.2. Kits and Reagents
- 1.3. Software and Services
- 1.4. Other Products
-
2. Technique
- 2.1. Fluoresence In Situ Hybridization (FISH)
- 2.2. Chromogenic In Situ hybridization (CISH)
-
3. Application
- 3.1. Cancer
- 3.2. Infectious Diseases
- 3.3. Others
-
4. End User
- 4.1. Diagnostics Laboratories
- 4.2. Academic and Research Institutions
- 4.3. Contract Research Organizations (CROs)
In-Situ Hybridization Industry Segmentation By Geography
-
1. North America
- 1.1. United States
- 1.2. Canada
- 1.3. Mexico
-
2. Europe
- 2.1. Germany
- 2.2. United Kingdom
- 2.3. France
- 2.4. Italy
- 2.5. Spain
- 2.6. Rest of Europe
-
3. Asia Pacific
- 3.1. China
- 3.2. Japan
- 3.3. India
- 3.4. Australia
- 3.5. South Korea
- 3.6. Rest of Asia Pacific
-
4. Middle East and Africa
- 4.1. GCC
- 4.2. South Africa
- 4.3. Rest of Middle East and Africa
-
5. South America
- 5.1. Brazil
- 5.2. Argentina
- 5.3. Rest of South America
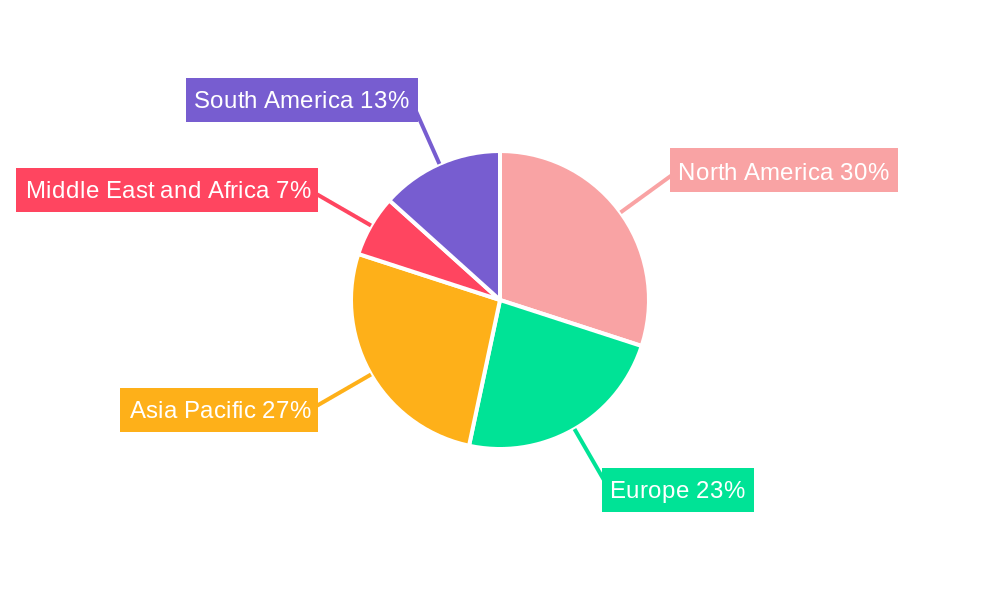
In-Situ Hybridization Industry Regional Market Share
Geographic Coverage of In-Situ Hybridization Industry
In-Situ Hybridization Industry REPORT HIGHLIGHTS
| Aspects | Details |
|---|---|
| Study Period | 2020-2034 |
| Base Year | 2025 |
| Estimated Year | 2026 |
| Forecast Period | 2026-2034 |
| Historical Period | 2020-2025 |
| Growth Rate | CAGR of 7.20% from 2020-2034 |
| Segmentation |
|
Table of Contents
- 1. Introduction
- 1.1. Research Scope
- 1.2. Market Segmentation
- 1.3. Research Objective
- 1.4. Definitions and Assumptions
- 2. Executive Summary
- 2.1. Market Snapshot
- 3. Market Dynamics
- 3.1. Market Drivers
- 3.2. Market Restrains
- 3.3. Market Trends
- 3.4. Market Opportunities
- 4. Market Factor Analysis
- 4.1. Porters Five Forces
- 4.1.1. Bargaining Power of Suppliers
- 4.1.2. Bargaining Power of Buyers
- 4.1.3. Threat of New Entrants
- 4.1.4. Threat of Substitutes
- 4.1.5. Competitive Rivalry
- 4.2. PESTEL analysis
- 4.3. BCG Analysis
- 4.3.1. Stars (High Growth, High Market Share)
- 4.3.2. Cash Cows (Low Growth, High Market Share)
- 4.3.3. Question Mark (High Growth, Low Market Share)
- 4.3.4. Dogs (Low Growth, Low Market Share)
- 4.4. Ansoff Matrix Analysis
- 4.5. Supply Chain Analysis
- 4.6. Regulatory Landscape
- 4.7. Current Market Potential and Opportunity Assessment (TAM–SAM–SOM Framework)
- 4.8. MDP Analyst Note
- 4.1. Porters Five Forces
- 5. Market Analysis, Insights and Forecast 2021-2033
- 5.1. Market Analysis, Insights and Forecast - by Product
- 5.1.1. Analytical Instruments
- 5.1.2. Kits and Reagents
- 5.1.3. Software and Services
- 5.1.4. Other Products
- 5.2. Market Analysis, Insights and Forecast - by Technique
- 5.2.1. Fluoresence In Situ Hybridization (FISH)
- 5.2.2. Chromogenic In Situ hybridization (CISH)
- 5.3. Market Analysis, Insights and Forecast - by Application
- 5.3.1. Cancer
- 5.3.2. Infectious Diseases
- 5.3.3. Others
- 5.4. Market Analysis, Insights and Forecast - by End User
- 5.4.1. Diagnostics Laboratories
- 5.4.2. Academic and Research Institutions
- 5.4.3. Contract Research Organizations (CROs)
- 5.5. Market Analysis, Insights and Forecast - by Region
- 5.5.1. North America
- 5.5.2. Europe
- 5.5.3. Asia Pacific
- 5.5.4. Middle East and Africa
- 5.5.5. South America
- 5.1. Market Analysis, Insights and Forecast - by Product
- 6. Global In-Situ Hybridization Industry Analysis, Insights and Forecast, 2021-2033
- 6.1. Market Analysis, Insights and Forecast - by Product
- 6.1.1. Analytical Instruments
- 6.1.2. Kits and Reagents
- 6.1.3. Software and Services
- 6.1.4. Other Products
- 6.2. Market Analysis, Insights and Forecast - by Technique
- 6.2.1. Fluoresence In Situ Hybridization (FISH)
- 6.2.2. Chromogenic In Situ hybridization (CISH)
- 6.3. Market Analysis, Insights and Forecast - by Application
- 6.3.1. Cancer
- 6.3.2. Infectious Diseases
- 6.3.3. Others
- 6.4. Market Analysis, Insights and Forecast - by End User
- 6.4.1. Diagnostics Laboratories
- 6.4.2. Academic and Research Institutions
- 6.4.3. Contract Research Organizations (CROs)
- 6.1. Market Analysis, Insights and Forecast - by Product
- 7. North America In-Situ Hybridization Industry Analysis, Insights and Forecast, 2020-2032
- 7.1. Market Analysis, Insights and Forecast - by Product
- 7.1.1. Analytical Instruments
- 7.1.2. Kits and Reagents
- 7.1.3. Software and Services
- 7.1.4. Other Products
- 7.2. Market Analysis, Insights and Forecast - by Technique
- 7.2.1. Fluoresence In Situ Hybridization (FISH)
- 7.2.2. Chromogenic In Situ hybridization (CISH)
- 7.3. Market Analysis, Insights and Forecast - by Application
- 7.3.1. Cancer
- 7.3.2. Infectious Diseases
- 7.3.3. Others
- 7.4. Market Analysis, Insights and Forecast - by End User
- 7.4.1. Diagnostics Laboratories
- 7.4.2. Academic and Research Institutions
- 7.4.3. Contract Research Organizations (CROs)
- 7.1. Market Analysis, Insights and Forecast - by Product
- 8. Europe In-Situ Hybridization Industry Analysis, Insights and Forecast, 2020-2032
- 8.1. Market Analysis, Insights and Forecast - by Product
- 8.1.1. Analytical Instruments
- 8.1.2. Kits and Reagents
- 8.1.3. Software and Services
- 8.1.4. Other Products
- 8.2. Market Analysis, Insights and Forecast - by Technique
- 8.2.1. Fluoresence In Situ Hybridization (FISH)
- 8.2.2. Chromogenic In Situ hybridization (CISH)
- 8.3. Market Analysis, Insights and Forecast - by Application
- 8.3.1. Cancer
- 8.3.2. Infectious Diseases
- 8.3.3. Others
- 8.4. Market Analysis, Insights and Forecast - by End User
- 8.4.1. Diagnostics Laboratories
- 8.4.2. Academic and Research Institutions
- 8.4.3. Contract Research Organizations (CROs)
- 8.1. Market Analysis, Insights and Forecast - by Product
- 9. Asia Pacific In-Situ Hybridization Industry Analysis, Insights and Forecast, 2020-2032
- 9.1. Market Analysis, Insights and Forecast - by Product
- 9.1.1. Analytical Instruments
- 9.1.2. Kits and Reagents
- 9.1.3. Software and Services
- 9.1.4. Other Products
- 9.2. Market Analysis, Insights and Forecast - by Technique
- 9.2.1. Fluoresence In Situ Hybridization (FISH)
- 9.2.2. Chromogenic In Situ hybridization (CISH)
- 9.3. Market Analysis, Insights and Forecast - by Application
- 9.3.1. Cancer
- 9.3.2. Infectious Diseases
- 9.3.3. Others
- 9.4. Market Analysis, Insights and Forecast - by End User
- 9.4.1. Diagnostics Laboratories
- 9.4.2. Academic and Research Institutions
- 9.4.3. Contract Research Organizations (CROs)
- 9.1. Market Analysis, Insights and Forecast - by Product
- 10. Middle East and Africa In-Situ Hybridization Industry Analysis, Insights and Forecast, 2020-2032
- 10.1. Market Analysis, Insights and Forecast - by Product
- 10.1.1. Analytical Instruments
- 10.1.2. Kits and Reagents
- 10.1.3. Software and Services
- 10.1.4. Other Products
- 10.2. Market Analysis, Insights and Forecast - by Technique
- 10.2.1. Fluoresence In Situ Hybridization (FISH)
- 10.2.2. Chromogenic In Situ hybridization (CISH)
- 10.3. Market Analysis, Insights and Forecast - by Application
- 10.3.1. Cancer
- 10.3.2. Infectious Diseases
- 10.3.3. Others
- 10.4. Market Analysis, Insights and Forecast - by End User
- 10.4.1. Diagnostics Laboratories
- 10.4.2. Academic and Research Institutions
- 10.4.3. Contract Research Organizations (CROs)
- 10.1. Market Analysis, Insights and Forecast - by Product
- 11. South America In-Situ Hybridization Industry Analysis, Insights and Forecast, 2020-2032
- 11.1. Market Analysis, Insights and Forecast - by Product
- 11.1.1. Analytical Instruments
- 11.1.2. Kits and Reagents
- 11.1.3. Software and Services
- 11.1.4. Other Products
- 11.2. Market Analysis, Insights and Forecast - by Technique
- 11.2.1. Fluoresence In Situ Hybridization (FISH)
- 11.2.2. Chromogenic In Situ hybridization (CISH)
- 11.3. Market Analysis, Insights and Forecast - by Application
- 11.3.1. Cancer
- 11.3.2. Infectious Diseases
- 11.3.3. Others
- 11.4. Market Analysis, Insights and Forecast - by End User
- 11.4.1. Diagnostics Laboratories
- 11.4.2. Academic and Research Institutions
- 11.4.3. Contract Research Organizations (CROs)
- 11.1. Market Analysis, Insights and Forecast - by Product
- 12. Competitive Analysis
- 12.1. Company Profiles
- 12.1.1 Thermo Fisher Scientific Inc.
- 12.1.1.1. Company Overview
- 12.1.1.2. Products
- 12.1.1.3. Company Financials
- 12.1.1.4. SWOT Analysis
- 12.1.2 Abbott Laboratories Inc.
- 12.1.2.1. Company Overview
- 12.1.2.2. Products
- 12.1.2.3. Company Financials
- 12.1.2.4. SWOT Analysis
- 12.1.3 Agilent Technologies Inc.
- 12.1.3.1. Company Overview
- 12.1.3.2. Products
- 12.1.3.3. Company Financials
- 12.1.3.4. SWOT Analysis
- 12.1.4 Merck KGaA
- 12.1.4.1. Company Overview
- 12.1.4.2. Products
- 12.1.4.3. Company Financials
- 12.1.4.4. SWOT Analysis
- 12.1.5 PerkinElmer Inc.
- 12.1.5.1. Company Overview
- 12.1.5.2. Products
- 12.1.5.3. Company Financials
- 12.1.5.4. SWOT Analysis
- 12.1.6 Bio-Rad Laboratories Inc.
- 12.1.6.1. Company Overview
- 12.1.6.2. Products
- 12.1.6.3. Company Financials
- 12.1.6.4. SWOT Analysis
- 12.1.7 F. Hoffmann-La Roche Ltd
- 12.1.7.1. Company Overview
- 12.1.7.2. Products
- 12.1.7.3. Company Financials
- 12.1.7.4. SWOT Analysis
- 12.1.8 Danaher Corporation
- 12.1.8.1. Company Overview
- 12.1.8.2. Products
- 12.1.8.3. Company Financials
- 12.1.8.4. SWOT Analysis
- 12.1.9 Abnova Corporation
- 12.1.9.1. Company Overview
- 12.1.9.2. Products
- 12.1.9.3. Company Financials
- 12.1.9.4. SWOT Analysis
- 12.1.10 BioGenex Laboratories
- 12.1.10.1. Company Overview
- 12.1.10.2. Products
- 12.1.10.3. Company Financials
- 12.1.10.4. SWOT Analysis
- 12.1.1 Thermo Fisher Scientific Inc.
- 12.2. Market Entropy
- 12.2.1 Company's Key Areas Served
- 12.2.2 Recent Developments
- 12.3. Company Market Share Analysis 2025
- 12.3.1 Top 5 Companies Market Share Analysis
- 12.3.2 Top 3 Companies Market Share Analysis
- 12.4. List of Potential Customers
- 13. Research Methodology
List of Figures
- Figure 1: Global In-Situ Hybridization Industry Revenue Breakdown (Billion, %) by Region 2025 & 2033
- Figure 2: North America In-Situ Hybridization Industry Revenue (Billion), by Product 2025 & 2033
- Figure 3: North America In-Situ Hybridization Industry Revenue Share (%), by Product 2025 & 2033
- Figure 4: North America In-Situ Hybridization Industry Revenue (Billion), by Technique 2025 & 2033
- Figure 5: North America In-Situ Hybridization Industry Revenue Share (%), by Technique 2025 & 2033
- Figure 6: North America In-Situ Hybridization Industry Revenue (Billion), by Application 2025 & 2033
- Figure 7: North America In-Situ Hybridization Industry Revenue Share (%), by Application 2025 & 2033
- Figure 8: North America In-Situ Hybridization Industry Revenue (Billion), by End User 2025 & 2033
- Figure 9: North America In-Situ Hybridization Industry Revenue Share (%), by End User 2025 & 2033
- Figure 10: North America In-Situ Hybridization Industry Revenue (Billion), by Country 2025 & 2033
- Figure 11: North America In-Situ Hybridization Industry Revenue Share (%), by Country 2025 & 2033
- Figure 12: Europe In-Situ Hybridization Industry Revenue (Billion), by Product 2025 & 2033
- Figure 13: Europe In-Situ Hybridization Industry Revenue Share (%), by Product 2025 & 2033
- Figure 14: Europe In-Situ Hybridization Industry Revenue (Billion), by Technique 2025 & 2033
- Figure 15: Europe In-Situ Hybridization Industry Revenue Share (%), by Technique 2025 & 2033
- Figure 16: Europe In-Situ Hybridization Industry Revenue (Billion), by Application 2025 & 2033
- Figure 17: Europe In-Situ Hybridization Industry Revenue Share (%), by Application 2025 & 2033
- Figure 18: Europe In-Situ Hybridization Industry Revenue (Billion), by End User 2025 & 2033
- Figure 19: Europe In-Situ Hybridization Industry Revenue Share (%), by End User 2025 & 2033
- Figure 20: Europe In-Situ Hybridization Industry Revenue (Billion), by Country 2025 & 2033
- Figure 21: Europe In-Situ Hybridization Industry Revenue Share (%), by Country 2025 & 2033
- Figure 22: Asia Pacific In-Situ Hybridization Industry Revenue (Billion), by Product 2025 & 2033
- Figure 23: Asia Pacific In-Situ Hybridization Industry Revenue Share (%), by Product 2025 & 2033
- Figure 24: Asia Pacific In-Situ Hybridization Industry Revenue (Billion), by Technique 2025 & 2033
- Figure 25: Asia Pacific In-Situ Hybridization Industry Revenue Share (%), by Technique 2025 & 2033
- Figure 26: Asia Pacific In-Situ Hybridization Industry Revenue (Billion), by Application 2025 & 2033
- Figure 27: Asia Pacific In-Situ Hybridization Industry Revenue Share (%), by Application 2025 & 2033
- Figure 28: Asia Pacific In-Situ Hybridization Industry Revenue (Billion), by End User 2025 & 2033
- Figure 29: Asia Pacific In-Situ Hybridization Industry Revenue Share (%), by End User 2025 & 2033
- Figure 30: Asia Pacific In-Situ Hybridization Industry Revenue (Billion), by Country 2025 & 2033
- Figure 31: Asia Pacific In-Situ Hybridization Industry Revenue Share (%), by Country 2025 & 2033
- Figure 32: Middle East and Africa In-Situ Hybridization Industry Revenue (Billion), by Product 2025 & 2033
- Figure 33: Middle East and Africa In-Situ Hybridization Industry Revenue Share (%), by Product 2025 & 2033
- Figure 34: Middle East and Africa In-Situ Hybridization Industry Revenue (Billion), by Technique 2025 & 2033
- Figure 35: Middle East and Africa In-Situ Hybridization Industry Revenue Share (%), by Technique 2025 & 2033
- Figure 36: Middle East and Africa In-Situ Hybridization Industry Revenue (Billion), by Application 2025 & 2033
- Figure 37: Middle East and Africa In-Situ Hybridization Industry Revenue Share (%), by Application 2025 & 2033
- Figure 38: Middle East and Africa In-Situ Hybridization Industry Revenue (Billion), by End User 2025 & 2033
- Figure 39: Middle East and Africa In-Situ Hybridization Industry Revenue Share (%), by End User 2025 & 2033
- Figure 40: Middle East and Africa In-Situ Hybridization Industry Revenue (Billion), by Country 2025 & 2033
- Figure 41: Middle East and Africa In-Situ Hybridization Industry Revenue Share (%), by Country 2025 & 2033
- Figure 42: South America In-Situ Hybridization Industry Revenue (Billion), by Product 2025 & 2033
- Figure 43: South America In-Situ Hybridization Industry Revenue Share (%), by Product 2025 & 2033
- Figure 44: South America In-Situ Hybridization Industry Revenue (Billion), by Technique 2025 & 2033
- Figure 45: South America In-Situ Hybridization Industry Revenue Share (%), by Technique 2025 & 2033
- Figure 46: South America In-Situ Hybridization Industry Revenue (Billion), by Application 2025 & 2033
- Figure 47: South America In-Situ Hybridization Industry Revenue Share (%), by Application 2025 & 2033
- Figure 48: South America In-Situ Hybridization Industry Revenue (Billion), by End User 2025 & 2033
- Figure 49: South America In-Situ Hybridization Industry Revenue Share (%), by End User 2025 & 2033
- Figure 50: South America In-Situ Hybridization Industry Revenue (Billion), by Country 2025 & 2033
- Figure 51: South America In-Situ Hybridization Industry Revenue Share (%), by Country 2025 & 2033
List of Tables
- Table 1: Global In-Situ Hybridization Industry Revenue Billion Forecast, by Product 2020 & 2033
- Table 2: Global In-Situ Hybridization Industry Revenue Billion Forecast, by Technique 2020 & 2033
- Table 3: Global In-Situ Hybridization Industry Revenue Billion Forecast, by Application 2020 & 2033
- Table 4: Global In-Situ Hybridization Industry Revenue Billion Forecast, by End User 2020 & 2033
- Table 5: Global In-Situ Hybridization Industry Revenue Billion Forecast, by Region 2020 & 2033
- Table 6: Global In-Situ Hybridization Industry Revenue Billion Forecast, by Product 2020 & 2033
- Table 7: Global In-Situ Hybridization Industry Revenue Billion Forecast, by Technique 2020 & 2033
- Table 8: Global In-Situ Hybridization Industry Revenue Billion Forecast, by Application 2020 & 2033
- Table 9: Global In-Situ Hybridization Industry Revenue Billion Forecast, by End User 2020 & 2033
- Table 10: Global In-Situ Hybridization Industry Revenue Billion Forecast, by Country 2020 & 2033
- Table 11: United States In-Situ Hybridization Industry Revenue (Billion) Forecast, by Application 2020 & 2033
- Table 12: Canada In-Situ Hybridization Industry Revenue (Billion) Forecast, by Application 2020 & 2033
- Table 13: Mexico In-Situ Hybridization Industry Revenue (Billion) Forecast, by Application 2020 & 2033
- Table 14: Global In-Situ Hybridization Industry Revenue Billion Forecast, by Product 2020 & 2033
- Table 15: Global In-Situ Hybridization Industry Revenue Billion Forecast, by Technique 2020 & 2033
- Table 16: Global In-Situ Hybridization Industry Revenue Billion Forecast, by Application 2020 & 2033
- Table 17: Global In-Situ Hybridization Industry Revenue Billion Forecast, by End User 2020 & 2033
- Table 18: Global In-Situ Hybridization Industry Revenue Billion Forecast, by Country 2020 & 2033
- Table 19: Germany In-Situ Hybridization Industry Revenue (Billion) Forecast, by Application 2020 & 2033
- Table 20: United Kingdom In-Situ Hybridization Industry Revenue (Billion) Forecast, by Application 2020 & 2033
- Table 21: France In-Situ Hybridization Industry Revenue (Billion) Forecast, by Application 2020 & 2033
- Table 22: Italy In-Situ Hybridization Industry Revenue (Billion) Forecast, by Application 2020 & 2033
- Table 23: Spain In-Situ Hybridization Industry Revenue (Billion) Forecast, by Application 2020 & 2033
- Table 24: Rest of Europe In-Situ Hybridization Industry Revenue (Billion) Forecast, by Application 2020 & 2033
- Table 25: Global In-Situ Hybridization Industry Revenue Billion Forecast, by Product 2020 & 2033
- Table 26: Global In-Situ Hybridization Industry Revenue Billion Forecast, by Technique 2020 & 2033
- Table 27: Global In-Situ Hybridization Industry Revenue Billion Forecast, by Application 2020 & 2033
- Table 28: Global In-Situ Hybridization Industry Revenue Billion Forecast, by End User 2020 & 2033
- Table 29: Global In-Situ Hybridization Industry Revenue Billion Forecast, by Country 2020 & 2033
- Table 30: China In-Situ Hybridization Industry Revenue (Billion) Forecast, by Application 2020 & 2033
- Table 31: Japan In-Situ Hybridization Industry Revenue (Billion) Forecast, by Application 2020 & 2033
- Table 32: India In-Situ Hybridization Industry Revenue (Billion) Forecast, by Application 2020 & 2033
- Table 33: Australia In-Situ Hybridization Industry Revenue (Billion) Forecast, by Application 2020 & 2033
- Table 34: South Korea In-Situ Hybridization Industry Revenue (Billion) Forecast, by Application 2020 & 2033
- Table 35: Rest of Asia Pacific In-Situ Hybridization Industry Revenue (Billion) Forecast, by Application 2020 & 2033
- Table 36: Global In-Situ Hybridization Industry Revenue Billion Forecast, by Product 2020 & 2033
- Table 37: Global In-Situ Hybridization Industry Revenue Billion Forecast, by Technique 2020 & 2033
- Table 38: Global In-Situ Hybridization Industry Revenue Billion Forecast, by Application 2020 & 2033
- Table 39: Global In-Situ Hybridization Industry Revenue Billion Forecast, by End User 2020 & 2033
- Table 40: Global In-Situ Hybridization Industry Revenue Billion Forecast, by Country 2020 & 2033
- Table 41: GCC In-Situ Hybridization Industry Revenue (Billion) Forecast, by Application 2020 & 2033
- Table 42: South Africa In-Situ Hybridization Industry Revenue (Billion) Forecast, by Application 2020 & 2033
- Table 43: Rest of Middle East and Africa In-Situ Hybridization Industry Revenue (Billion) Forecast, by Application 2020 & 2033
- Table 44: Global In-Situ Hybridization Industry Revenue Billion Forecast, by Product 2020 & 2033
- Table 45: Global In-Situ Hybridization Industry Revenue Billion Forecast, by Technique 2020 & 2033
- Table 46: Global In-Situ Hybridization Industry Revenue Billion Forecast, by Application 2020 & 2033
- Table 47: Global In-Situ Hybridization Industry Revenue Billion Forecast, by End User 2020 & 2033
- Table 48: Global In-Situ Hybridization Industry Revenue Billion Forecast, by Country 2020 & 2033
- Table 49: Brazil In-Situ Hybridization Industry Revenue (Billion) Forecast, by Application 2020 & 2033
- Table 50: Argentina In-Situ Hybridization Industry Revenue (Billion) Forecast, by Application 2020 & 2033
- Table 51: Rest of South America In-Situ Hybridization Industry Revenue (Billion) Forecast, by Application 2020 & 2033
Frequently Asked Questions
1. What is the projected Compound Annual Growth Rate (CAGR) of the In-Situ Hybridization Industry?
The projected CAGR is approximately 7.20%.
2. Which companies are prominent players in the In-Situ Hybridization Industry?
Key companies in the market include Thermo Fisher Scientific, Inc., Abbott Laboratories, Inc., Agilent Technologies, Inc., Merck KGaA, PerkinElmer, Inc., Bio-Rad Laboratories, Inc., F. Hoffmann-La Roche Ltd, Danaher Corporation, Abnova Corporation, BioGenex Laboratories.
3. What are the main segments of the In-Situ Hybridization Industry?
The market segments include Product, Technique, Application, End User.
4. Can you provide details about the market size?
The market size is estimated to be USD 1.5 Billion as of 2022.
5. What are some drivers contributing to market growth?
Increasing Prevalence of Cancer. Infectious Diseases and Genetic Disorders; Advancements in Diagnostic Tools; Rising Awareness on Cancer Therapeutics.
6. What are the notable trends driving market growth?
The Fluorescence In Situ Hybridization (FISH) is Expected to Witness a Healthy Growth in the Market Over the Forecast Period.
7. Are there any restraints impacting market growth?
Lack of Skilled Personnel.
8. Can you provide examples of recent developments in the market?
September 2022: Vizgen launched Merscope Protein co-detection kits. This kit enables the measurement of subcellular spatial multi-omics by co-detecting RNA and proteins during standard Multiplexed Error-Robust Fluorescence in Situ Hybridization (MERFISH) experiment.
9. What pricing options are available for accessing the report?
Pricing options include single-user, multi-user, and enterprise licenses priced at USD 4750, USD 5250, and USD 8750 respectively.
10. Is the market size provided in terms of value or volume?
The market size is provided in terms of value, measured in Billion.
11. Are there any specific market keywords associated with the report?
Yes, the market keyword associated with the report is "In-Situ Hybridization Industry," which aids in identifying and referencing the specific market segment covered.
12. How do I determine which pricing option suits my needs best?
The pricing options vary based on user requirements and access needs. Individual users may opt for single-user licenses, while businesses requiring broader access may choose multi-user or enterprise licenses for cost-effective access to the report.
13. Are there any additional resources or data provided in the In-Situ Hybridization Industry report?
While the report offers comprehensive insights, it's advisable to review the specific contents or supplementary materials provided to ascertain if additional resources or data are available.
14. How can I stay updated on further developments or reports in the In-Situ Hybridization Industry?
To stay informed about further developments, trends, and reports in the In-Situ Hybridization Industry, consider subscribing to industry newsletters, following relevant companies and organizations, or regularly checking reputable industry news sources and publications.
Methodology
Step 1 - Identification of Relevant Samples Size from Population Database


Step 2 - Approaches for Defining Global Market Size (Value, Volume* & Price*)

Note*: In applicable scenarios
Step 3 - Data Sources
Primary Research
- Web Analytics
- Survey Reports
- Research Institute
- Latest Research Reports
- Opinion Leaders
Secondary Research
- Annual Reports
- White Paper
- Latest Press Release
- Industry Association
- Paid Database
- Investor Presentations

Step 4 - Data Triangulation
Involves using different sources of information in order to increase the validity of a study
These sources are likely to be stakeholders in a program - participants, other researchers, program staff, other community members, and so on.
Then we put all data in single framework & apply various statistical tools to find out the dynamic on the market.
During the analysis stage, feedback from the stakeholder groups would be compared to determine areas of agreement as well as areas of divergence