

Key Insights
The global ground beef market is a robust and evolving sector, projected to reach a substantial $879,968.5 million by 2024. This significant market value underscores the pervasive demand for ground beef across diverse culinary applications and consumer preferences. The market is propelled by a healthy Compound Annual Growth Rate (CAGR) of 5.5% during the forecast period of 2025-2033, indicating sustained and strong expansion. Key drivers for this growth include increasing global protein consumption, a rising disposable income in emerging economies leading to greater affordability of meat products, and the versatility of ground beef in a wide array of dishes, from everyday meals to gourmet creations. Furthermore, the expanding food service industry, coupled with the growing popularity of processed meat products like burgers, meatballs, and sausages, directly fuels the demand for ground beef. The convenience factor associated with ground beef, allowing for quick preparation and diverse cooking methods, also contributes significantly to its widespread appeal among consumers globally.
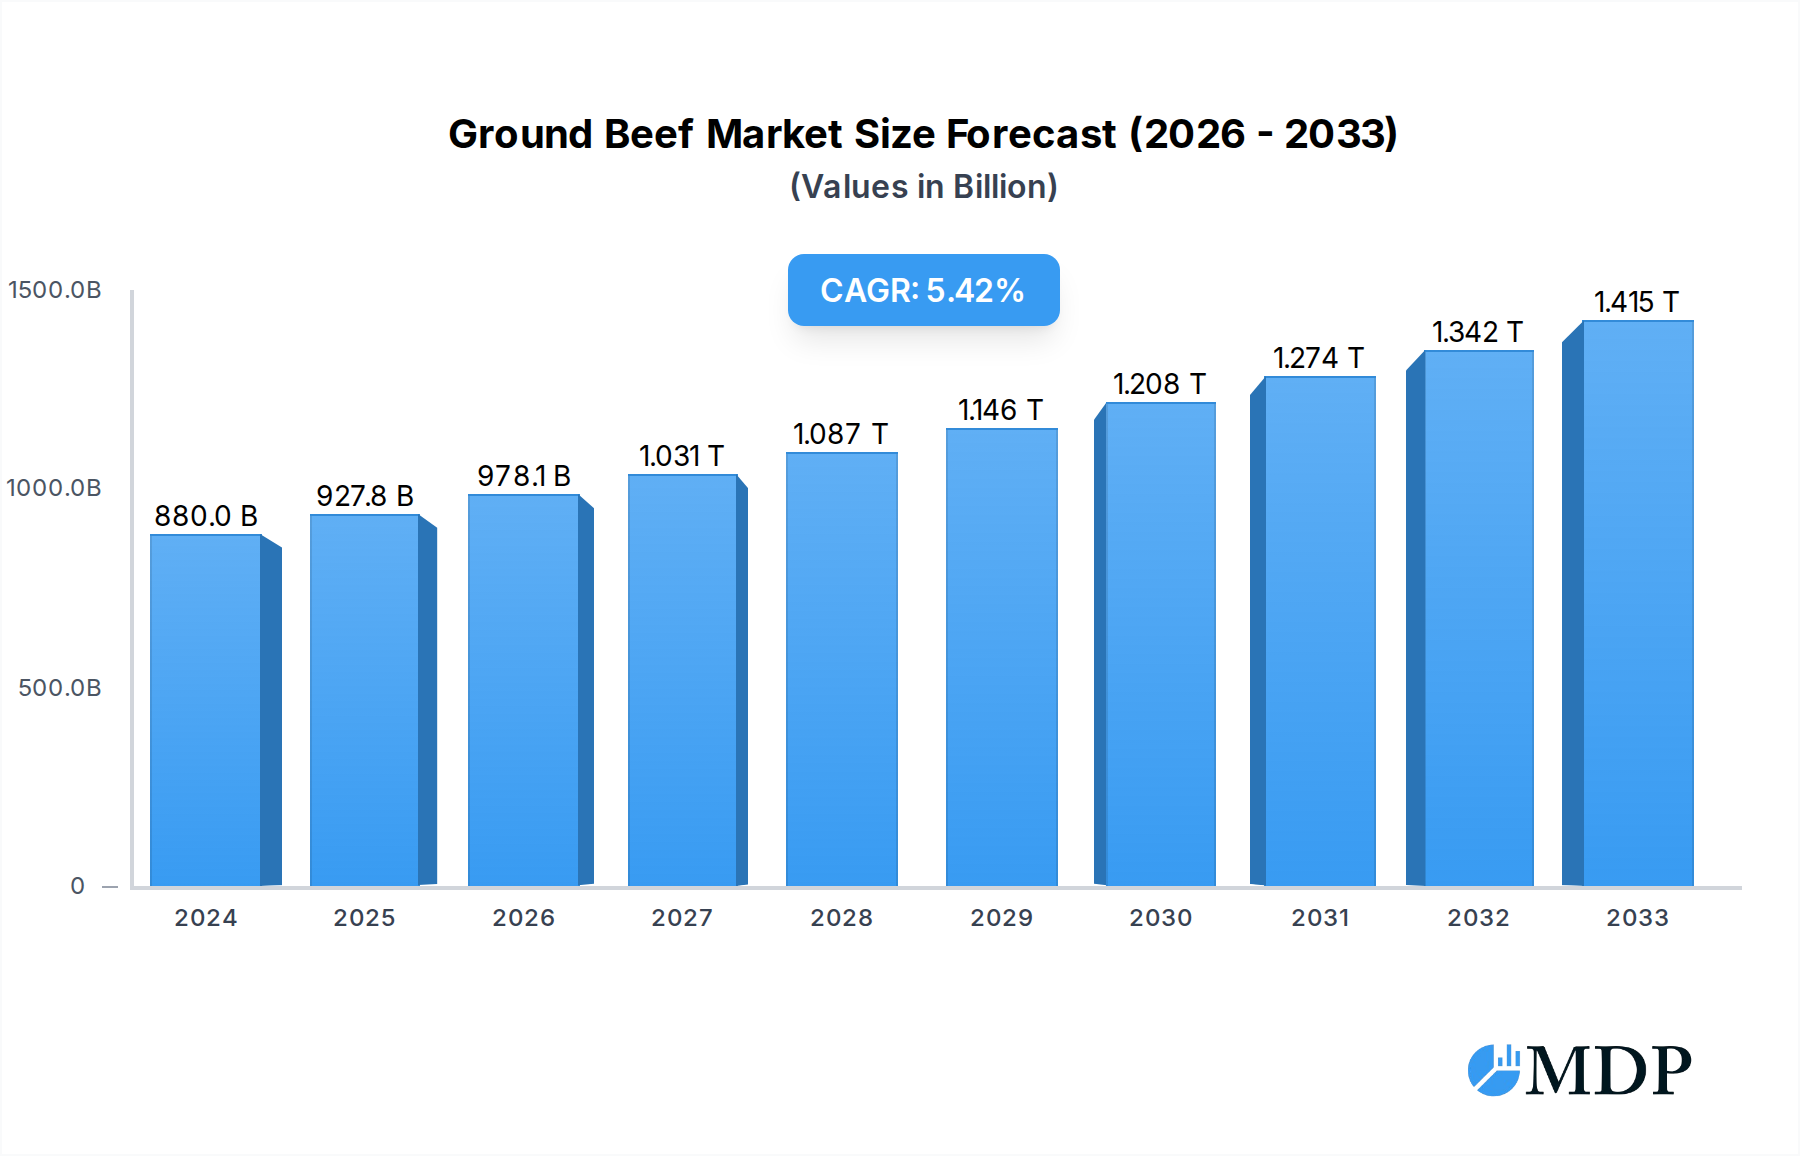
Ground Beef Market Size (In Billion)
The market is segmented by application into Home and Commercial sectors, with the Commercial segment, encompassing restaurants, hotels, and catering services, playing a crucial role in driving volume. By type, Ground Chuck and Ground Sirloin represent key product categories, catering to different taste profiles and price points. Leading companies such as Tyson Foods Inc., JBS USA Holdings Inc., and Cargill Meat Solutions Corp. are instrumental in shaping market dynamics through their extensive supply chains, product innovation, and strategic expansions. Geographically, North America currently holds a dominant share, driven by established consumption patterns and a well-developed meat processing infrastructure. However, the Asia Pacific region is anticipated to witness the fastest growth due to rapid urbanization, evolving dietary habits, and a burgeoning middle class with increasing purchasing power for protein-rich foods. Despite the positive outlook, potential restraints such as fluctuating raw material prices, increasing concerns around animal welfare, and the growing adoption of plant-based alternatives could pose challenges, necessitating strategic adaptations from market players.

Ground Beef Company Market Share
Ground Beef Market Insights: A Comprehensive 2025-2033 Forecast
This in-depth report provides a detailed analysis of the global ground beef market, encompassing its current state, future trajectory, and key influencing factors. Designed for industry stakeholders, investors, and strategic planners, this report offers actionable insights to navigate the evolving landscape of this vital food sector. The study spans from 2019 to 2033, with a base year of 2025 and a forecast period of 2025–2033.
Ground Beef Market Dynamics & Concentration
The global ground beef market exhibits a moderate to high level of concentration, with key players such as Tyson Foods Inc., JBS USA Holdings Inc., and Cargill Meat Solutions Corp. dominating significant market share. Innovation drivers are primarily centered around product quality, safety, and the development of value-added ground beef products. Regulatory frameworks, particularly concerning food safety and labeling, play a crucial role in shaping market access and consumer trust. Product substitutes, including plant-based alternatives and other protein sources, present a growing competitive challenge, necessitating continuous adaptation by ground beef producers. End-user trends are shifting towards convenience, health consciousness, and sustainability, influencing product development and marketing strategies. Mergers and acquisition (M&A) activities are expected to continue as companies seek to consolidate market position, expand product portfolios, and achieve economies of scale. The M&A deal count in the historical period (2019-2024) was approximately 15, signaling ongoing consolidation. Market share for the top five players is estimated at over 60%.
Ground Beef Industry Trends & Analysis
The ground beef industry is poised for steady growth, driven by a combination of increasing global protein demand, evolving consumer preferences, and advancements in production technology. The market CAGR is projected to be in the range of 4.5% to 6.0% from 2025 to 2033. Market penetration of premium and specialty ground beef products is on the rise, reflecting a consumer willingness to pay for enhanced quality, flavor, and ethical sourcing. Technological disruptions are impacting the sector through enhanced traceability systems, improved processing efficiencies, and innovative packaging solutions that extend shelf life and maintain freshness. Consumer preferences are increasingly influenced by health and wellness trends, with a growing demand for leaner ground beef options and products with specific nutritional profiles. Furthermore, the convenience factor remains paramount, with ready-to-cook and pre-seasoned ground beef products gaining traction. Competitive dynamics are characterized by a focus on brand differentiation, aggressive marketing campaigns, and strategic partnerships aimed at securing supply chains and expanding market reach. The industry is also witnessing a growing emphasis on sustainable sourcing and animal welfare practices, which are becoming significant purchasing drivers for a segment of consumers. The increasing adoption of advanced agricultural practices and supply chain management technologies is further contributing to market efficiency and product quality improvements, further solidifying the position of ground beef as a staple protein.
Leading Markets & Segments in Ground Beef
The North American region, particularly the United States, is a dominant market for ground beef, driven by deeply ingrained culinary traditions and high per capita consumption. Within North America, the Home application segment holds substantial sway, accounting for an estimated 75% of market consumption. This dominance is fueled by the versatility of ground beef in everyday meals and its affordability as a protein source for households. The Commercial application segment, encompassing restaurants, food service providers, and catering businesses, represents the remaining 25% and is growing steadily due to the consistent demand from the hospitality industry.
In terms of product types, Ground Chuck remains a perennial favorite, representing approximately 50% of the market share due to its favorable fat-to-lean ratio, making it ideal for burgers and meatballs. Ground Sirloin, while commanding a higher price point, is experiencing robust growth, estimated at 20% of the market, driven by the increasing consumer focus on healthier eating habits and a preference for leaner protein options.
Key drivers of this dominance include:
- Established Culinary Habits: Ground beef is a cornerstone of many popular dishes, making its consumption deeply embedded in consumer lifestyles.
- Economic Policies & Affordability: Favorable agricultural policies and the relatively competitive pricing of ground beef contribute to its widespread accessibility and demand.
- Infrastructure & Distribution Networks: A well-developed agricultural and distribution infrastructure ensures consistent supply and availability across the country.
- Consumer Preference for Familiarity: The familiarity and perceived reliability of ground beef as a protein source contribute to its sustained demand.
- Innovation in Value-Added Products: The development of pre-seasoned, portion-controlled, and specialty blends of ground beef caters to evolving consumer needs for convenience and variety, further solidifying its market position.
Ground Beef Product Developments
Ground beef product developments are increasingly focused on consumer-centric innovations. This includes the introduction of leaner formulations, specialty blends with enhanced flavor profiles (e.g., truffle-infused, herb-marinated), and convenient pre-portioned or ready-to-cook options. Technological advancements in processing are enabling greater control over fat content and texture, catering to health-conscious consumers. Competitive advantages are being carved out through superior sourcing practices, enhanced traceability, and innovative packaging that extends shelf life and ensures product freshness, meeting the growing demand for transparency and convenience in the food industry.
Key Drivers of Ground Beef Growth
Several key factors are driving the growth of the ground beef market. Technological advancements in livestock management and processing are improving efficiency and product quality. Economic growth, particularly in developing regions, is leading to increased disposable incomes and a greater demand for protein-rich foods like ground beef. Furthermore, evolving consumer preferences for convenient and versatile protein sources, coupled with the enduring popularity of classic dishes featuring ground beef, are significant growth accelerators. Favorable regulatory environments that support food safety and transparent labeling also contribute to consumer confidence and market expansion.
Challenges in the Ground Beef Market
Despite its growth potential, the ground beef market faces several challenges. Stringent regulatory hurdles related to food safety, animal welfare, and environmental impact can increase operational costs and complexity. Volatile supply chain dynamics, including fluctuating feed costs and potential disruptions from disease outbreaks, pose significant risks. Intense competitive pressures from both traditional protein sources and the rapidly growing plant-based alternative market necessitate continuous innovation and strategic adaptation. These challenges, if not effectively managed, can impact profitability and market share.
Emerging Opportunities in Ground Beef
Emerging opportunities in the ground beef market lie in leveraging technological breakthroughs in sustainable agriculture and precision farming to enhance production efficiency and reduce environmental footprint. Strategic partnerships with ingredient suppliers and food service providers can unlock new market segments and distribution channels. Furthermore, market expansion into regions with growing middle classes and increasing protein consumption presents significant long-term growth potential. The development of value-added products catering to specific dietary needs and preferences, such as grass-fed or organic options, also represents a key avenue for future growth.
Leading Players in the Ground Beef Sector
- Tyson Foods Inc.
- JBS USA Holdings Inc.
- Cargill Meat Solutions Corp.
- OSI Group LLC
- Hormel Foods Corp.
- SYSCO Corp.
- National Beef Packing Co. LLC
- American Foods Group LLC
- Keystone Foods LLC
- Greater Omaha Packing
- CTI Foods LLC
- Wolverine Packing Co.
- Agri Beef Co.
- West Liberty Foods LLC
- Kenosha Beef International Ltd.
Key Milestones in Ground Beef Industry
- 2019: Increased consumer interest in traceable and ethically sourced meat.
- 2020: Heightened demand for convenient meal solutions, boosting sales of pre-packaged ground beef.
- 2021: Significant investment in plant-based protein alternatives intensifies competition.
- 2022: Advancements in food safety technology improve recall efficiency and consumer confidence.
- 2023: Growing emphasis on sustainability in livestock farming gains traction.
- 2024: Supply chain resilience becomes a paramount focus for industry leaders.
Strategic Outlook for Ground Beef Market
The strategic outlook for the ground beef market is characterized by a focus on innovation, sustainability, and market diversification. Growth accelerators will stem from developing premium and value-added products that cater to evolving consumer demands for health, convenience, and ethical sourcing. Strategic investments in technology for enhanced traceability and efficient production will be crucial. Exploring untapped international markets and strengthening partnerships across the supply chain will further solidify market position and drive long-term profitability in this dynamic sector.
Ground Beef Segmentation
-
1. Application
- 1.1. Home
- 1.2. Commercial
-
2. Type
- 2.1. Ground Chuck
- 2.2. Ground Sirloin
Ground Beef Segmentation By Geography
-
1. North America
- 1.1. United States
- 1.2. Canada
- 1.3. Mexico
-
2. South America
- 2.1. Brazil
- 2.2. Argentina
- 2.3. Rest of South America
-
3. Europe
- 3.1. United Kingdom
- 3.2. Germany
- 3.3. France
- 3.4. Italy
- 3.5. Spain
- 3.6. Russia
- 3.7. Benelux
- 3.8. Nordics
- 3.9. Rest of Europe
-
4. Middle East & Africa
- 4.1. Turkey
- 4.2. Israel
- 4.3. GCC
- 4.4. North Africa
- 4.5. South Africa
- 4.6. Rest of Middle East & Africa
-
5. Asia Pacific
- 5.1. China
- 5.2. India
- 5.3. Japan
- 5.4. South Korea
- 5.5. ASEAN
- 5.6. Oceania
- 5.7. Rest of Asia Pacific
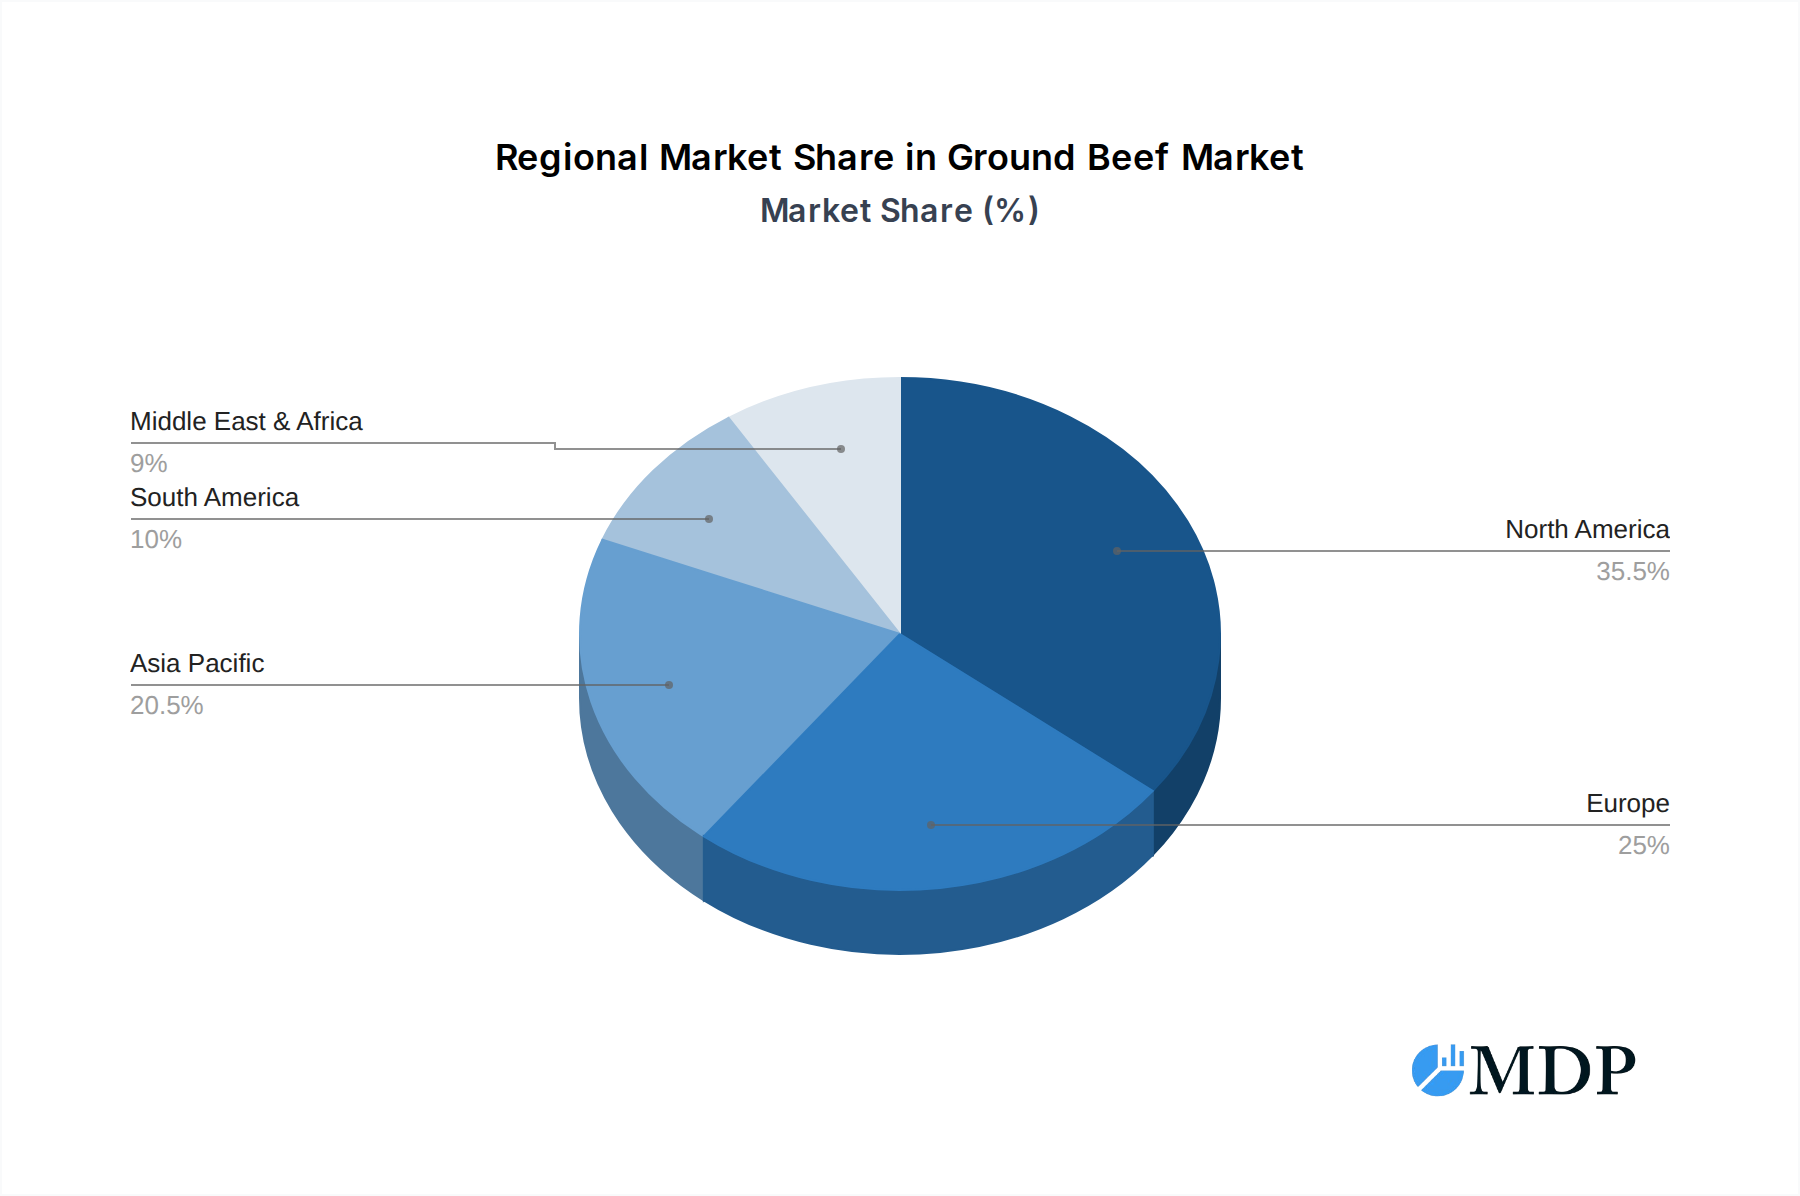
Ground Beef Regional Market Share
Geographic Coverage of Ground Beef
Ground Beef REPORT HIGHLIGHTS
| Aspects | Details |
|---|---|
| Study Period | 2020-2034 |
| Base Year | 2025 |
| Estimated Year | 2026 |
| Forecast Period | 2026-2034 |
| Historical Period | 2020-2025 |
| Growth Rate | CAGR of 5.5% from 2020-2034 |
| Segmentation |
|
Table of Contents
- 1. Introduction
- 1.1. Research Scope
- 1.2. Market Segmentation
- 1.3. Research Methodology
- 1.4. Definitions and Assumptions
- 2. Executive Summary
- 2.1. Introduction
- 3. Market Dynamics
- 3.1. Introduction
- 3.2. Market Drivers
- 3.3. Market Restrains
- 3.4. Market Trends
- 4. Market Factor Analysis
- 4.1. Porters Five Forces
- 4.2. Supply/Value Chain
- 4.3. PESTEL analysis
- 4.4. Market Entropy
- 4.5. Patent/Trademark Analysis
- 5. Global Ground Beef Analysis, Insights and Forecast, 2020-2032
- 5.1. Market Analysis, Insights and Forecast - by Application
- 5.1.1. Home
- 5.1.2. Commercial
- 5.2. Market Analysis, Insights and Forecast - by Type
- 5.2.1. Ground Chuck
- 5.2.2. Ground Sirloin
- 5.3. Market Analysis, Insights and Forecast - by Region
- 5.3.1. North America
- 5.3.2. South America
- 5.3.3. Europe
- 5.3.4. Middle East & Africa
- 5.3.5. Asia Pacific
- 5.1. Market Analysis, Insights and Forecast - by Application
- 6. North America Ground Beef Analysis, Insights and Forecast, 2020-2032
- 6.1. Market Analysis, Insights and Forecast - by Application
- 6.1.1. Home
- 6.1.2. Commercial
- 6.2. Market Analysis, Insights and Forecast - by Type
- 6.2.1. Ground Chuck
- 6.2.2. Ground Sirloin
- 6.1. Market Analysis, Insights and Forecast - by Application
- 7. South America Ground Beef Analysis, Insights and Forecast, 2020-2032
- 7.1. Market Analysis, Insights and Forecast - by Application
- 7.1.1. Home
- 7.1.2. Commercial
- 7.2. Market Analysis, Insights and Forecast - by Type
- 7.2.1. Ground Chuck
- 7.2.2. Ground Sirloin
- 7.1. Market Analysis, Insights and Forecast - by Application
- 8. Europe Ground Beef Analysis, Insights and Forecast, 2020-2032
- 8.1. Market Analysis, Insights and Forecast - by Application
- 8.1.1. Home
- 8.1.2. Commercial
- 8.2. Market Analysis, Insights and Forecast - by Type
- 8.2.1. Ground Chuck
- 8.2.2. Ground Sirloin
- 8.1. Market Analysis, Insights and Forecast - by Application
- 9. Middle East & Africa Ground Beef Analysis, Insights and Forecast, 2020-2032
- 9.1. Market Analysis, Insights and Forecast - by Application
- 9.1.1. Home
- 9.1.2. Commercial
- 9.2. Market Analysis, Insights and Forecast - by Type
- 9.2.1. Ground Chuck
- 9.2.2. Ground Sirloin
- 9.1. Market Analysis, Insights and Forecast - by Application
- 10. Asia Pacific Ground Beef Analysis, Insights and Forecast, 2020-2032
- 10.1. Market Analysis, Insights and Forecast - by Application
- 10.1.1. Home
- 10.1.2. Commercial
- 10.2. Market Analysis, Insights and Forecast - by Type
- 10.2.1. Ground Chuck
- 10.2.2. Ground Sirloin
- 10.1. Market Analysis, Insights and Forecast - by Application
- 11. Competitive Analysis
- 11.1. Global Market Share Analysis 2025
- 11.2. Company Profiles
- 11.2.1 Tyson Foods Inc.
- 11.2.1.1. Overview
- 11.2.1.2. Products
- 11.2.1.3. SWOT Analysis
- 11.2.1.4. Recent Developments
- 11.2.1.5. Financials (Based on Availability)
- 11.2.2 JBS USA Holdings Inc.
- 11.2.2.1. Overview
- 11.2.2.2. Products
- 11.2.2.3. SWOT Analysis
- 11.2.2.4. Recent Developments
- 11.2.2.5. Financials (Based on Availability)
- 11.2.3 Cargill Meat Solutions Corp.
- 11.2.3.1. Overview
- 11.2.3.2. Products
- 11.2.3.3. SWOT Analysis
- 11.2.3.4. Recent Developments
- 11.2.3.5. Financials (Based on Availability)
- 11.2.4 OSI Group LLC
- 11.2.4.1. Overview
- 11.2.4.2. Products
- 11.2.4.3. SWOT Analysis
- 11.2.4.4. Recent Developments
- 11.2.4.5. Financials (Based on Availability)
- 11.2.5 Hormel Foods Corp.
- 11.2.5.1. Overview
- 11.2.5.2. Products
- 11.2.5.3. SWOT Analysis
- 11.2.5.4. Recent Developments
- 11.2.5.5. Financials (Based on Availability)
- 11.2.6 SYSCO Corp.
- 11.2.6.1. Overview
- 11.2.6.2. Products
- 11.2.6.3. SWOT Analysis
- 11.2.6.4. Recent Developments
- 11.2.6.5. Financials (Based on Availability)
- 11.2.7 National Beef Packing Co. LLC
- 11.2.7.1. Overview
- 11.2.7.2. Products
- 11.2.7.3. SWOT Analysis
- 11.2.7.4. Recent Developments
- 11.2.7.5. Financials (Based on Availability)
- 11.2.8 American Foods Group LLC
- 11.2.8.1. Overview
- 11.2.8.2. Products
- 11.2.8.3. SWOT Analysis
- 11.2.8.4. Recent Developments
- 11.2.8.5. Financials (Based on Availability)
- 11.2.9 Keystone Foods LLC
- 11.2.9.1. Overview
- 11.2.9.2. Products
- 11.2.9.3. SWOT Analysis
- 11.2.9.4. Recent Developments
- 11.2.9.5. Financials (Based on Availability)
- 11.2.10 Greater Omaha Packing
- 11.2.10.1. Overview
- 11.2.10.2. Products
- 11.2.10.3. SWOT Analysis
- 11.2.10.4. Recent Developments
- 11.2.10.5. Financials (Based on Availability)
- 11.2.11 CTI Foods LLC
- 11.2.11.1. Overview
- 11.2.11.2. Products
- 11.2.11.3. SWOT Analysis
- 11.2.11.4. Recent Developments
- 11.2.11.5. Financials (Based on Availability)
- 11.2.12 Wolverine Packing Co.
- 11.2.12.1. Overview
- 11.2.12.2. Products
- 11.2.12.3. SWOT Analysis
- 11.2.12.4. Recent Developments
- 11.2.12.5. Financials (Based on Availability)
- 11.2.13 Agri Beef Co.
- 11.2.13.1. Overview
- 11.2.13.2. Products
- 11.2.13.3. SWOT Analysis
- 11.2.13.4. Recent Developments
- 11.2.13.5. Financials (Based on Availability)
- 11.2.14 West Liberty Foods LLC
- 11.2.14.1. Overview
- 11.2.14.2. Products
- 11.2.14.3. SWOT Analysis
- 11.2.14.4. Recent Developments
- 11.2.14.5. Financials (Based on Availability)
- 11.2.15 Kenosha Beef International Ltd.
- 11.2.15.1. Overview
- 11.2.15.2. Products
- 11.2.15.3. SWOT Analysis
- 11.2.15.4. Recent Developments
- 11.2.15.5. Financials (Based on Availability)
- 11.2.1 Tyson Foods Inc.
List of Figures
- Figure 1: Global Ground Beef Revenue Breakdown (undefined, %) by Region 2025 & 2033
- Figure 2: Global Ground Beef Volume Breakdown (K, %) by Region 2025 & 2033
- Figure 3: North America Ground Beef Revenue (undefined), by Application 2025 & 2033
- Figure 4: North America Ground Beef Volume (K), by Application 2025 & 2033
- Figure 5: North America Ground Beef Revenue Share (%), by Application 2025 & 2033
- Figure 6: North America Ground Beef Volume Share (%), by Application 2025 & 2033
- Figure 7: North America Ground Beef Revenue (undefined), by Type 2025 & 2033
- Figure 8: North America Ground Beef Volume (K), by Type 2025 & 2033
- Figure 9: North America Ground Beef Revenue Share (%), by Type 2025 & 2033
- Figure 10: North America Ground Beef Volume Share (%), by Type 2025 & 2033
- Figure 11: North America Ground Beef Revenue (undefined), by Country 2025 & 2033
- Figure 12: North America Ground Beef Volume (K), by Country 2025 & 2033
- Figure 13: North America Ground Beef Revenue Share (%), by Country 2025 & 2033
- Figure 14: North America Ground Beef Volume Share (%), by Country 2025 & 2033
- Figure 15: South America Ground Beef Revenue (undefined), by Application 2025 & 2033
- Figure 16: South America Ground Beef Volume (K), by Application 2025 & 2033
- Figure 17: South America Ground Beef Revenue Share (%), by Application 2025 & 2033
- Figure 18: South America Ground Beef Volume Share (%), by Application 2025 & 2033
- Figure 19: South America Ground Beef Revenue (undefined), by Type 2025 & 2033
- Figure 20: South America Ground Beef Volume (K), by Type 2025 & 2033
- Figure 21: South America Ground Beef Revenue Share (%), by Type 2025 & 2033
- Figure 22: South America Ground Beef Volume Share (%), by Type 2025 & 2033
- Figure 23: South America Ground Beef Revenue (undefined), by Country 2025 & 2033
- Figure 24: South America Ground Beef Volume (K), by Country 2025 & 2033
- Figure 25: South America Ground Beef Revenue Share (%), by Country 2025 & 2033
- Figure 26: South America Ground Beef Volume Share (%), by Country 2025 & 2033
- Figure 27: Europe Ground Beef Revenue (undefined), by Application 2025 & 2033
- Figure 28: Europe Ground Beef Volume (K), by Application 2025 & 2033
- Figure 29: Europe Ground Beef Revenue Share (%), by Application 2025 & 2033
- Figure 30: Europe Ground Beef Volume Share (%), by Application 2025 & 2033
- Figure 31: Europe Ground Beef Revenue (undefined), by Type 2025 & 2033
- Figure 32: Europe Ground Beef Volume (K), by Type 2025 & 2033
- Figure 33: Europe Ground Beef Revenue Share (%), by Type 2025 & 2033
- Figure 34: Europe Ground Beef Volume Share (%), by Type 2025 & 2033
- Figure 35: Europe Ground Beef Revenue (undefined), by Country 2025 & 2033
- Figure 36: Europe Ground Beef Volume (K), by Country 2025 & 2033
- Figure 37: Europe Ground Beef Revenue Share (%), by Country 2025 & 2033
- Figure 38: Europe Ground Beef Volume Share (%), by Country 2025 & 2033
- Figure 39: Middle East & Africa Ground Beef Revenue (undefined), by Application 2025 & 2033
- Figure 40: Middle East & Africa Ground Beef Volume (K), by Application 2025 & 2033
- Figure 41: Middle East & Africa Ground Beef Revenue Share (%), by Application 2025 & 2033
- Figure 42: Middle East & Africa Ground Beef Volume Share (%), by Application 2025 & 2033
- Figure 43: Middle East & Africa Ground Beef Revenue (undefined), by Type 2025 & 2033
- Figure 44: Middle East & Africa Ground Beef Volume (K), by Type 2025 & 2033
- Figure 45: Middle East & Africa Ground Beef Revenue Share (%), by Type 2025 & 2033
- Figure 46: Middle East & Africa Ground Beef Volume Share (%), by Type 2025 & 2033
- Figure 47: Middle East & Africa Ground Beef Revenue (undefined), by Country 2025 & 2033
- Figure 48: Middle East & Africa Ground Beef Volume (K), by Country 2025 & 2033
- Figure 49: Middle East & Africa Ground Beef Revenue Share (%), by Country 2025 & 2033
- Figure 50: Middle East & Africa Ground Beef Volume Share (%), by Country 2025 & 2033
- Figure 51: Asia Pacific Ground Beef Revenue (undefined), by Application 2025 & 2033
- Figure 52: Asia Pacific Ground Beef Volume (K), by Application 2025 & 2033
- Figure 53: Asia Pacific Ground Beef Revenue Share (%), by Application 2025 & 2033
- Figure 54: Asia Pacific Ground Beef Volume Share (%), by Application 2025 & 2033
- Figure 55: Asia Pacific Ground Beef Revenue (undefined), by Type 2025 & 2033
- Figure 56: Asia Pacific Ground Beef Volume (K), by Type 2025 & 2033
- Figure 57: Asia Pacific Ground Beef Revenue Share (%), by Type 2025 & 2033
- Figure 58: Asia Pacific Ground Beef Volume Share (%), by Type 2025 & 2033
- Figure 59: Asia Pacific Ground Beef Revenue (undefined), by Country 2025 & 2033
- Figure 60: Asia Pacific Ground Beef Volume (K), by Country 2025 & 2033
- Figure 61: Asia Pacific Ground Beef Revenue Share (%), by Country 2025 & 2033
- Figure 62: Asia Pacific Ground Beef Volume Share (%), by Country 2025 & 2033
List of Tables
- Table 1: Global Ground Beef Revenue undefined Forecast, by Application 2020 & 2033
- Table 2: Global Ground Beef Volume K Forecast, by Application 2020 & 2033
- Table 3: Global Ground Beef Revenue undefined Forecast, by Type 2020 & 2033
- Table 4: Global Ground Beef Volume K Forecast, by Type 2020 & 2033
- Table 5: Global Ground Beef Revenue undefined Forecast, by Region 2020 & 2033
- Table 6: Global Ground Beef Volume K Forecast, by Region 2020 & 2033
- Table 7: Global Ground Beef Revenue undefined Forecast, by Application 2020 & 2033
- Table 8: Global Ground Beef Volume K Forecast, by Application 2020 & 2033
- Table 9: Global Ground Beef Revenue undefined Forecast, by Type 2020 & 2033
- Table 10: Global Ground Beef Volume K Forecast, by Type 2020 & 2033
- Table 11: Global Ground Beef Revenue undefined Forecast, by Country 2020 & 2033
- Table 12: Global Ground Beef Volume K Forecast, by Country 2020 & 2033
- Table 13: United States Ground Beef Revenue (undefined) Forecast, by Application 2020 & 2033
- Table 14: United States Ground Beef Volume (K) Forecast, by Application 2020 & 2033
- Table 15: Canada Ground Beef Revenue (undefined) Forecast, by Application 2020 & 2033
- Table 16: Canada Ground Beef Volume (K) Forecast, by Application 2020 & 2033
- Table 17: Mexico Ground Beef Revenue (undefined) Forecast, by Application 2020 & 2033
- Table 18: Mexico Ground Beef Volume (K) Forecast, by Application 2020 & 2033
- Table 19: Global Ground Beef Revenue undefined Forecast, by Application 2020 & 2033
- Table 20: Global Ground Beef Volume K Forecast, by Application 2020 & 2033
- Table 21: Global Ground Beef Revenue undefined Forecast, by Type 2020 & 2033
- Table 22: Global Ground Beef Volume K Forecast, by Type 2020 & 2033
- Table 23: Global Ground Beef Revenue undefined Forecast, by Country 2020 & 2033
- Table 24: Global Ground Beef Volume K Forecast, by Country 2020 & 2033
- Table 25: Brazil Ground Beef Revenue (undefined) Forecast, by Application 2020 & 2033
- Table 26: Brazil Ground Beef Volume (K) Forecast, by Application 2020 & 2033
- Table 27: Argentina Ground Beef Revenue (undefined) Forecast, by Application 2020 & 2033
- Table 28: Argentina Ground Beef Volume (K) Forecast, by Application 2020 & 2033
- Table 29: Rest of South America Ground Beef Revenue (undefined) Forecast, by Application 2020 & 2033
- Table 30: Rest of South America Ground Beef Volume (K) Forecast, by Application 2020 & 2033
- Table 31: Global Ground Beef Revenue undefined Forecast, by Application 2020 & 2033
- Table 32: Global Ground Beef Volume K Forecast, by Application 2020 & 2033
- Table 33: Global Ground Beef Revenue undefined Forecast, by Type 2020 & 2033
- Table 34: Global Ground Beef Volume K Forecast, by Type 2020 & 2033
- Table 35: Global Ground Beef Revenue undefined Forecast, by Country 2020 & 2033
- Table 36: Global Ground Beef Volume K Forecast, by Country 2020 & 2033
- Table 37: United Kingdom Ground Beef Revenue (undefined) Forecast, by Application 2020 & 2033
- Table 38: United Kingdom Ground Beef Volume (K) Forecast, by Application 2020 & 2033
- Table 39: Germany Ground Beef Revenue (undefined) Forecast, by Application 2020 & 2033
- Table 40: Germany Ground Beef Volume (K) Forecast, by Application 2020 & 2033
- Table 41: France Ground Beef Revenue (undefined) Forecast, by Application 2020 & 2033
- Table 42: France Ground Beef Volume (K) Forecast, by Application 2020 & 2033
- Table 43: Italy Ground Beef Revenue (undefined) Forecast, by Application 2020 & 2033
- Table 44: Italy Ground Beef Volume (K) Forecast, by Application 2020 & 2033
- Table 45: Spain Ground Beef Revenue (undefined) Forecast, by Application 2020 & 2033
- Table 46: Spain Ground Beef Volume (K) Forecast, by Application 2020 & 2033
- Table 47: Russia Ground Beef Revenue (undefined) Forecast, by Application 2020 & 2033
- Table 48: Russia Ground Beef Volume (K) Forecast, by Application 2020 & 2033
- Table 49: Benelux Ground Beef Revenue (undefined) Forecast, by Application 2020 & 2033
- Table 50: Benelux Ground Beef Volume (K) Forecast, by Application 2020 & 2033
- Table 51: Nordics Ground Beef Revenue (undefined) Forecast, by Application 2020 & 2033
- Table 52: Nordics Ground Beef Volume (K) Forecast, by Application 2020 & 2033
- Table 53: Rest of Europe Ground Beef Revenue (undefined) Forecast, by Application 2020 & 2033
- Table 54: Rest of Europe Ground Beef Volume (K) Forecast, by Application 2020 & 2033
- Table 55: Global Ground Beef Revenue undefined Forecast, by Application 2020 & 2033
- Table 56: Global Ground Beef Volume K Forecast, by Application 2020 & 2033
- Table 57: Global Ground Beef Revenue undefined Forecast, by Type 2020 & 2033
- Table 58: Global Ground Beef Volume K Forecast, by Type 2020 & 2033
- Table 59: Global Ground Beef Revenue undefined Forecast, by Country 2020 & 2033
- Table 60: Global Ground Beef Volume K Forecast, by Country 2020 & 2033
- Table 61: Turkey Ground Beef Revenue (undefined) Forecast, by Application 2020 & 2033
- Table 62: Turkey Ground Beef Volume (K) Forecast, by Application 2020 & 2033
- Table 63: Israel Ground Beef Revenue (undefined) Forecast, by Application 2020 & 2033
- Table 64: Israel Ground Beef Volume (K) Forecast, by Application 2020 & 2033
- Table 65: GCC Ground Beef Revenue (undefined) Forecast, by Application 2020 & 2033
- Table 66: GCC Ground Beef Volume (K) Forecast, by Application 2020 & 2033
- Table 67: North Africa Ground Beef Revenue (undefined) Forecast, by Application 2020 & 2033
- Table 68: North Africa Ground Beef Volume (K) Forecast, by Application 2020 & 2033
- Table 69: South Africa Ground Beef Revenue (undefined) Forecast, by Application 2020 & 2033
- Table 70: South Africa Ground Beef Volume (K) Forecast, by Application 2020 & 2033
- Table 71: Rest of Middle East & Africa Ground Beef Revenue (undefined) Forecast, by Application 2020 & 2033
- Table 72: Rest of Middle East & Africa Ground Beef Volume (K) Forecast, by Application 2020 & 2033
- Table 73: Global Ground Beef Revenue undefined Forecast, by Application 2020 & 2033
- Table 74: Global Ground Beef Volume K Forecast, by Application 2020 & 2033
- Table 75: Global Ground Beef Revenue undefined Forecast, by Type 2020 & 2033
- Table 76: Global Ground Beef Volume K Forecast, by Type 2020 & 2033
- Table 77: Global Ground Beef Revenue undefined Forecast, by Country 2020 & 2033
- Table 78: Global Ground Beef Volume K Forecast, by Country 2020 & 2033
- Table 79: China Ground Beef Revenue (undefined) Forecast, by Application 2020 & 2033
- Table 80: China Ground Beef Volume (K) Forecast, by Application 2020 & 2033
- Table 81: India Ground Beef Revenue (undefined) Forecast, by Application 2020 & 2033
- Table 82: India Ground Beef Volume (K) Forecast, by Application 2020 & 2033
- Table 83: Japan Ground Beef Revenue (undefined) Forecast, by Application 2020 & 2033
- Table 84: Japan Ground Beef Volume (K) Forecast, by Application 2020 & 2033
- Table 85: South Korea Ground Beef Revenue (undefined) Forecast, by Application 2020 & 2033
- Table 86: South Korea Ground Beef Volume (K) Forecast, by Application 2020 & 2033
- Table 87: ASEAN Ground Beef Revenue (undefined) Forecast, by Application 2020 & 2033
- Table 88: ASEAN Ground Beef Volume (K) Forecast, by Application 2020 & 2033
- Table 89: Oceania Ground Beef Revenue (undefined) Forecast, by Application 2020 & 2033
- Table 90: Oceania Ground Beef Volume (K) Forecast, by Application 2020 & 2033
- Table 91: Rest of Asia Pacific Ground Beef Revenue (undefined) Forecast, by Application 2020 & 2033
- Table 92: Rest of Asia Pacific Ground Beef Volume (K) Forecast, by Application 2020 & 2033
Frequently Asked Questions
1. What is the projected Compound Annual Growth Rate (CAGR) of the Ground Beef?
The projected CAGR is approximately 5.5%.
2. Which companies are prominent players in the Ground Beef?
Key companies in the market include Tyson Foods Inc., JBS USA Holdings Inc., Cargill Meat Solutions Corp., OSI Group LLC, Hormel Foods Corp., SYSCO Corp., National Beef Packing Co. LLC, American Foods Group LLC, Keystone Foods LLC, Greater Omaha Packing, CTI Foods LLC, Wolverine Packing Co., Agri Beef Co., West Liberty Foods LLC, Kenosha Beef International Ltd..
3. What are the main segments of the Ground Beef?
The market segments include Application, Type.
4. Can you provide details about the market size?
The market size is estimated to be USD XXX N/A as of 2022.
5. What are some drivers contributing to market growth?
N/A
6. What are the notable trends driving market growth?
N/A
7. Are there any restraints impacting market growth?
N/A
8. Can you provide examples of recent developments in the market?
N/A
9. What pricing options are available for accessing the report?
Pricing options include single-user, multi-user, and enterprise licenses priced at USD 3950.00, USD 5925.00, and USD 7900.00 respectively.
10. Is the market size provided in terms of value or volume?
The market size is provided in terms of value, measured in N/A and volume, measured in K.
11. Are there any specific market keywords associated with the report?
Yes, the market keyword associated with the report is "Ground Beef," which aids in identifying and referencing the specific market segment covered.
12. How do I determine which pricing option suits my needs best?
The pricing options vary based on user requirements and access needs. Individual users may opt for single-user licenses, while businesses requiring broader access may choose multi-user or enterprise licenses for cost-effective access to the report.
13. Are there any additional resources or data provided in the Ground Beef report?
While the report offers comprehensive insights, it's advisable to review the specific contents or supplementary materials provided to ascertain if additional resources or data are available.
14. How can I stay updated on further developments or reports in the Ground Beef?
To stay informed about further developments, trends, and reports in the Ground Beef, consider subscribing to industry newsletters, following relevant companies and organizations, or regularly checking reputable industry news sources and publications.
Methodology
Step 1 - Identification of Relevant Samples Size from Population Database


Step 2 - Approaches for Defining Global Market Size (Value, Volume* & Price*)

Note*: In applicable scenarios
Step 3 - Data Sources
Primary Research
- Web Analytics
- Survey Reports
- Research Institute
- Latest Research Reports
- Opinion Leaders
Secondary Research
- Annual Reports
- White Paper
- Latest Press Release
- Industry Association
- Paid Database
- Investor Presentations

Step 4 - Data Triangulation
Involves using different sources of information in order to increase the validity of a study
These sources are likely to be stakeholders in a program - participants, other researchers, program staff, other community members, and so on.
Then we put all data in single framework & apply various statistical tools to find out the dynamic on the market.
During the analysis stage, feedback from the stakeholder groups would be compared to determine areas of agreement as well as areas of divergence