

Key Insights
The global chicken health market, encompassing vaccines, parasiticides, anti-infectives, medical feed additives, and diagnostic tests, is poised for significant expansion. Driven by escalating poultry consumption and a heightened emphasis on animal welfare, the market is projected to reach $316.77 billion by 2025, growing at a compound annual growth rate (CAGR) of 2.8% from 2025 to 2033. Key growth drivers include the increasing incidence of poultry diseases, necessitating effective preventive and curative solutions, and advancements in diagnostic technologies like ELISA and PCR for rapid and accurate disease detection. Prophylactic measures in intensive poultry farming also contribute, aiming to optimize yield and mitigate economic losses from outbreaks. Stringent animal health and food safety regulations further boost demand for high-quality, safe, and efficacious chicken health products. Market segmentation highlights a strong preference for vaccines and ELISA tests, reflecting a proactive approach to disease management. Leading companies such as Elanco, Boehringer Ingelheim, IDEXX Laboratories, and Zoetis are spearheading innovation and competition. The Asia-Pacific region demonstrates robust growth, attributed to its expanding poultry industry and rising consumer demand for poultry products.
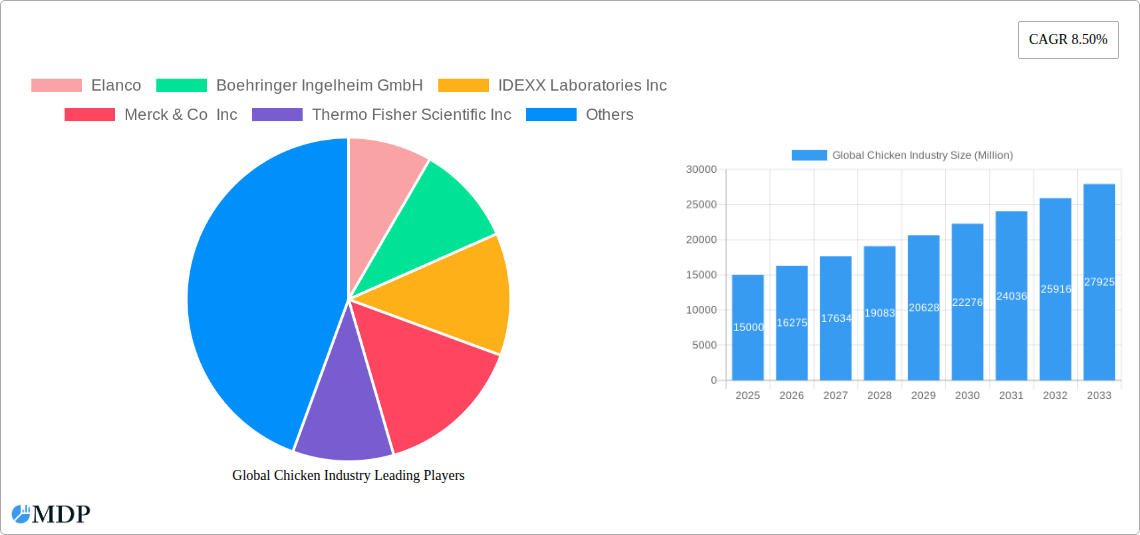
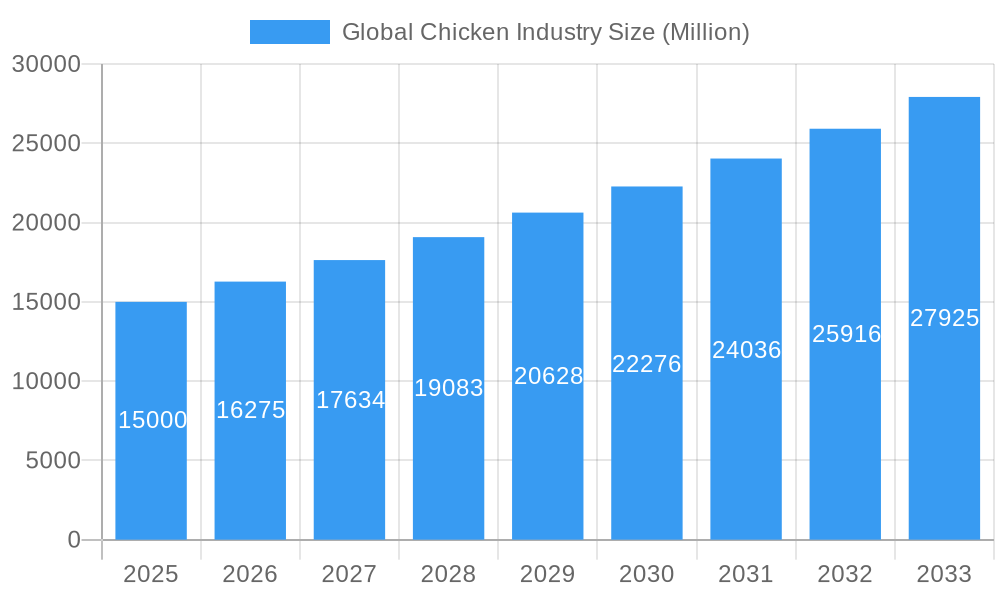
Global Chicken Industry Market Size (In Billion)
Despite positive trends, the market faces challenges including fluctuating raw material costs, rigorous regulatory approvals for new products, and the emergence of novel, drug-resistant poultry diseases. Continuous innovation and R&D investment are essential for sustained competitiveness and meeting evolving industry demands. The future trajectory will be shaped by an ongoing focus on biosecurity and sustainable poultry farming practices. Molecular diagnostic tests, noted for their superior sensitivity and specificity, and novel anti-infectives to combat emerging drug-resistant pathogens, represent high-growth segments. Industry consolidation is also anticipated, leading to a more competitive landscape.
Global Chicken Industry Company Market Share
Global Chicken Industry Report: 2019-2033 Forecast
Dive deep into the dynamic world of the global chicken industry with this comprehensive report, covering market dynamics, leading players, emerging trends, and future growth potential. This in-depth analysis, covering the period 2019-2033, provides actionable insights for stakeholders across the entire value chain.
Global Chicken Industry Market Dynamics & Concentration
This section analyzes the competitive landscape of the global chicken industry, focusing on market concentration, innovation drivers, regulatory frameworks, product substitutes, end-user trends, and mergers & acquisitions (M&A) activities. The study period spans from 2019 to 2033, with 2025 serving as both the base and estimated year.
The market exhibits a moderately concentrated structure, with a few key players holding significant market share. The top 5 companies collectively account for approximately xx% of the global market. Innovation is driven by the constant need to improve disease prevention, enhance productivity, and meet evolving consumer preferences for safe and ethically produced chicken. Stringent regulatory frameworks regarding animal health and welfare significantly impact market dynamics. The prevalence of various diseases and the need for effective diagnostics and treatment drives demand. Substitute products such as alternative protein sources exert some competitive pressure, but the established dominance of chicken remains strong. The M&A landscape displays steady activity, with xx major deals recorded between 2019 and 2024, indicating consolidation within the industry.
- Market Concentration: Top 5 players hold xx% market share.
- Innovation Drivers: Disease prevention, productivity enhancement, consumer preferences.
- Regulatory Frameworks: Stringent regulations impacting animal health, welfare, and product safety.
- Product Substitutes: Alternative protein sources pose moderate competitive pressure.
- End-User Trends: Increasing demand for affordable, safe, and ethically sourced chicken.
- M&A Activities: xx major deals between 2019 and 2024.
Global Chicken Industry Industry Trends & Analysis
This section explores key trends shaping the global chicken industry, including market growth drivers, technological advancements, consumer preferences, and competitive dynamics. The compound annual growth rate (CAGR) during the forecast period (2025-2033) is estimated at xx%. Market penetration of advanced diagnostic tools and disease prevention technologies continues to increase, leading to improved flock health and overall efficiency. Consumer demand for high-quality, affordable chicken remains a major growth driver. The industry witnesses intense competition, with companies focusing on product innovation, efficient production methods, and global expansion strategies to capture market share. The changing dietary habits of consumers, such as the increasing popularity of plant-based alternatives, presents a challenge but also an opportunity to innovate and adapt.
Leading Markets & Segments in Global Chicken Industry
This section identifies dominant regions, countries, and segments within the global chicken industry. The analysis covers both product types (Vaccines, Parasiticides, Anti-infectives, Medical Feed Additives, Other Product Types) and test types (ELISA, PCR, Molecular Diagnostic Tests, Other Test Types).
Dominant Regions/Countries: [Insert Dominant Region/Country and rationale for dominance, approx. 200 words. Example: Asia is projected to be the leading region due to high population density, increasing per capita income, and rising demand for animal protein. Within Asia, China and India stand out, driven by factors such as… ]
Dominant Segments (By Product Type):
- Vaccines: High demand due to the prevalence of avian diseases.
- Parasiticides: Essential for controlling parasitic infections impacting chicken health.
- Anti-infectives: Addressing bacterial and viral infections in poultry.
- Medical Feed Additives: Improving feed efficiency and overall animal health.
Dominant Segments (By Test Type):
- ELISA Tests: Widely used due to cost-effectiveness and relative simplicity.
- PCR Tests: Providing highly accurate and specific diagnostic results.
- Molecular Diagnostic Tests: Advancements in technology driving increased adoption.
Key Drivers:
- Economic Policies: Government support for poultry farming, infrastructure development.
- Infrastructure: Availability of efficient transportation, processing, and cold chain facilities.
Global Chicken Industry Product Developments
Recent years have witnessed significant product innovations in the chicken industry, particularly in disease diagnostics and prevention. Advancements in vaccine technology, the development of more effective parasiticides, and the emergence of novel anti-infectives are enhancing animal health and productivity. The introduction of rapid diagnostic tests allows for faster disease detection and improved biosecurity measures. These innovations contribute to reduced mortality rates, improved feed conversion ratios, and ultimately, increased profitability for poultry farmers.
Key Drivers of Global Chicken Industry Growth
The global chicken industry's growth is fueled by several factors. Firstly, the rising global population and increasing demand for protein sources drive consumption. Secondly, technological advancements in breeding, farming, and processing enhance efficiency and productivity. Favorable economic policies in many developing countries encourage investment in poultry farming. Finally, consistent research and development efforts lead to the development of newer and effective disease prevention strategies, ensuring improved bird health and increased production.
Challenges in the Global Chicken Industry Market
The global chicken industry faces significant challenges. Outbreaks of avian influenza and other diseases can severely disrupt production and trade. Fluctuations in feed prices and the availability of raw materials impact profitability. Stringent regulations and environmental concerns impose compliance costs. Furthermore, intensifying competition and the emergence of alternative protein sources create pricing pressure and necessitate ongoing innovation. These combined challenges necessitate robust risk management strategies and a proactive approach to adapt to changing market dynamics.
Emerging Opportunities in Global Chicken Industry
The chicken industry presents considerable long-term growth opportunities. Technological advancements, such as precision farming techniques and automation, will improve efficiency and reduce costs. Strategic partnerships between producers, processors, and retailers can optimize the supply chain and enhance product traceability. Expanding into new markets, particularly in developing economies, offers significant potential for growth.
Leading Players in the Global Chicken Industry Sector
- Elanco
- Boehringer Ingelheim GmbH
- IDEXX Laboratories Inc
- Merck & Co Inc
- Thermo Fisher Scientific Inc
- Megacor Diagnostik GmbH
- Provet Pharma Private Limited
- Bimeda Inc
- Ceva Sante Animale
- Indovax
- Zoetis Inc
- Hester Biosciences Limited
Key Milestones in Global Chicken Industry Industry
- May 2022: Canada invests over USD 3 Million in projects to enhance emergency management and disease outbreak mitigation strategies for the livestock and poultry industries.
- April 2022: Ceva Animal Health launches CEVAC IBird, a live attenuated freeze-dried vaccine for avian infectious bronchitis virus in India.
Strategic Outlook for Global Chicken Industry Market
The global chicken industry is poised for continued growth, driven by rising demand and technological advancements. Strategic investments in disease prevention, sustainable farming practices, and innovative product development will be crucial for success. Companies that focus on efficiency, traceability, and consumer preferences will be best positioned to capitalize on emerging opportunities and navigate industry challenges effectively. The long-term potential of the market remains robust, presenting significant opportunities for investors and industry players alike.
Global Chicken Industry Segmentation
-
1. Product Type
- 1.1. Vaccines
- 1.2. Parasiticides
- 1.3. Anti Infectives
- 1.4. Medical Feed Additives
- 1.5. Other Product Types
-
2. Test Type
- 2.1. ELISA (Enzyme-Linked Immunosorbent Assay) Test
- 2.2. PCR (Polymerase Chain Reaction) Test
- 2.3. Molecular Diagnostic Test
- 2.4. Other Test Types
Global Chicken Industry Segmentation By Geography
-
1. North America
- 1.1. United States
- 1.2. Canada
- 1.3. Mexico
-
2. Europe
- 2.1. Germany
- 2.2. United Kingdom
- 2.3. France
- 2.4. Italy
- 2.5. Spain
- 2.6. Rest of Europe
-
3. Asia Pacific
- 3.1. China
- 3.2. Japan
- 3.3. India
- 3.4. Australia
- 3.5. South Korea
- 3.6. Rest of Asia Pacific
-
4. Middle East and Africa
- 4.1. GCC
- 4.2. South Africa
- 4.3. Rest of Middle East and Africa
-
5. South America
- 5.1. Brazil
- 5.2. Argentina
- 5.3. Rest of South America
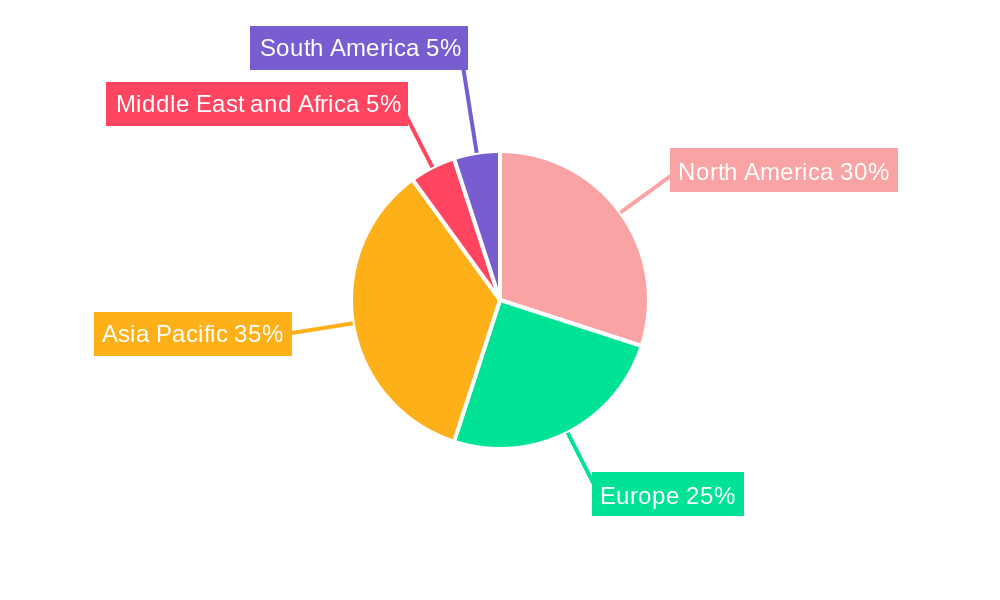
Global Chicken Industry Regional Market Share
Geographic Coverage of Global Chicken Industry
Global Chicken Industry REPORT HIGHLIGHTS
| Aspects | Details |
|---|---|
| Study Period | 2020-2034 |
| Base Year | 2025 |
| Estimated Year | 2026 |
| Forecast Period | 2026-2034 |
| Historical Period | 2020-2025 |
| Growth Rate | CAGR of 2.8% from 2020-2034 |
| Segmentation |
|
Table of Contents
- 1. Introduction
- 1.1. Research Scope
- 1.2. Market Segmentation
- 1.3. Research Objective
- 1.4. Definitions and Assumptions
- 2. Executive Summary
- 2.1. Market Snapshot
- 3. Market Dynamics
- 3.1. Market Drivers
- 3.2. Market Restrains
- 3.3. Market Trends
- 3.4. Market Opportunities
- 4. Market Factor Analysis
- 4.1. Porters Five Forces
- 4.1.1. Bargaining Power of Suppliers
- 4.1.2. Bargaining Power of Buyers
- 4.1.3. Threat of New Entrants
- 4.1.4. Threat of Substitutes
- 4.1.5. Competitive Rivalry
- 4.2. PESTEL analysis
- 4.3. BCG Analysis
- 4.3.1. Stars (High Growth, High Market Share)
- 4.3.2. Cash Cows (Low Growth, High Market Share)
- 4.3.3. Question Mark (High Growth, Low Market Share)
- 4.3.4. Dogs (Low Growth, Low Market Share)
- 4.4. Ansoff Matrix Analysis
- 4.5. Supply Chain Analysis
- 4.6. Regulatory Landscape
- 4.7. Current Market Potential and Opportunity Assessment (TAM–SAM–SOM Framework)
- 4.8. MDP Analyst Note
- 4.1. Porters Five Forces
- 5. Market Analysis, Insights and Forecast 2021-2033
- 5.1. Market Analysis, Insights and Forecast - by Product Type
- 5.1.1. Vaccines
- 5.1.2. Parasiticides
- 5.1.3. Anti Infectives
- 5.1.4. Medical Feed Additives
- 5.1.5. Other Product Types
- 5.2. Market Analysis, Insights and Forecast - by Test Type
- 5.2.1. ELISA (Enzyme-Linked Immunosorbent Assay) Test
- 5.2.2. PCR (Polymerase Chain Reaction) Test
- 5.2.3. Molecular Diagnostic Test
- 5.2.4. Other Test Types
- 5.3. Market Analysis, Insights and Forecast - by Region
- 5.3.1. North America
- 5.3.2. Europe
- 5.3.3. Asia Pacific
- 5.3.4. Middle East and Africa
- 5.3.5. South America
- 5.1. Market Analysis, Insights and Forecast - by Product Type
- 6. Global Chicken Industry Analysis, Insights and Forecast, 2021-2033
- 6.1. Market Analysis, Insights and Forecast - by Product Type
- 6.1.1. Vaccines
- 6.1.2. Parasiticides
- 6.1.3. Anti Infectives
- 6.1.4. Medical Feed Additives
- 6.1.5. Other Product Types
- 6.2. Market Analysis, Insights and Forecast - by Test Type
- 6.2.1. ELISA (Enzyme-Linked Immunosorbent Assay) Test
- 6.2.2. PCR (Polymerase Chain Reaction) Test
- 6.2.3. Molecular Diagnostic Test
- 6.2.4. Other Test Types
- 6.1. Market Analysis, Insights and Forecast - by Product Type
- 7. North America Global Chicken Industry Analysis, Insights and Forecast, 2020-2032
- 7.1. Market Analysis, Insights and Forecast - by Product Type
- 7.1.1. Vaccines
- 7.1.2. Parasiticides
- 7.1.3. Anti Infectives
- 7.1.4. Medical Feed Additives
- 7.1.5. Other Product Types
- 7.2. Market Analysis, Insights and Forecast - by Test Type
- 7.2.1. ELISA (Enzyme-Linked Immunosorbent Assay) Test
- 7.2.2. PCR (Polymerase Chain Reaction) Test
- 7.2.3. Molecular Diagnostic Test
- 7.2.4. Other Test Types
- 7.1. Market Analysis, Insights and Forecast - by Product Type
- 8. Europe Global Chicken Industry Analysis, Insights and Forecast, 2020-2032
- 8.1. Market Analysis, Insights and Forecast - by Product Type
- 8.1.1. Vaccines
- 8.1.2. Parasiticides
- 8.1.3. Anti Infectives
- 8.1.4. Medical Feed Additives
- 8.1.5. Other Product Types
- 8.2. Market Analysis, Insights and Forecast - by Test Type
- 8.2.1. ELISA (Enzyme-Linked Immunosorbent Assay) Test
- 8.2.2. PCR (Polymerase Chain Reaction) Test
- 8.2.3. Molecular Diagnostic Test
- 8.2.4. Other Test Types
- 8.1. Market Analysis, Insights and Forecast - by Product Type
- 9. Asia Pacific Global Chicken Industry Analysis, Insights and Forecast, 2020-2032
- 9.1. Market Analysis, Insights and Forecast - by Product Type
- 9.1.1. Vaccines
- 9.1.2. Parasiticides
- 9.1.3. Anti Infectives
- 9.1.4. Medical Feed Additives
- 9.1.5. Other Product Types
- 9.2. Market Analysis, Insights and Forecast - by Test Type
- 9.2.1. ELISA (Enzyme-Linked Immunosorbent Assay) Test
- 9.2.2. PCR (Polymerase Chain Reaction) Test
- 9.2.3. Molecular Diagnostic Test
- 9.2.4. Other Test Types
- 9.1. Market Analysis, Insights and Forecast - by Product Type
- 10. Middle East and Africa Global Chicken Industry Analysis, Insights and Forecast, 2020-2032
- 10.1. Market Analysis, Insights and Forecast - by Product Type
- 10.1.1. Vaccines
- 10.1.2. Parasiticides
- 10.1.3. Anti Infectives
- 10.1.4. Medical Feed Additives
- 10.1.5. Other Product Types
- 10.2. Market Analysis, Insights and Forecast - by Test Type
- 10.2.1. ELISA (Enzyme-Linked Immunosorbent Assay) Test
- 10.2.2. PCR (Polymerase Chain Reaction) Test
- 10.2.3. Molecular Diagnostic Test
- 10.2.4. Other Test Types
- 10.1. Market Analysis, Insights and Forecast - by Product Type
- 11. South America Global Chicken Industry Analysis, Insights and Forecast, 2020-2032
- 11.1. Market Analysis, Insights and Forecast - by Product Type
- 11.1.1. Vaccines
- 11.1.2. Parasiticides
- 11.1.3. Anti Infectives
- 11.1.4. Medical Feed Additives
- 11.1.5. Other Product Types
- 11.2. Market Analysis, Insights and Forecast - by Test Type
- 11.2.1. ELISA (Enzyme-Linked Immunosorbent Assay) Test
- 11.2.2. PCR (Polymerase Chain Reaction) Test
- 11.2.3. Molecular Diagnostic Test
- 11.2.4. Other Test Types
- 11.1. Market Analysis, Insights and Forecast - by Product Type
- 12. Competitive Analysis
- 12.1. Company Profiles
- 12.1.1 Elanco
- 12.1.1.1. Company Overview
- 12.1.1.2. Products
- 12.1.1.3. Company Financials
- 12.1.1.4. SWOT Analysis
- 12.1.2 Boehringer Ingelheim GmbH
- 12.1.2.1. Company Overview
- 12.1.2.2. Products
- 12.1.2.3. Company Financials
- 12.1.2.4. SWOT Analysis
- 12.1.3 IDEXX Laboratories Inc
- 12.1.3.1. Company Overview
- 12.1.3.2. Products
- 12.1.3.3. Company Financials
- 12.1.3.4. SWOT Analysis
- 12.1.4 Merck & Co Inc
- 12.1.4.1. Company Overview
- 12.1.4.2. Products
- 12.1.4.3. Company Financials
- 12.1.4.4. SWOT Analysis
- 12.1.5 Thermo Fisher Scientific Inc
- 12.1.5.1. Company Overview
- 12.1.5.2. Products
- 12.1.5.3. Company Financials
- 12.1.5.4. SWOT Analysis
- 12.1.6 Megacor Diagnostik GmbH
- 12.1.6.1. Company Overview
- 12.1.6.2. Products
- 12.1.6.3. Company Financials
- 12.1.6.4. SWOT Analysis
- 12.1.7 Provet Pharma Private Limited
- 12.1.7.1. Company Overview
- 12.1.7.2. Products
- 12.1.7.3. Company Financials
- 12.1.7.4. SWOT Analysis
- 12.1.8 Bimeda Inc
- 12.1.8.1. Company Overview
- 12.1.8.2. Products
- 12.1.8.3. Company Financials
- 12.1.8.4. SWOT Analysis
- 12.1.9 Ceva Sante Animale
- 12.1.9.1. Company Overview
- 12.1.9.2. Products
- 12.1.9.3. Company Financials
- 12.1.9.4. SWOT Analysis
- 12.1.10 Indovax
- 12.1.10.1. Company Overview
- 12.1.10.2. Products
- 12.1.10.3. Company Financials
- 12.1.10.4. SWOT Analysis
- 12.1.11 Zoetis Inc
- 12.1.11.1. Company Overview
- 12.1.11.2. Products
- 12.1.11.3. Company Financials
- 12.1.11.4. SWOT Analysis
- 12.1.12 Hester Biosciences Limited
- 12.1.12.1. Company Overview
- 12.1.12.2. Products
- 12.1.12.3. Company Financials
- 12.1.12.4. SWOT Analysis
- 12.1.1 Elanco
- 12.2. Market Entropy
- 12.2.1 Company's Key Areas Served
- 12.2.2 Recent Developments
- 12.3. Company Market Share Analysis 2025
- 12.3.1 Top 5 Companies Market Share Analysis
- 12.3.2 Top 3 Companies Market Share Analysis
- 12.4. List of Potential Customers
- 13. Research Methodology
List of Figures
- Figure 1: Global Global Chicken Industry Revenue Breakdown (billion, %) by Region 2025 & 2033
- Figure 2: Global Global Chicken Industry Volume Breakdown (K Unit, %) by Region 2025 & 2033
- Figure 3: North America Global Chicken Industry Revenue (billion), by Product Type 2025 & 2033
- Figure 4: North America Global Chicken Industry Volume (K Unit), by Product Type 2025 & 2033
- Figure 5: North America Global Chicken Industry Revenue Share (%), by Product Type 2025 & 2033
- Figure 6: North America Global Chicken Industry Volume Share (%), by Product Type 2025 & 2033
- Figure 7: North America Global Chicken Industry Revenue (billion), by Test Type 2025 & 2033
- Figure 8: North America Global Chicken Industry Volume (K Unit), by Test Type 2025 & 2033
- Figure 9: North America Global Chicken Industry Revenue Share (%), by Test Type 2025 & 2033
- Figure 10: North America Global Chicken Industry Volume Share (%), by Test Type 2025 & 2033
- Figure 11: North America Global Chicken Industry Revenue (billion), by Country 2025 & 2033
- Figure 12: North America Global Chicken Industry Volume (K Unit), by Country 2025 & 2033
- Figure 13: North America Global Chicken Industry Revenue Share (%), by Country 2025 & 2033
- Figure 14: North America Global Chicken Industry Volume Share (%), by Country 2025 & 2033
- Figure 15: Europe Global Chicken Industry Revenue (billion), by Product Type 2025 & 2033
- Figure 16: Europe Global Chicken Industry Volume (K Unit), by Product Type 2025 & 2033
- Figure 17: Europe Global Chicken Industry Revenue Share (%), by Product Type 2025 & 2033
- Figure 18: Europe Global Chicken Industry Volume Share (%), by Product Type 2025 & 2033
- Figure 19: Europe Global Chicken Industry Revenue (billion), by Test Type 2025 & 2033
- Figure 20: Europe Global Chicken Industry Volume (K Unit), by Test Type 2025 & 2033
- Figure 21: Europe Global Chicken Industry Revenue Share (%), by Test Type 2025 & 2033
- Figure 22: Europe Global Chicken Industry Volume Share (%), by Test Type 2025 & 2033
- Figure 23: Europe Global Chicken Industry Revenue (billion), by Country 2025 & 2033
- Figure 24: Europe Global Chicken Industry Volume (K Unit), by Country 2025 & 2033
- Figure 25: Europe Global Chicken Industry Revenue Share (%), by Country 2025 & 2033
- Figure 26: Europe Global Chicken Industry Volume Share (%), by Country 2025 & 2033
- Figure 27: Asia Pacific Global Chicken Industry Revenue (billion), by Product Type 2025 & 2033
- Figure 28: Asia Pacific Global Chicken Industry Volume (K Unit), by Product Type 2025 & 2033
- Figure 29: Asia Pacific Global Chicken Industry Revenue Share (%), by Product Type 2025 & 2033
- Figure 30: Asia Pacific Global Chicken Industry Volume Share (%), by Product Type 2025 & 2033
- Figure 31: Asia Pacific Global Chicken Industry Revenue (billion), by Test Type 2025 & 2033
- Figure 32: Asia Pacific Global Chicken Industry Volume (K Unit), by Test Type 2025 & 2033
- Figure 33: Asia Pacific Global Chicken Industry Revenue Share (%), by Test Type 2025 & 2033
- Figure 34: Asia Pacific Global Chicken Industry Volume Share (%), by Test Type 2025 & 2033
- Figure 35: Asia Pacific Global Chicken Industry Revenue (billion), by Country 2025 & 2033
- Figure 36: Asia Pacific Global Chicken Industry Volume (K Unit), by Country 2025 & 2033
- Figure 37: Asia Pacific Global Chicken Industry Revenue Share (%), by Country 2025 & 2033
- Figure 38: Asia Pacific Global Chicken Industry Volume Share (%), by Country 2025 & 2033
- Figure 39: Middle East and Africa Global Chicken Industry Revenue (billion), by Product Type 2025 & 2033
- Figure 40: Middle East and Africa Global Chicken Industry Volume (K Unit), by Product Type 2025 & 2033
- Figure 41: Middle East and Africa Global Chicken Industry Revenue Share (%), by Product Type 2025 & 2033
- Figure 42: Middle East and Africa Global Chicken Industry Volume Share (%), by Product Type 2025 & 2033
- Figure 43: Middle East and Africa Global Chicken Industry Revenue (billion), by Test Type 2025 & 2033
- Figure 44: Middle East and Africa Global Chicken Industry Volume (K Unit), by Test Type 2025 & 2033
- Figure 45: Middle East and Africa Global Chicken Industry Revenue Share (%), by Test Type 2025 & 2033
- Figure 46: Middle East and Africa Global Chicken Industry Volume Share (%), by Test Type 2025 & 2033
- Figure 47: Middle East and Africa Global Chicken Industry Revenue (billion), by Country 2025 & 2033
- Figure 48: Middle East and Africa Global Chicken Industry Volume (K Unit), by Country 2025 & 2033
- Figure 49: Middle East and Africa Global Chicken Industry Revenue Share (%), by Country 2025 & 2033
- Figure 50: Middle East and Africa Global Chicken Industry Volume Share (%), by Country 2025 & 2033
- Figure 51: South America Global Chicken Industry Revenue (billion), by Product Type 2025 & 2033
- Figure 52: South America Global Chicken Industry Volume (K Unit), by Product Type 2025 & 2033
- Figure 53: South America Global Chicken Industry Revenue Share (%), by Product Type 2025 & 2033
- Figure 54: South America Global Chicken Industry Volume Share (%), by Product Type 2025 & 2033
- Figure 55: South America Global Chicken Industry Revenue (billion), by Test Type 2025 & 2033
- Figure 56: South America Global Chicken Industry Volume (K Unit), by Test Type 2025 & 2033
- Figure 57: South America Global Chicken Industry Revenue Share (%), by Test Type 2025 & 2033
- Figure 58: South America Global Chicken Industry Volume Share (%), by Test Type 2025 & 2033
- Figure 59: South America Global Chicken Industry Revenue (billion), by Country 2025 & 2033
- Figure 60: South America Global Chicken Industry Volume (K Unit), by Country 2025 & 2033
- Figure 61: South America Global Chicken Industry Revenue Share (%), by Country 2025 & 2033
- Figure 62: South America Global Chicken Industry Volume Share (%), by Country 2025 & 2033
List of Tables
- Table 1: Global Chicken Industry Revenue billion Forecast, by Product Type 2020 & 2033
- Table 2: Global Chicken Industry Volume K Unit Forecast, by Product Type 2020 & 2033
- Table 3: Global Chicken Industry Revenue billion Forecast, by Test Type 2020 & 2033
- Table 4: Global Chicken Industry Volume K Unit Forecast, by Test Type 2020 & 2033
- Table 5: Global Chicken Industry Revenue billion Forecast, by Region 2020 & 2033
- Table 6: Global Chicken Industry Volume K Unit Forecast, by Region 2020 & 2033
- Table 7: Global Chicken Industry Revenue billion Forecast, by Product Type 2020 & 2033
- Table 8: Global Chicken Industry Volume K Unit Forecast, by Product Type 2020 & 2033
- Table 9: Global Chicken Industry Revenue billion Forecast, by Test Type 2020 & 2033
- Table 10: Global Chicken Industry Volume K Unit Forecast, by Test Type 2020 & 2033
- Table 11: Global Chicken Industry Revenue billion Forecast, by Country 2020 & 2033
- Table 12: Global Chicken Industry Volume K Unit Forecast, by Country 2020 & 2033
- Table 13: United States Global Chicken Industry Revenue (billion) Forecast, by Application 2020 & 2033
- Table 14: United States Global Chicken Industry Volume (K Unit) Forecast, by Application 2020 & 2033
- Table 15: Canada Global Chicken Industry Revenue (billion) Forecast, by Application 2020 & 2033
- Table 16: Canada Global Chicken Industry Volume (K Unit) Forecast, by Application 2020 & 2033
- Table 17: Mexico Global Chicken Industry Revenue (billion) Forecast, by Application 2020 & 2033
- Table 18: Mexico Global Chicken Industry Volume (K Unit) Forecast, by Application 2020 & 2033
- Table 19: Global Chicken Industry Revenue billion Forecast, by Product Type 2020 & 2033
- Table 20: Global Chicken Industry Volume K Unit Forecast, by Product Type 2020 & 2033
- Table 21: Global Chicken Industry Revenue billion Forecast, by Test Type 2020 & 2033
- Table 22: Global Chicken Industry Volume K Unit Forecast, by Test Type 2020 & 2033
- Table 23: Global Chicken Industry Revenue billion Forecast, by Country 2020 & 2033
- Table 24: Global Chicken Industry Volume K Unit Forecast, by Country 2020 & 2033
- Table 25: Germany Global Chicken Industry Revenue (billion) Forecast, by Application 2020 & 2033
- Table 26: Germany Global Chicken Industry Volume (K Unit) Forecast, by Application 2020 & 2033
- Table 27: United Kingdom Global Chicken Industry Revenue (billion) Forecast, by Application 2020 & 2033
- Table 28: United Kingdom Global Chicken Industry Volume (K Unit) Forecast, by Application 2020 & 2033
- Table 29: France Global Chicken Industry Revenue (billion) Forecast, by Application 2020 & 2033
- Table 30: France Global Chicken Industry Volume (K Unit) Forecast, by Application 2020 & 2033
- Table 31: Italy Global Chicken Industry Revenue (billion) Forecast, by Application 2020 & 2033
- Table 32: Italy Global Chicken Industry Volume (K Unit) Forecast, by Application 2020 & 2033
- Table 33: Spain Global Chicken Industry Revenue (billion) Forecast, by Application 2020 & 2033
- Table 34: Spain Global Chicken Industry Volume (K Unit) Forecast, by Application 2020 & 2033
- Table 35: Rest of Europe Global Chicken Industry Revenue (billion) Forecast, by Application 2020 & 2033
- Table 36: Rest of Europe Global Chicken Industry Volume (K Unit) Forecast, by Application 2020 & 2033
- Table 37: Global Chicken Industry Revenue billion Forecast, by Product Type 2020 & 2033
- Table 38: Global Chicken Industry Volume K Unit Forecast, by Product Type 2020 & 2033
- Table 39: Global Chicken Industry Revenue billion Forecast, by Test Type 2020 & 2033
- Table 40: Global Chicken Industry Volume K Unit Forecast, by Test Type 2020 & 2033
- Table 41: Global Chicken Industry Revenue billion Forecast, by Country 2020 & 2033
- Table 42: Global Chicken Industry Volume K Unit Forecast, by Country 2020 & 2033
- Table 43: China Global Chicken Industry Revenue (billion) Forecast, by Application 2020 & 2033
- Table 44: China Global Chicken Industry Volume (K Unit) Forecast, by Application 2020 & 2033
- Table 45: Japan Global Chicken Industry Revenue (billion) Forecast, by Application 2020 & 2033
- Table 46: Japan Global Chicken Industry Volume (K Unit) Forecast, by Application 2020 & 2033
- Table 47: India Global Chicken Industry Revenue (billion) Forecast, by Application 2020 & 2033
- Table 48: India Global Chicken Industry Volume (K Unit) Forecast, by Application 2020 & 2033
- Table 49: Australia Global Chicken Industry Revenue (billion) Forecast, by Application 2020 & 2033
- Table 50: Australia Global Chicken Industry Volume (K Unit) Forecast, by Application 2020 & 2033
- Table 51: South Korea Global Chicken Industry Revenue (billion) Forecast, by Application 2020 & 2033
- Table 52: South Korea Global Chicken Industry Volume (K Unit) Forecast, by Application 2020 & 2033
- Table 53: Rest of Asia Pacific Global Chicken Industry Revenue (billion) Forecast, by Application 2020 & 2033
- Table 54: Rest of Asia Pacific Global Chicken Industry Volume (K Unit) Forecast, by Application 2020 & 2033
- Table 55: Global Chicken Industry Revenue billion Forecast, by Product Type 2020 & 2033
- Table 56: Global Chicken Industry Volume K Unit Forecast, by Product Type 2020 & 2033
- Table 57: Global Chicken Industry Revenue billion Forecast, by Test Type 2020 & 2033
- Table 58: Global Chicken Industry Volume K Unit Forecast, by Test Type 2020 & 2033
- Table 59: Global Chicken Industry Revenue billion Forecast, by Country 2020 & 2033
- Table 60: Global Chicken Industry Volume K Unit Forecast, by Country 2020 & 2033
- Table 61: GCC Global Chicken Industry Revenue (billion) Forecast, by Application 2020 & 2033
- Table 62: GCC Global Chicken Industry Volume (K Unit) Forecast, by Application 2020 & 2033
- Table 63: South Africa Global Chicken Industry Revenue (billion) Forecast, by Application 2020 & 2033
- Table 64: South Africa Global Chicken Industry Volume (K Unit) Forecast, by Application 2020 & 2033
- Table 65: Rest of Middle East and Africa Global Chicken Industry Revenue (billion) Forecast, by Application 2020 & 2033
- Table 66: Rest of Middle East and Africa Global Chicken Industry Volume (K Unit) Forecast, by Application 2020 & 2033
- Table 67: Global Chicken Industry Revenue billion Forecast, by Product Type 2020 & 2033
- Table 68: Global Chicken Industry Volume K Unit Forecast, by Product Type 2020 & 2033
- Table 69: Global Chicken Industry Revenue billion Forecast, by Test Type 2020 & 2033
- Table 70: Global Chicken Industry Volume K Unit Forecast, by Test Type 2020 & 2033
- Table 71: Global Chicken Industry Revenue billion Forecast, by Country 2020 & 2033
- Table 72: Global Chicken Industry Volume K Unit Forecast, by Country 2020 & 2033
- Table 73: Brazil Global Chicken Industry Revenue (billion) Forecast, by Application 2020 & 2033
- Table 74: Brazil Global Chicken Industry Volume (K Unit) Forecast, by Application 2020 & 2033
- Table 75: Argentina Global Chicken Industry Revenue (billion) Forecast, by Application 2020 & 2033
- Table 76: Argentina Global Chicken Industry Volume (K Unit) Forecast, by Application 2020 & 2033
- Table 77: Rest of South America Global Chicken Industry Revenue (billion) Forecast, by Application 2020 & 2033
- Table 78: Rest of South America Global Chicken Industry Volume (K Unit) Forecast, by Application 2020 & 2033
Frequently Asked Questions
1. What is the projected Compound Annual Growth Rate (CAGR) of the Global Chicken Industry?
The projected CAGR is approximately 2.8%.
2. Which companies are prominent players in the Global Chicken Industry?
Key companies in the market include Elanco, Boehringer Ingelheim GmbH, IDEXX Laboratories Inc, Merck & Co Inc, Thermo Fisher Scientific Inc, Megacor Diagnostik GmbH, Provet Pharma Private Limited, Bimeda Inc , Ceva Sante Animale, Indovax, Zoetis Inc, Hester Biosciences Limited.
3. What are the main segments of the Global Chicken Industry?
The market segments include Product Type, Test Type.
4. Can you provide details about the market size?
The market size is estimated to be USD 316.77 billion as of 2022.
5. What are some drivers contributing to market growth?
Increasing Initiatives by Government and Animal Welfare Associations; Rising Occurrence of Zoonotic Diseases; Rise in Demand for Poultry-derived Food Products.
6. What are the notable trends driving market growth?
The Vaccines Segment is Expected to Show Better Growth Over the Forecast Period.
7. Are there any restraints impacting market growth?
Use of Counterfeit Medicines; Lack of Veterinarians and Shortage of Skilled Farm Workers.
8. Can you provide examples of recent developments in the market?
In May 2022, Canada invested over USD 3 million in two projects to enhance emergency management and develop risk assessments and strategies to mitigate disease outbreaks. This project will help enhance the emergency management capabilities of Canada's livestock and poultry industries to remain ready in the face of adverse events and a continually evolving disease landscape.
9. What pricing options are available for accessing the report?
Pricing options include single-user, multi-user, and enterprise licenses priced at USD 4750, USD 5250, and USD 8750 respectively.
10. Is the market size provided in terms of value or volume?
The market size is provided in terms of value, measured in billion and volume, measured in K Unit.
11. Are there any specific market keywords associated with the report?
Yes, the market keyword associated with the report is "Global Chicken Industry," which aids in identifying and referencing the specific market segment covered.
12. How do I determine which pricing option suits my needs best?
The pricing options vary based on user requirements and access needs. Individual users may opt for single-user licenses, while businesses requiring broader access may choose multi-user or enterprise licenses for cost-effective access to the report.
13. Are there any additional resources or data provided in the Global Chicken Industry report?
While the report offers comprehensive insights, it's advisable to review the specific contents or supplementary materials provided to ascertain if additional resources or data are available.
14. How can I stay updated on further developments or reports in the Global Chicken Industry?
To stay informed about further developments, trends, and reports in the Global Chicken Industry, consider subscribing to industry newsletters, following relevant companies and organizations, or regularly checking reputable industry news sources and publications.
Methodology
Step 1 - Identification of Relevant Samples Size from Population Database


Step 2 - Approaches for Defining Global Market Size (Value, Volume* & Price*)

Note*: In applicable scenarios
Step 3 - Data Sources
Primary Research
- Web Analytics
- Survey Reports
- Research Institute
- Latest Research Reports
- Opinion Leaders
Secondary Research
- Annual Reports
- White Paper
- Latest Press Release
- Industry Association
- Paid Database
- Investor Presentations

Step 4 - Data Triangulation
Involves using different sources of information in order to increase the validity of a study
These sources are likely to be stakeholders in a program - participants, other researchers, program staff, other community members, and so on.
Then we put all data in single framework & apply various statistical tools to find out the dynamic on the market.
During the analysis stage, feedback from the stakeholder groups would be compared to determine areas of agreement as well as areas of divergence