

Key Insights
The global functional foods and beverages market, valued at $398.81 billion in 2025, is projected to grow at a compound annual growth rate (CAGR) of 7.8% from 2025 to 2033. This expansion is propelled by heightened consumer focus on health and wellness, driving demand for fortified products containing vitamins, minerals, and probiotics. The increasing incidence of chronic conditions like obesity and diabetes further stimulates the need for preventative dietary solutions. Key emerging trends, including personalized nutrition and the rise of plant-based and clean-label options, are significantly influencing market dynamics. While raw material price volatility and regulatory scrutiny of health claims present challenges, the market outlook remains robust. The broad product portfolio, spanning bakery, cereals, dairy, and snacks, supports market growth, complemented by diversified distribution channels such as online retail and specialist stores. Leading companies, including PepsiCo, Danone, Nestlé, and Kellogg's, are actively innovating to cater to evolving consumer preferences.
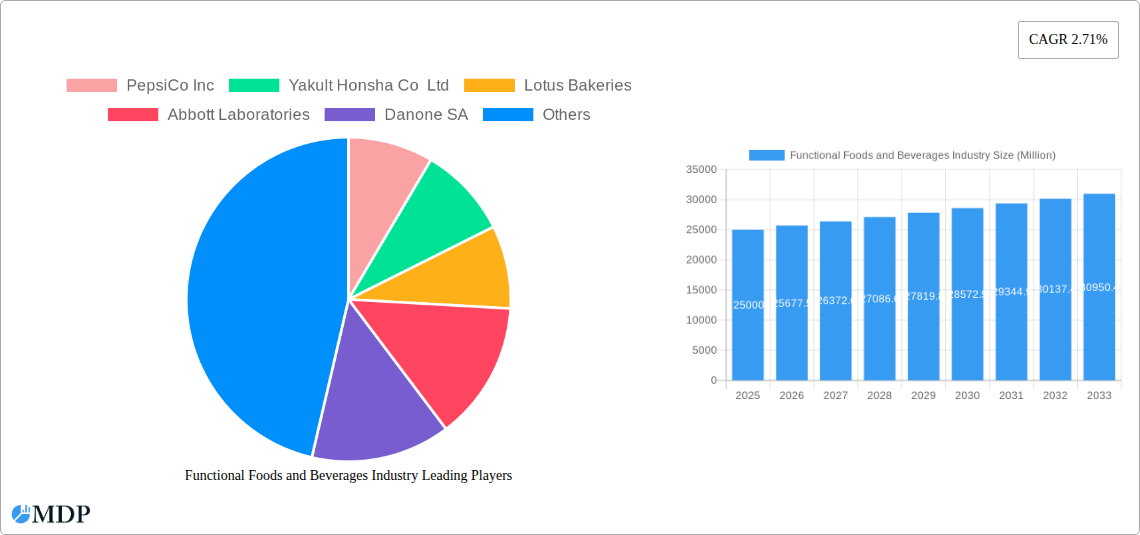
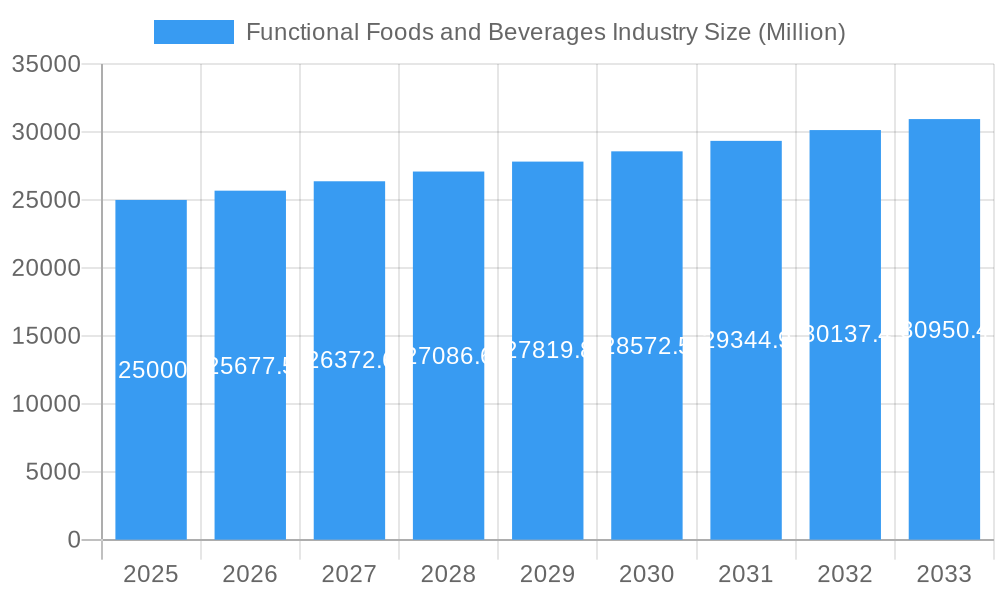
Functional Foods and Beverages Industry Market Size (In Billion)
Market segmentation highlights substantial opportunities across product types and distribution channels. Online retail's convenience is broadening consumer reach, while health-conscious consumers drive demand for organic and sustainable products in specialist outlets. Specific categories like protein bars and functional dairy products show strong growth, reflecting a focus on targeted health benefits. Geographically, North America and Europe currently lead, with Asia Pacific anticipated to experience significant growth due to rising disposable incomes and evolving dietary patterns. The expanding middle class in emerging economies further bolsters the functional foods and beverages market's growth trajectory. Continued innovation in sophisticated functional ingredients and the demand for personalized nutrition solutions present considerable potential for market expansion.
Functional Foods and Beverages Industry Company Market Share
Functional Foods and Beverages Industry: Market Report 2019-2033
This comprehensive report provides an in-depth analysis of the Functional Foods and Beverages industry, encompassing market dynamics, leading players, key trends, and future growth prospects from 2019 to 2033. With a focus on key segments like bakery products, breakfast cereals, and dairy products, and distribution channels including supermarkets and online retailers, this report is essential for industry stakeholders, investors, and market strategists. The report projects a market value of $XX Million by 2033, offering actionable insights and forecasts for informed decision-making.
Functional Foods and Beverages Industry Market Dynamics & Concentration
The functional foods and beverages market exhibits a moderately concentrated landscape, with several multinational giants holding significant market share. However, a considerable number of smaller, specialized players contribute significantly to innovation and niche market penetration. Market concentration is influenced by factors like brand recognition, distribution network reach, and R&D capabilities. Key players like PepsiCo Inc, Nestlé S.A., and Danone SA command substantial shares, while regional players and smaller innovative companies carve out niches in specific product segments. The market is dynamic, with ongoing mergers and acquisitions (M&A) activity reflecting consolidation trends. For the period 2019-2024, the average M&A deal count was approximately xx, indicating a moderate level of consolidation.
- Market Concentration: High for established product categories, moderate overall.
- Innovation Drivers: Consumer demand for health and wellness, technological advancements in food processing and formulation.
- Regulatory Frameworks: Varying regulations across regions influencing product labeling, claims, and ingredient usage.
- Product Substitutes: Competition from conventional food and beverage items depending on specific product types.
- End-User Trends: Growing awareness of health and wellness, demand for natural and organic products, increasing preference for convenience foods, and ethical and sustainable consumption patterns.
- M&A Activities: Moderate level of activity, driven by consolidation efforts by large players and expansion into new markets. The average market share of top 5 players during 2019-2024 was approximately xx%.
Functional Foods and Beverages Industry Industry Trends & Analysis
The functional foods and beverage market demonstrates robust growth, driven by a convergence of factors. The compound annual growth rate (CAGR) during the historical period (2019-2024) was approximately xx%, and is projected to be xx% for the forecast period (2025-2033). This growth is fueled by increasing consumer health awareness, rising disposable incomes in emerging markets, and technological advancements allowing for improved product formulations and enhanced shelf life. The market is experiencing a significant shift towards natural, organic, and plant-based products. Competition is intense, with both established players and innovative startups vying for market share. This has led to increased product diversification, focusing on specific health benefits such as immunity boosting, gut health, or energy enhancement. Market penetration of functional foods is increasing steadily, driven by changing consumer lifestyles and a preference for preventative healthcare.
Leading Markets & Segments in Functional Foods and Beverages Industry
The North American and European regions dominate the global functional foods and beverages market, owing to high consumer awareness and disposable incomes. However, Asia-Pacific is showing rapid growth.
- Dominant Region: North America
- Dominant Country: United States
- Dominant Product Type: Dairy Products (Yogurt and other functional dairy products) demonstrate the highest market share, followed by Snack/Functional bars.
- Dominant Distribution Channel: Supermarkets/Hypermarkets hold the largest share, with online retail stores exhibiting rapid growth.
Key Drivers by Segment:
- Bakery Products: Growing demand for healthier baked goods, increasing use of functional ingredients like whole grains and seeds.
- Breakfast Cereals: Emphasis on added nutrients and fortified cereals catering to health-conscious consumers.
- Snack/Functional Bars: Convenience, portability, and targeted health benefits drive strong growth, particularly in sports and energy bars.
- Dairy Products: High demand for yogurt and other functional dairy products, driven by perceived health benefits and increased availability of specialized products.
- Baby Food: Growing awareness regarding infant nutrition drives demand for functional baby food products.
- Other Product Types: Innovation in beverage categories, such as functional drinks and plant-based alternatives, fuels this segment's growth.
- Supermarkets/Hypermarkets: Established distribution infrastructure and wide reach make this channel dominant.
- Specialist Retailers: Appeal to health-conscious consumers seeking specialized products.
- Convenience/Grocery Stores: Increasing preference for convenient access fuels growth in this segment.
- Online Retail Stores: Growing online shopping and direct-to-consumer models fuel expansion.
Functional Foods and Beverages Industry Product Developments
Recent product innovations focus on clean labels, plant-based ingredients, personalized nutrition, and improved taste and texture. Technological advancements in food processing, such as high-pressure processing and microencapsulation, are enabling the development of functional foods with enhanced stability and bioavailability of beneficial ingredients. The market is also seeing a rise in functional beverages, including enhanced water and plant-based milk alternatives.
Key Drivers of Functional Foods and Beverages Industry Growth
Several factors contribute to the growth of the functional foods and beverages market. Rising consumer awareness regarding health and wellness directly fuels demand for products that offer specific health benefits. Technological advancements lead to new product development and improved manufacturing processes. Favorable government regulations and initiatives supporting healthier food options also play a significant role.
Challenges in the Functional Foods and Beverages Industry Market
The industry faces various challenges, including stringent regulatory requirements concerning health claims, fluctuating raw material prices, maintaining consistent product quality, and intense competition, both from large established players and innovative startups. Maintaining supply chain efficiency and addressing consumer concerns about ingredient sourcing and sustainability present further hurdles. The estimated negative impact of these factors on the market growth for 2025 is approximately xx Million.
Emerging Opportunities in Functional Foods and Beverages Industry
Significant growth opportunities exist in personalized nutrition, incorporating artificial intelligence and big data to tailor products to individual needs and health goals. Expanding into emerging markets, such as Asia-Pacific and Latin America, coupled with strategic partnerships to enhance distribution and market penetration, presents further avenues for substantial growth.
Leading Players in the Functional Foods and Beverages Industry Sector
- PepsiCo Inc
- Yakult Honsha Co Ltd
- Lotus Bakeries
- Abbott Laboratories
- Danone SA
- Hearthside Food Solutions LLC
- Hindustan Unilever Ltd
- Care Nutrition
- Clif Bar & Company
- The Kellogg's Company
- Laird Superfoods
- General Mills
- Cocos Organic
- Valio Eesti AS
- Nestlé S A
Key Milestones in Functional Foods and Beverages Industry Industry
- January 2023: Cocos Organic launched a range of new organic dairy-free products, including coconut milk yog tubes and light natural yogurt. This broadened their product portfolio and caters to growing demand for plant-based alternatives.
- February 2023: Hindustan Unilever Ltd (HUL) launched chocolate-flavored Millet Horlicks. This product launch expanded HUL’s presence in the functional food space, tapping into the demand for healthier and more nutritious options.
- April 2023: Nestlé launched two new vegan chocolate chips, indicating the company’s adaptation to the rising demand for plant-based alternatives within the confectionery market.
Strategic Outlook for Functional Foods and Beverages Industry Market
The future of the functional foods and beverages market is bright, driven by several factors, including continued consumer demand for health and wellness products, technological advancements enhancing product development and personalization, and expansion into new global markets. Strategic partnerships, acquisitions, and investment in R&D will be crucial for companies to maintain a competitive edge and capitalize on future growth opportunities. The market is expected to witness substantial expansion during the forecast period, with significant opportunities in niche segments and innovative product categories.
Functional Foods and Beverages Industry Segmentation
-
1. Product Type
- 1.1. Bakery Products
- 1.2. Breakfast Cereals
-
1.3. Snack/Functional Bars
- 1.3.1. Sports Bars
- 1.3.2. Energy Bars
- 1.3.3. Protein Bars
-
1.4. Dairy Products
- 1.4.1. Yogurt
- 1.4.2. Other Functional Dairy Products
- 1.5. Baby Food
- 1.6. Other Product Types
-
2. Distribution Channel
- 2.1. Supermarkets/Hypermarkets
- 2.2. Specialist Retailers
- 2.3. Convenience/Grocery Stores
- 2.4. Online Retail Stores
- 2.5. Other Distribution Channels
Functional Foods and Beverages Industry Segmentation By Geography
-
1. North America
- 1.1. United States
- 1.2. Canada
- 1.3. Mexico
- 1.4. Rest of North America
-
2. Europe
- 2.1. United Kingdom
- 2.2. Germany
- 2.3. Spain
- 2.4. France
- 2.5. Italy
- 2.6. Russia
- 2.7. Rest of Europe
-
3. Asia Pacific
- 3.1. China
- 3.2. India
- 3.3. Japan
- 3.4. Australia
- 3.5. Rest of Asia Pacific
-
4. South America
- 4.1. Brazil
- 4.2. Argentina
- 4.3. Rest of South America
- 5. Middle East
-
6. South Africa
- 6.1. United Arab Emirates
- 6.2. Rest of Middle East
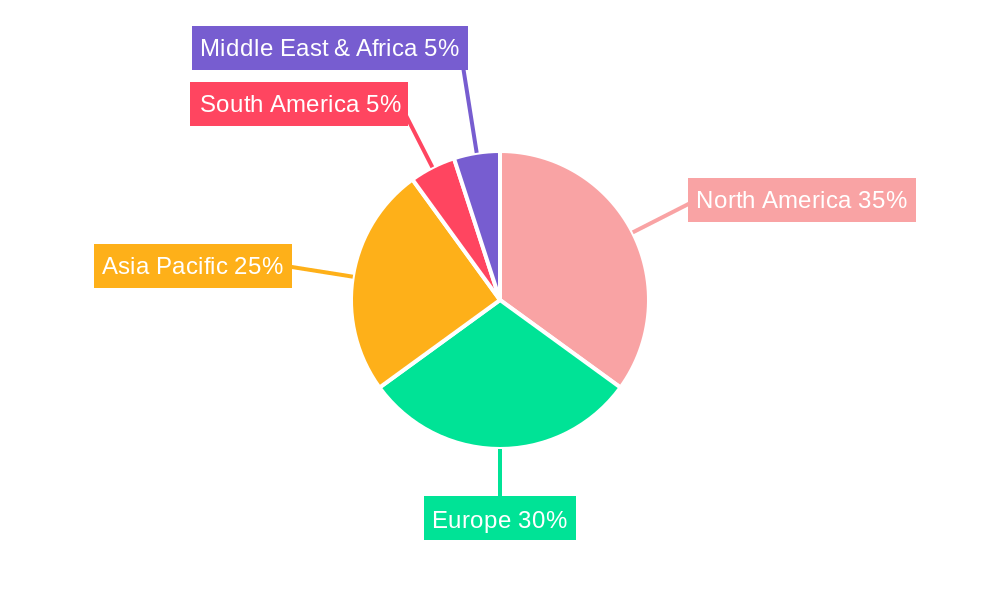
Functional Foods and Beverages Industry Regional Market Share
Geographic Coverage of Functional Foods and Beverages Industry
Functional Foods and Beverages Industry REPORT HIGHLIGHTS
| Aspects | Details |
|---|---|
| Study Period | 2020-2034 |
| Base Year | 2025 |
| Estimated Year | 2026 |
| Forecast Period | 2026-2034 |
| Historical Period | 2020-2025 |
| Growth Rate | CAGR of 7.8% from 2020-2034 |
| Segmentation |
|
Table of Contents
- 1. Introduction
- 1.1. Research Scope
- 1.2. Market Segmentation
- 1.3. Research Methodology
- 1.4. Definitions and Assumptions
- 2. Executive Summary
- 2.1. Introduction
- 3. Market Dynamics
- 3.1. Introduction
- 3.2. Market Drivers
- 3.2.1. Wide Applications and Functionality; Low Price and Easy Availability of Synthetic Phenethyl Alcohol
- 3.3. Market Restrains
- 3.3.1. Availability of Substitutes
- 3.4. Market Trends
- 3.4.1. Increasing Consumption of Nutrient-Enriched Food
- 4. Market Factor Analysis
- 4.1. Porters Five Forces
- 4.2. Supply/Value Chain
- 4.3. PESTEL analysis
- 4.4. Market Entropy
- 4.5. Patent/Trademark Analysis
- 5. Global Functional Foods and Beverages Industry Analysis, Insights and Forecast, 2020-2032
- 5.1. Market Analysis, Insights and Forecast - by Product Type
- 5.1.1. Bakery Products
- 5.1.2. Breakfast Cereals
- 5.1.3. Snack/Functional Bars
- 5.1.3.1. Sports Bars
- 5.1.3.2. Energy Bars
- 5.1.3.3. Protein Bars
- 5.1.4. Dairy Products
- 5.1.4.1. Yogurt
- 5.1.4.2. Other Functional Dairy Products
- 5.1.5. Baby Food
- 5.1.6. Other Product Types
- 5.2. Market Analysis, Insights and Forecast - by Distribution Channel
- 5.2.1. Supermarkets/Hypermarkets
- 5.2.2. Specialist Retailers
- 5.2.3. Convenience/Grocery Stores
- 5.2.4. Online Retail Stores
- 5.2.5. Other Distribution Channels
- 5.3. Market Analysis, Insights and Forecast - by Region
- 5.3.1. North America
- 5.3.2. Europe
- 5.3.3. Asia Pacific
- 5.3.4. South America
- 5.3.5. Middle East
- 5.3.6. South Africa
- 5.1. Market Analysis, Insights and Forecast - by Product Type
- 6. North America Functional Foods and Beverages Industry Analysis, Insights and Forecast, 2020-2032
- 6.1. Market Analysis, Insights and Forecast - by Product Type
- 6.1.1. Bakery Products
- 6.1.2. Breakfast Cereals
- 6.1.3. Snack/Functional Bars
- 6.1.3.1. Sports Bars
- 6.1.3.2. Energy Bars
- 6.1.3.3. Protein Bars
- 6.1.4. Dairy Products
- 6.1.4.1. Yogurt
- 6.1.4.2. Other Functional Dairy Products
- 6.1.5. Baby Food
- 6.1.6. Other Product Types
- 6.2. Market Analysis, Insights and Forecast - by Distribution Channel
- 6.2.1. Supermarkets/Hypermarkets
- 6.2.2. Specialist Retailers
- 6.2.3. Convenience/Grocery Stores
- 6.2.4. Online Retail Stores
- 6.2.5. Other Distribution Channels
- 6.1. Market Analysis, Insights and Forecast - by Product Type
- 7. Europe Functional Foods and Beverages Industry Analysis, Insights and Forecast, 2020-2032
- 7.1. Market Analysis, Insights and Forecast - by Product Type
- 7.1.1. Bakery Products
- 7.1.2. Breakfast Cereals
- 7.1.3. Snack/Functional Bars
- 7.1.3.1. Sports Bars
- 7.1.3.2. Energy Bars
- 7.1.3.3. Protein Bars
- 7.1.4. Dairy Products
- 7.1.4.1. Yogurt
- 7.1.4.2. Other Functional Dairy Products
- 7.1.5. Baby Food
- 7.1.6. Other Product Types
- 7.2. Market Analysis, Insights and Forecast - by Distribution Channel
- 7.2.1. Supermarkets/Hypermarkets
- 7.2.2. Specialist Retailers
- 7.2.3. Convenience/Grocery Stores
- 7.2.4. Online Retail Stores
- 7.2.5. Other Distribution Channels
- 7.1. Market Analysis, Insights and Forecast - by Product Type
- 8. Asia Pacific Functional Foods and Beverages Industry Analysis, Insights and Forecast, 2020-2032
- 8.1. Market Analysis, Insights and Forecast - by Product Type
- 8.1.1. Bakery Products
- 8.1.2. Breakfast Cereals
- 8.1.3. Snack/Functional Bars
- 8.1.3.1. Sports Bars
- 8.1.3.2. Energy Bars
- 8.1.3.3. Protein Bars
- 8.1.4. Dairy Products
- 8.1.4.1. Yogurt
- 8.1.4.2. Other Functional Dairy Products
- 8.1.5. Baby Food
- 8.1.6. Other Product Types
- 8.2. Market Analysis, Insights and Forecast - by Distribution Channel
- 8.2.1. Supermarkets/Hypermarkets
- 8.2.2. Specialist Retailers
- 8.2.3. Convenience/Grocery Stores
- 8.2.4. Online Retail Stores
- 8.2.5. Other Distribution Channels
- 8.1. Market Analysis, Insights and Forecast - by Product Type
- 9. South America Functional Foods and Beverages Industry Analysis, Insights and Forecast, 2020-2032
- 9.1. Market Analysis, Insights and Forecast - by Product Type
- 9.1.1. Bakery Products
- 9.1.2. Breakfast Cereals
- 9.1.3. Snack/Functional Bars
- 9.1.3.1. Sports Bars
- 9.1.3.2. Energy Bars
- 9.1.3.3. Protein Bars
- 9.1.4. Dairy Products
- 9.1.4.1. Yogurt
- 9.1.4.2. Other Functional Dairy Products
- 9.1.5. Baby Food
- 9.1.6. Other Product Types
- 9.2. Market Analysis, Insights and Forecast - by Distribution Channel
- 9.2.1. Supermarkets/Hypermarkets
- 9.2.2. Specialist Retailers
- 9.2.3. Convenience/Grocery Stores
- 9.2.4. Online Retail Stores
- 9.2.5. Other Distribution Channels
- 9.1. Market Analysis, Insights and Forecast - by Product Type
- 10. Middle East Functional Foods and Beverages Industry Analysis, Insights and Forecast, 2020-2032
- 10.1. Market Analysis, Insights and Forecast - by Product Type
- 10.1.1. Bakery Products
- 10.1.2. Breakfast Cereals
- 10.1.3. Snack/Functional Bars
- 10.1.3.1. Sports Bars
- 10.1.3.2. Energy Bars
- 10.1.3.3. Protein Bars
- 10.1.4. Dairy Products
- 10.1.4.1. Yogurt
- 10.1.4.2. Other Functional Dairy Products
- 10.1.5. Baby Food
- 10.1.6. Other Product Types
- 10.2. Market Analysis, Insights and Forecast - by Distribution Channel
- 10.2.1. Supermarkets/Hypermarkets
- 10.2.2. Specialist Retailers
- 10.2.3. Convenience/Grocery Stores
- 10.2.4. Online Retail Stores
- 10.2.5. Other Distribution Channels
- 10.1. Market Analysis, Insights and Forecast - by Product Type
- 11. South Africa Functional Foods and Beverages Industry Analysis, Insights and Forecast, 2020-2032
- 11.1. Market Analysis, Insights and Forecast - by Product Type
- 11.1.1. Bakery Products
- 11.1.2. Breakfast Cereals
- 11.1.3. Snack/Functional Bars
- 11.1.3.1. Sports Bars
- 11.1.3.2. Energy Bars
- 11.1.3.3. Protein Bars
- 11.1.4. Dairy Products
- 11.1.4.1. Yogurt
- 11.1.4.2. Other Functional Dairy Products
- 11.1.5. Baby Food
- 11.1.6. Other Product Types
- 11.2. Market Analysis, Insights and Forecast - by Distribution Channel
- 11.2.1. Supermarkets/Hypermarkets
- 11.2.2. Specialist Retailers
- 11.2.3. Convenience/Grocery Stores
- 11.2.4. Online Retail Stores
- 11.2.5. Other Distribution Channels
- 11.1. Market Analysis, Insights and Forecast - by Product Type
- 12. Competitive Analysis
- 12.1. Global Market Share Analysis 2025
- 12.2. Company Profiles
- 12.2.1 PepsiCo Inc
- 12.2.1.1. Overview
- 12.2.1.2. Products
- 12.2.1.3. SWOT Analysis
- 12.2.1.4. Recent Developments
- 12.2.1.5. Financials (Based on Availability)
- 12.2.2 Yakult Honsha Co Ltd
- 12.2.2.1. Overview
- 12.2.2.2. Products
- 12.2.2.3. SWOT Analysis
- 12.2.2.4. Recent Developments
- 12.2.2.5. Financials (Based on Availability)
- 12.2.3 Lotus Bakeries
- 12.2.3.1. Overview
- 12.2.3.2. Products
- 12.2.3.3. SWOT Analysis
- 12.2.3.4. Recent Developments
- 12.2.3.5. Financials (Based on Availability)
- 12.2.4 Abbott Laboratories
- 12.2.4.1. Overview
- 12.2.4.2. Products
- 12.2.4.3. SWOT Analysis
- 12.2.4.4. Recent Developments
- 12.2.4.5. Financials (Based on Availability)
- 12.2.5 Danone SA
- 12.2.5.1. Overview
- 12.2.5.2. Products
- 12.2.5.3. SWOT Analysis
- 12.2.5.4. Recent Developments
- 12.2.5.5. Financials (Based on Availability)
- 12.2.6 Hearthside Food Solutions LLC
- 12.2.6.1. Overview
- 12.2.6.2. Products
- 12.2.6.3. SWOT Analysis
- 12.2.6.4. Recent Developments
- 12.2.6.5. Financials (Based on Availability)
- 12.2.7 Hindustan Unilever Ltd *List Not Exhaustive
- 12.2.7.1. Overview
- 12.2.7.2. Products
- 12.2.7.3. SWOT Analysis
- 12.2.7.4. Recent Developments
- 12.2.7.5. Financials (Based on Availability)
- 12.2.8 Care Nutrition
- 12.2.8.1. Overview
- 12.2.8.2. Products
- 12.2.8.3. SWOT Analysis
- 12.2.8.4. Recent Developments
- 12.2.8.5. Financials (Based on Availability)
- 12.2.9 Clif Bar & Company
- 12.2.9.1. Overview
- 12.2.9.2. Products
- 12.2.9.3. SWOT Analysis
- 12.2.9.4. Recent Developments
- 12.2.9.5. Financials (Based on Availability)
- 12.2.10 The Kellogg's Company
- 12.2.10.1. Overview
- 12.2.10.2. Products
- 12.2.10.3. SWOT Analysis
- 12.2.10.4. Recent Developments
- 12.2.10.5. Financials (Based on Availability)
- 12.2.11 Laird Superfoods
- 12.2.11.1. Overview
- 12.2.11.2. Products
- 12.2.11.3. SWOT Analysis
- 12.2.11.4. Recent Developments
- 12.2.11.5. Financials (Based on Availability)
- 12.2.12 General Mills
- 12.2.12.1. Overview
- 12.2.12.2. Products
- 12.2.12.3. SWOT Analysis
- 12.2.12.4. Recent Developments
- 12.2.12.5. Financials (Based on Availability)
- 12.2.13 Cocos Organic
- 12.2.13.1. Overview
- 12.2.13.2. Products
- 12.2.13.3. SWOT Analysis
- 12.2.13.4. Recent Developments
- 12.2.13.5. Financials (Based on Availability)
- 12.2.14 Valio Eesti AS
- 12.2.14.1. Overview
- 12.2.14.2. Products
- 12.2.14.3. SWOT Analysis
- 12.2.14.4. Recent Developments
- 12.2.14.5. Financials (Based on Availability)
- 12.2.15 Nestlé S A
- 12.2.15.1. Overview
- 12.2.15.2. Products
- 12.2.15.3. SWOT Analysis
- 12.2.15.4. Recent Developments
- 12.2.15.5. Financials (Based on Availability)
- 12.2.1 PepsiCo Inc
List of Figures
- Figure 1: Global Functional Foods and Beverages Industry Revenue Breakdown (billion, %) by Region 2025 & 2033
- Figure 2: North America Functional Foods and Beverages Industry Revenue (billion), by Product Type 2025 & 2033
- Figure 3: North America Functional Foods and Beverages Industry Revenue Share (%), by Product Type 2025 & 2033
- Figure 4: North America Functional Foods and Beverages Industry Revenue (billion), by Distribution Channel 2025 & 2033
- Figure 5: North America Functional Foods and Beverages Industry Revenue Share (%), by Distribution Channel 2025 & 2033
- Figure 6: North America Functional Foods and Beverages Industry Revenue (billion), by Country 2025 & 2033
- Figure 7: North America Functional Foods and Beverages Industry Revenue Share (%), by Country 2025 & 2033
- Figure 8: Europe Functional Foods and Beverages Industry Revenue (billion), by Product Type 2025 & 2033
- Figure 9: Europe Functional Foods and Beverages Industry Revenue Share (%), by Product Type 2025 & 2033
- Figure 10: Europe Functional Foods and Beverages Industry Revenue (billion), by Distribution Channel 2025 & 2033
- Figure 11: Europe Functional Foods and Beverages Industry Revenue Share (%), by Distribution Channel 2025 & 2033
- Figure 12: Europe Functional Foods and Beverages Industry Revenue (billion), by Country 2025 & 2033
- Figure 13: Europe Functional Foods and Beverages Industry Revenue Share (%), by Country 2025 & 2033
- Figure 14: Asia Pacific Functional Foods and Beverages Industry Revenue (billion), by Product Type 2025 & 2033
- Figure 15: Asia Pacific Functional Foods and Beverages Industry Revenue Share (%), by Product Type 2025 & 2033
- Figure 16: Asia Pacific Functional Foods and Beverages Industry Revenue (billion), by Distribution Channel 2025 & 2033
- Figure 17: Asia Pacific Functional Foods and Beverages Industry Revenue Share (%), by Distribution Channel 2025 & 2033
- Figure 18: Asia Pacific Functional Foods and Beverages Industry Revenue (billion), by Country 2025 & 2033
- Figure 19: Asia Pacific Functional Foods and Beverages Industry Revenue Share (%), by Country 2025 & 2033
- Figure 20: South America Functional Foods and Beverages Industry Revenue (billion), by Product Type 2025 & 2033
- Figure 21: South America Functional Foods and Beverages Industry Revenue Share (%), by Product Type 2025 & 2033
- Figure 22: South America Functional Foods and Beverages Industry Revenue (billion), by Distribution Channel 2025 & 2033
- Figure 23: South America Functional Foods and Beverages Industry Revenue Share (%), by Distribution Channel 2025 & 2033
- Figure 24: South America Functional Foods and Beverages Industry Revenue (billion), by Country 2025 & 2033
- Figure 25: South America Functional Foods and Beverages Industry Revenue Share (%), by Country 2025 & 2033
- Figure 26: Middle East Functional Foods and Beverages Industry Revenue (billion), by Product Type 2025 & 2033
- Figure 27: Middle East Functional Foods and Beverages Industry Revenue Share (%), by Product Type 2025 & 2033
- Figure 28: Middle East Functional Foods and Beverages Industry Revenue (billion), by Distribution Channel 2025 & 2033
- Figure 29: Middle East Functional Foods and Beverages Industry Revenue Share (%), by Distribution Channel 2025 & 2033
- Figure 30: Middle East Functional Foods and Beverages Industry Revenue (billion), by Country 2025 & 2033
- Figure 31: Middle East Functional Foods and Beverages Industry Revenue Share (%), by Country 2025 & 2033
- Figure 32: South Africa Functional Foods and Beverages Industry Revenue (billion), by Product Type 2025 & 2033
- Figure 33: South Africa Functional Foods and Beverages Industry Revenue Share (%), by Product Type 2025 & 2033
- Figure 34: South Africa Functional Foods and Beverages Industry Revenue (billion), by Distribution Channel 2025 & 2033
- Figure 35: South Africa Functional Foods and Beverages Industry Revenue Share (%), by Distribution Channel 2025 & 2033
- Figure 36: South Africa Functional Foods and Beverages Industry Revenue (billion), by Country 2025 & 2033
- Figure 37: South Africa Functional Foods and Beverages Industry Revenue Share (%), by Country 2025 & 2033
List of Tables
- Table 1: Global Functional Foods and Beverages Industry Revenue billion Forecast, by Product Type 2020 & 2033
- Table 2: Global Functional Foods and Beverages Industry Revenue billion Forecast, by Distribution Channel 2020 & 2033
- Table 3: Global Functional Foods and Beverages Industry Revenue billion Forecast, by Region 2020 & 2033
- Table 4: Global Functional Foods and Beverages Industry Revenue billion Forecast, by Product Type 2020 & 2033
- Table 5: Global Functional Foods and Beverages Industry Revenue billion Forecast, by Distribution Channel 2020 & 2033
- Table 6: Global Functional Foods and Beverages Industry Revenue billion Forecast, by Country 2020 & 2033
- Table 7: United States Functional Foods and Beverages Industry Revenue (billion) Forecast, by Application 2020 & 2033
- Table 8: Canada Functional Foods and Beverages Industry Revenue (billion) Forecast, by Application 2020 & 2033
- Table 9: Mexico Functional Foods and Beverages Industry Revenue (billion) Forecast, by Application 2020 & 2033
- Table 10: Rest of North America Functional Foods and Beverages Industry Revenue (billion) Forecast, by Application 2020 & 2033
- Table 11: Global Functional Foods and Beverages Industry Revenue billion Forecast, by Product Type 2020 & 2033
- Table 12: Global Functional Foods and Beverages Industry Revenue billion Forecast, by Distribution Channel 2020 & 2033
- Table 13: Global Functional Foods and Beverages Industry Revenue billion Forecast, by Country 2020 & 2033
- Table 14: United Kingdom Functional Foods and Beverages Industry Revenue (billion) Forecast, by Application 2020 & 2033
- Table 15: Germany Functional Foods and Beverages Industry Revenue (billion) Forecast, by Application 2020 & 2033
- Table 16: Spain Functional Foods and Beverages Industry Revenue (billion) Forecast, by Application 2020 & 2033
- Table 17: France Functional Foods and Beverages Industry Revenue (billion) Forecast, by Application 2020 & 2033
- Table 18: Italy Functional Foods and Beverages Industry Revenue (billion) Forecast, by Application 2020 & 2033
- Table 19: Russia Functional Foods and Beverages Industry Revenue (billion) Forecast, by Application 2020 & 2033
- Table 20: Rest of Europe Functional Foods and Beverages Industry Revenue (billion) Forecast, by Application 2020 & 2033
- Table 21: Global Functional Foods and Beverages Industry Revenue billion Forecast, by Product Type 2020 & 2033
- Table 22: Global Functional Foods and Beverages Industry Revenue billion Forecast, by Distribution Channel 2020 & 2033
- Table 23: Global Functional Foods and Beverages Industry Revenue billion Forecast, by Country 2020 & 2033
- Table 24: China Functional Foods and Beverages Industry Revenue (billion) Forecast, by Application 2020 & 2033
- Table 25: India Functional Foods and Beverages Industry Revenue (billion) Forecast, by Application 2020 & 2033
- Table 26: Japan Functional Foods and Beverages Industry Revenue (billion) Forecast, by Application 2020 & 2033
- Table 27: Australia Functional Foods and Beverages Industry Revenue (billion) Forecast, by Application 2020 & 2033
- Table 28: Rest of Asia Pacific Functional Foods and Beverages Industry Revenue (billion) Forecast, by Application 2020 & 2033
- Table 29: Global Functional Foods and Beverages Industry Revenue billion Forecast, by Product Type 2020 & 2033
- Table 30: Global Functional Foods and Beverages Industry Revenue billion Forecast, by Distribution Channel 2020 & 2033
- Table 31: Global Functional Foods and Beverages Industry Revenue billion Forecast, by Country 2020 & 2033
- Table 32: Brazil Functional Foods and Beverages Industry Revenue (billion) Forecast, by Application 2020 & 2033
- Table 33: Argentina Functional Foods and Beverages Industry Revenue (billion) Forecast, by Application 2020 & 2033
- Table 34: Rest of South America Functional Foods and Beverages Industry Revenue (billion) Forecast, by Application 2020 & 2033
- Table 35: Global Functional Foods and Beverages Industry Revenue billion Forecast, by Product Type 2020 & 2033
- Table 36: Global Functional Foods and Beverages Industry Revenue billion Forecast, by Distribution Channel 2020 & 2033
- Table 37: Global Functional Foods and Beverages Industry Revenue billion Forecast, by Country 2020 & 2033
- Table 38: Global Functional Foods and Beverages Industry Revenue billion Forecast, by Product Type 2020 & 2033
- Table 39: Global Functional Foods and Beverages Industry Revenue billion Forecast, by Distribution Channel 2020 & 2033
- Table 40: Global Functional Foods and Beverages Industry Revenue billion Forecast, by Country 2020 & 2033
- Table 41: United Arab Emirates Functional Foods and Beverages Industry Revenue (billion) Forecast, by Application 2020 & 2033
- Table 42: Rest of Middle East Functional Foods and Beverages Industry Revenue (billion) Forecast, by Application 2020 & 2033
Frequently Asked Questions
1. What is the projected Compound Annual Growth Rate (CAGR) of the Functional Foods and Beverages Industry?
The projected CAGR is approximately 7.8%.
2. Which companies are prominent players in the Functional Foods and Beverages Industry?
Key companies in the market include PepsiCo Inc, Yakult Honsha Co Ltd, Lotus Bakeries, Abbott Laboratories, Danone SA, Hearthside Food Solutions LLC, Hindustan Unilever Ltd *List Not Exhaustive, Care Nutrition, Clif Bar & Company, The Kellogg's Company, Laird Superfoods, General Mills, Cocos Organic, Valio Eesti AS, Nestlé S A.
3. What are the main segments of the Functional Foods and Beverages Industry?
The market segments include Product Type, Distribution Channel.
4. Can you provide details about the market size?
The market size is estimated to be USD 398.81 billion as of 2022.
5. What are some drivers contributing to market growth?
Wide Applications and Functionality; Low Price and Easy Availability of Synthetic Phenethyl Alcohol.
6. What are the notable trends driving market growth?
Increasing Consumption of Nutrient-Enriched Food.
7. Are there any restraints impacting market growth?
Availability of Substitutes.
8. Can you provide examples of recent developments in the market?
April 2023: Swiss food giant Nestlé announced the launch of its two new vegan chocolate chips under its Toll House brand. These chips are claimed to be dairy-free and were launched to meet the demand for plant-based products.
9. What pricing options are available for accessing the report?
Pricing options include single-user, multi-user, and enterprise licenses priced at USD 4750, USD 5250, and USD 8750 respectively.
10. Is the market size provided in terms of value or volume?
The market size is provided in terms of value, measured in billion.
11. Are there any specific market keywords associated with the report?
Yes, the market keyword associated with the report is "Functional Foods and Beverages Industry," which aids in identifying and referencing the specific market segment covered.
12. How do I determine which pricing option suits my needs best?
The pricing options vary based on user requirements and access needs. Individual users may opt for single-user licenses, while businesses requiring broader access may choose multi-user or enterprise licenses for cost-effective access to the report.
13. Are there any additional resources or data provided in the Functional Foods and Beverages Industry report?
While the report offers comprehensive insights, it's advisable to review the specific contents or supplementary materials provided to ascertain if additional resources or data are available.
14. How can I stay updated on further developments or reports in the Functional Foods and Beverages Industry?
To stay informed about further developments, trends, and reports in the Functional Foods and Beverages Industry, consider subscribing to industry newsletters, following relevant companies and organizations, or regularly checking reputable industry news sources and publications.
Methodology
Step 1 - Identification of Relevant Samples Size from Population Database


Step 2 - Approaches for Defining Global Market Size (Value, Volume* & Price*)

Note*: In applicable scenarios
Step 3 - Data Sources
Primary Research
- Web Analytics
- Survey Reports
- Research Institute
- Latest Research Reports
- Opinion Leaders
Secondary Research
- Annual Reports
- White Paper
- Latest Press Release
- Industry Association
- Paid Database
- Investor Presentations

Step 4 - Data Triangulation
Involves using different sources of information in order to increase the validity of a study
These sources are likely to be stakeholders in a program - participants, other researchers, program staff, other community members, and so on.
Then we put all data in single framework & apply various statistical tools to find out the dynamic on the market.
During the analysis stage, feedback from the stakeholder groups would be compared to determine areas of agreement as well as areas of divergence