

Key Insights
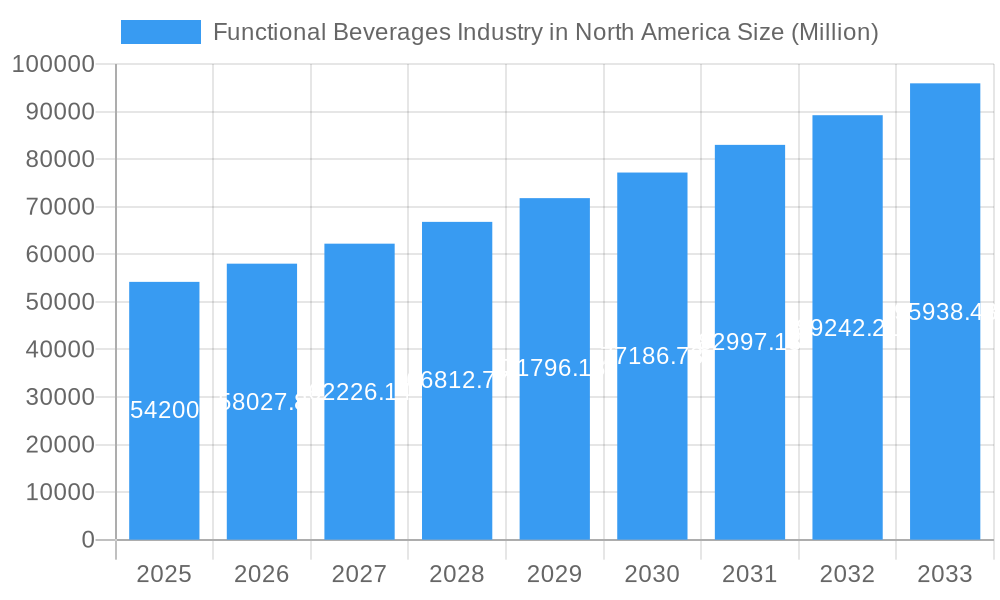
The North American functional beverage market, valued at $54.20 billion in 2025, is projected to experience robust growth, exhibiting a Compound Annual Growth Rate (CAGR) of 6.90% from 2025 to 2033. This expansion is driven by several key factors. Increasing health consciousness among consumers fuels demand for beverages fortified with vitamins, minerals, and other beneficial ingredients. The rising prevalence of health conditions, such as obesity and diabetes, is further pushing consumers towards healthier alternatives, boosting the market for functional beverages. Moreover, the growing popularity of active lifestyles and athletic pursuits contributes to the increasing demand for sports drinks and energy drinks. The convenience factor of ready-to-drink functional beverages also contributes significantly to market growth. Significant growth is expected within segments such as energy drinks and sports drinks, driven by marketing campaigns emphasizing athletic performance and energy boosts. Fortified juices and dairy/dairy alternative beverages are also expected to show strong growth due to health-conscious consumers seeking nutritional benefits. Distribution channels such as hypermarkets/supermarkets and online retail stores are key players, driving market penetration and access for consumers. Major players like Nestle SA, PepsiCo Inc., and Monster Beverage Corporation are leading the market, continually innovating with new product offerings and strategic marketing to maintain their competitive edge.

Functional Beverages Industry in North America Market Size (In Billion)
The market's growth, however, is not without challenges. Price fluctuations of raw materials and increasing competition from private-label brands pose potential restraints. Regulatory changes regarding labeling and ingredient claims can also impact growth. Future growth will depend on the continued innovation in product development, focusing on natural ingredients, unique flavor profiles, and functional benefits targeted at specific consumer needs. Strategic partnerships and acquisitions are also expected to shape the competitive landscape in the coming years. The North American market is projected to maintain its significant share of the global functional beverage market throughout the forecast period due to the strong consumer preference for healthier alternatives and high disposable incomes. Further expansion is expected through effective marketing, targeted product development, and leveraging the growing online retail sector.
Functional Beverages Industry in North America Company Market Share
Functional Beverages Industry in North America: A Comprehensive Market Report (2019-2033)
This comprehensive report provides an in-depth analysis of the North American functional beverages industry, offering invaluable insights for stakeholders, investors, and industry professionals. The report covers the period from 2019 to 2033, with a focus on the base year 2025 and a forecast period extending to 2033. The analysis incorporates key market segments, leading players, and significant industry developments to provide a holistic understanding of this dynamic market. The market is projected to reach xx Million by 2033, demonstrating substantial growth potential.
Functional Beverages Industry in North America Market Dynamics & Concentration
This section analyzes the competitive landscape of the North American functional beverage market, examining market concentration, innovation drivers, regulatory frameworks, and key industry trends. The market is characterized by a mix of large multinational corporations and smaller niche players. Key players like Nestle SA, Monster Beverage Corporation, Pepsico Inc., Glanbia PLC, Danone SA, Red Bull GmbH, The Coca-Cola Company, and Campbell Soup Company, among others, hold significant market share, contributing to a moderately concentrated market. However, the emergence of smaller, innovative brands continues to challenge the established players.
- Market Concentration: The Herfindahl-Hirschman Index (HHI) is estimated at xx, indicating a moderately concentrated market with room for smaller players. Leading players collectively hold an estimated xx% market share in 2025.
- Innovation Drivers: Growing consumer demand for health and wellness-focused beverages, coupled with advancements in product formulation and packaging technologies, drive innovation. This includes the development of functional beverages with enhanced nutritional profiles and improved taste.
- Regulatory Frameworks: Regulations related to food safety, labeling, and health claims significantly influence the industry. Compliance with evolving standards is crucial for market participation.
- Product Substitutes: The market faces competition from other beverage categories, including traditional soft drinks, juices, and water. The competitive landscape is further influenced by emerging substitutes such as plant-based beverages.
- End-User Trends: Health-conscious consumers, especially millennials and Gen Z, are driving demand for functional beverages with added benefits, such as enhanced energy, improved immunity, and better hydration.
- M&A Activities: The industry has witnessed significant M&A activity in recent years, with xx mergers and acquisitions recorded between 2019 and 2024. These activities aim to consolidate market share, expand product portfolios, and enhance distribution capabilities.
Functional Beverages Industry in North America Industry Trends & Analysis
The North American functional beverage market exhibits robust growth driven by several key factors. Consumer preference for healthier options is a major driver, fueling demand for products enriched with vitamins, minerals, probiotics, and other functional ingredients. Furthermore, rising health awareness and increased disposable incomes have contributed to the market's expansion. Technological advancements in beverage formulation and packaging also play a crucial role.
The market is witnessing a shift toward natural and organic ingredients, creating opportunities for brands that focus on transparency and sustainability. The market is expected to exhibit a Compound Annual Growth Rate (CAGR) of xx% during the forecast period (2025-2033), with market penetration reaching xx% by 2033. Competitive dynamics are characterized by both intense competition among established players and the emergence of innovative smaller brands catering to niche segments. The prevalence of private labels also poses a challenge to established brands.
Leading Markets & Segments in Functional Beverages Industry in North America
The United States remains the dominant market for functional beverages in North America, accounting for xx% of the total market value in 2025. Canada follows as the second-largest market, with a market share of xx%.
Dominant Segments:
- Type: Energy drinks continue to dominate the market, followed by sports drinks and fortified juices. The dairy and dairy-alternative beverage segment is experiencing rapid growth, driven by rising veganism and lactose intolerance. The “other types” segment encompasses diverse emerging functional beverages.
- Distribution Channel: Hypermarkets/supermarkets account for the largest share of the distribution channel, followed by convenience stores and drug stores. Online retail is also emerging as a significant distribution channel, with increasing penetration amongst consumers.
Key Drivers by Segment:
- Energy Drinks: Increasing demand for convenient energy boosts, driven by hectic lifestyles.
- Sports Drinks: Growing popularity of fitness and athletic activities, leading to increased consumption among athletes and fitness enthusiasts.
- Fortified Juices: Rising consumer awareness of the health benefits of vitamins and minerals.
- Dairy and Dairy Alternative Beverages: The demand for plant-based alternatives and protein-enriched beverages.
- Hypermarkets/Supermarkets: Wide product availability and established distribution networks.
- Convenience Stores: Convenient location and impulse purchases.
- Online Retail Stores: Increasing online shopping trends and home delivery options.
Functional Beverages Industry in North America Product Developments
Recent product innovations focus on clean label formulations, natural ingredients, and functional benefits. Brands are increasingly emphasizing low-sugar, low-calorie options, catering to health-conscious consumers. Technological advancements in flavor creation and preservation techniques enable the development of more appealing and shelf-stable products. The market is witnessing an upsurge in plant-based and organic functional beverages, highlighting consumer preferences for sustainability and natural ingredients. The emphasis on personalized nutrition is also driving the development of functional beverages tailored to specific dietary needs and health goals.
Key Drivers of Functional Beverages Industry in North America Growth
Several factors contribute to the growth of the North American functional beverage market. The increasing awareness of health and wellness among consumers fuels demand for products offering nutritional benefits beyond basic hydration. Technological innovations in product formulation and packaging enhance product appeal and shelf life, contributing to market expansion. Government regulations promoting healthier food and beverage choices create opportunities for the industry's growth. Rising disposable incomes and changing consumer lifestyles also support the increasing demand for convenient and functional beverages.
Challenges in the Functional Beverages Industry in North America Market
Despite considerable growth potential, several challenges impede market expansion. Stringent regulatory requirements for labeling and health claims, along with increasing raw material costs, pose significant hurdles. Intense competition from established brands and the emergence of new players create price pressures. Supply chain disruptions and fluctuations in commodity prices also influence profitability. Consumer perception and misinformation surrounding the health benefits of some functional ingredients can negatively impact market growth. The industry faces the added challenge of managing environmental sustainability in its production and packaging processes.
Emerging Opportunities in Functional Beverages Industry in North America
The North American functional beverage market presents several promising opportunities for future growth. Technological breakthroughs in beverage formulation, such as the development of innovative functional ingredients and improved delivery systems, are anticipated to drive product innovation and market expansion. Strategic partnerships between beverage companies and healthcare providers can contribute to the market's growth by increasing consumer awareness of the health benefits of functional beverages. Expansion into new markets and geographic regions offers significant potential.
Leading Players in the Functional Beverages Industry in North America Sector
- Nestle SA
- Monster Beverage Corporation
- Pepsico Inc
- Glanbia PLC
- Danone SA
- Red Bull GmbH
- The Hain Celestial Group Inc
- The Coca-Cola Company
- Campbell Soup Company
- General Nutrition Centers Inc
Key Milestones in Functional Beverages Industry in North America Industry
- January 2021: Danone North America launched Silk Ultra, a protein-packed, plant-based beverage targeting athletes. This launch signifies the growing demand for plant-based protein sources in the functional beverage market.
- January 2022: Bubly sparkling water introduced three new limited-edition flavors in Canada. This reflects the growing popularity of flavored sparkling waters in the functional beverage sector.
- February 2022: Tropicana launched Tropicana Light, featuring reduced-calorie and no-added-sugar options. This indicates a growing market trend toward healthier, low-calorie beverages.
Strategic Outlook for Functional Beverages Industry in North America Market
The North American functional beverage market is poised for continued growth, driven by evolving consumer preferences, technological advancements, and increasing health awareness. Strategic opportunities lie in focusing on clean label formulations, natural ingredients, and sustainable packaging. Companies that leverage personalized nutrition approaches and cater to niche consumer segments are likely to gain a competitive advantage. Investing in research and development to explore innovative functional ingredients and delivery systems will be crucial for future success. The market also offers opportunities for mergers and acquisitions to further consolidate market share and enhance product portfolios.
Functional Beverages Industry in North America Segmentation
-
1. Type
- 1.1. Energy Drinks
- 1.2. Sports Drinks
- 1.3. Fortified Juice
- 1.4. Dairy and Dairy Alternative Beverage
- 1.5. Other Types
-
2. Distribution Channel
- 2.1. Hypermarkets/Supermarkets
- 2.2. Drug stores and Pharmacies
- 2.3. Convenience Stores
- 2.4. Online Retail Stores
- 2.5. Other Distribution Channels
Functional Beverages Industry in North America Segmentation By Geography
-
1. North America
- 1.1. United States
- 1.2. Canada
- 1.3. Mexico
-
2. South America
- 2.1. Brazil
- 2.2. Argentina
- 2.3. Rest of South America
-
3. Europe
- 3.1. United Kingdom
- 3.2. Germany
- 3.3. France
- 3.4. Italy
- 3.5. Spain
- 3.6. Russia
- 3.7. Benelux
- 3.8. Nordics
- 3.9. Rest of Europe
-
4. Middle East & Africa
- 4.1. Turkey
- 4.2. Israel
- 4.3. GCC
- 4.4. North Africa
- 4.5. South Africa
- 4.6. Rest of Middle East & Africa
-
5. Asia Pacific
- 5.1. China
- 5.2. India
- 5.3. Japan
- 5.4. South Korea
- 5.5. ASEAN
- 5.6. Oceania
- 5.7. Rest of Asia Pacific

Functional Beverages Industry in North America Regional Market Share
Geographic Coverage of Functional Beverages Industry in North America
Functional Beverages Industry in North America REPORT HIGHLIGHTS
| Aspects | Details |
|---|---|
| Study Period | 2020-2034 |
| Base Year | 2025 |
| Estimated Year | 2026 |
| Forecast Period | 2026-2034 |
| Historical Period | 2020-2025 |
| Growth Rate | CAGR of 6.90% from 2020-2034 |
| Segmentation |
|
Table of Contents
- 1. Introduction
- 1.1. Research Scope
- 1.2. Market Segmentation
- 1.3. Research Methodology
- 1.4. Definitions and Assumptions
- 2. Executive Summary
- 2.1. Introduction
- 3. Market Dynamics
- 3.1. Introduction
- 3.2. Market Drivers
- 3.2.1. Demand for specialty and organic coffee pods and capsules; Innovations in packaging formats
- 3.3. Market Restrains
- 3.3.1. Availability of counterfeit products
- 3.4. Market Trends
- 3.4.1. Flavor Innovations Leading to the Growth of the Market
- 4. Market Factor Analysis
- 4.1. Porters Five Forces
- 4.2. Supply/Value Chain
- 4.3. PESTEL analysis
- 4.4. Market Entropy
- 4.5. Patent/Trademark Analysis
- 5. Global Functional Beverages Industry in North America Analysis, Insights and Forecast, 2020-2032
- 5.1. Market Analysis, Insights and Forecast - by Type
- 5.1.1. Energy Drinks
- 5.1.2. Sports Drinks
- 5.1.3. Fortified Juice
- 5.1.4. Dairy and Dairy Alternative Beverage
- 5.1.5. Other Types
- 5.2. Market Analysis, Insights and Forecast - by Distribution Channel
- 5.2.1. Hypermarkets/Supermarkets
- 5.2.2. Drug stores and Pharmacies
- 5.2.3. Convenience Stores
- 5.2.4. Online Retail Stores
- 5.2.5. Other Distribution Channels
- 5.3. Market Analysis, Insights and Forecast - by Region
- 5.3.1. North America
- 5.3.2. South America
- 5.3.3. Europe
- 5.3.4. Middle East & Africa
- 5.3.5. Asia Pacific
- 5.1. Market Analysis, Insights and Forecast - by Type
- 6. North America Functional Beverages Industry in North America Analysis, Insights and Forecast, 2020-2032
- 6.1. Market Analysis, Insights and Forecast - by Type
- 6.1.1. Energy Drinks
- 6.1.2. Sports Drinks
- 6.1.3. Fortified Juice
- 6.1.4. Dairy and Dairy Alternative Beverage
- 6.1.5. Other Types
- 6.2. Market Analysis, Insights and Forecast - by Distribution Channel
- 6.2.1. Hypermarkets/Supermarkets
- 6.2.2. Drug stores and Pharmacies
- 6.2.3. Convenience Stores
- 6.2.4. Online Retail Stores
- 6.2.5. Other Distribution Channels
- 6.1. Market Analysis, Insights and Forecast - by Type
- 7. South America Functional Beverages Industry in North America Analysis, Insights and Forecast, 2020-2032
- 7.1. Market Analysis, Insights and Forecast - by Type
- 7.1.1. Energy Drinks
- 7.1.2. Sports Drinks
- 7.1.3. Fortified Juice
- 7.1.4. Dairy and Dairy Alternative Beverage
- 7.1.5. Other Types
- 7.2. Market Analysis, Insights and Forecast - by Distribution Channel
- 7.2.1. Hypermarkets/Supermarkets
- 7.2.2. Drug stores and Pharmacies
- 7.2.3. Convenience Stores
- 7.2.4. Online Retail Stores
- 7.2.5. Other Distribution Channels
- 7.1. Market Analysis, Insights and Forecast - by Type
- 8. Europe Functional Beverages Industry in North America Analysis, Insights and Forecast, 2020-2032
- 8.1. Market Analysis, Insights and Forecast - by Type
- 8.1.1. Energy Drinks
- 8.1.2. Sports Drinks
- 8.1.3. Fortified Juice
- 8.1.4. Dairy and Dairy Alternative Beverage
- 8.1.5. Other Types
- 8.2. Market Analysis, Insights and Forecast - by Distribution Channel
- 8.2.1. Hypermarkets/Supermarkets
- 8.2.2. Drug stores and Pharmacies
- 8.2.3. Convenience Stores
- 8.2.4. Online Retail Stores
- 8.2.5. Other Distribution Channels
- 8.1. Market Analysis, Insights and Forecast - by Type
- 9. Middle East & Africa Functional Beverages Industry in North America Analysis, Insights and Forecast, 2020-2032
- 9.1. Market Analysis, Insights and Forecast - by Type
- 9.1.1. Energy Drinks
- 9.1.2. Sports Drinks
- 9.1.3. Fortified Juice
- 9.1.4. Dairy and Dairy Alternative Beverage
- 9.1.5. Other Types
- 9.2. Market Analysis, Insights and Forecast - by Distribution Channel
- 9.2.1. Hypermarkets/Supermarkets
- 9.2.2. Drug stores and Pharmacies
- 9.2.3. Convenience Stores
- 9.2.4. Online Retail Stores
- 9.2.5. Other Distribution Channels
- 9.1. Market Analysis, Insights and Forecast - by Type
- 10. Asia Pacific Functional Beverages Industry in North America Analysis, Insights and Forecast, 2020-2032
- 10.1. Market Analysis, Insights and Forecast - by Type
- 10.1.1. Energy Drinks
- 10.1.2. Sports Drinks
- 10.1.3. Fortified Juice
- 10.1.4. Dairy and Dairy Alternative Beverage
- 10.1.5. Other Types
- 10.2. Market Analysis, Insights and Forecast - by Distribution Channel
- 10.2.1. Hypermarkets/Supermarkets
- 10.2.2. Drug stores and Pharmacies
- 10.2.3. Convenience Stores
- 10.2.4. Online Retail Stores
- 10.2.5. Other Distribution Channels
- 10.1. Market Analysis, Insights and Forecast - by Type
- 11. Competitive Analysis
- 11.1. Global Market Share Analysis 2025
- 11.2. Company Profiles
- 11.2.1 Nestle SA
- 11.2.1.1. Overview
- 11.2.1.2. Products
- 11.2.1.3. SWOT Analysis
- 11.2.1.4. Recent Developments
- 11.2.1.5. Financials (Based on Availability)
- 11.2.2 Monster Beverage Corporation
- 11.2.2.1. Overview
- 11.2.2.2. Products
- 11.2.2.3. SWOT Analysis
- 11.2.2.4. Recent Developments
- 11.2.2.5. Financials (Based on Availability)
- 11.2.3 Pepsico Inc
- 11.2.3.1. Overview
- 11.2.3.2. Products
- 11.2.3.3. SWOT Analysis
- 11.2.3.4. Recent Developments
- 11.2.3.5. Financials (Based on Availability)
- 11.2.4 Glanbia PLC
- 11.2.4.1. Overview
- 11.2.4.2. Products
- 11.2.4.3. SWOT Analysis
- 11.2.4.4. Recent Developments
- 11.2.4.5. Financials (Based on Availability)
- 11.2.5 Danone SA
- 11.2.5.1. Overview
- 11.2.5.2. Products
- 11.2.5.3. SWOT Analysis
- 11.2.5.4. Recent Developments
- 11.2.5.5. Financials (Based on Availability)
- 11.2.6 Red Bull GmbH
- 11.2.6.1. Overview
- 11.2.6.2. Products
- 11.2.6.3. SWOT Analysis
- 11.2.6.4. Recent Developments
- 11.2.6.5. Financials (Based on Availability)
- 11.2.7 The Hain Celestial Group Inc *List Not Exhaustive
- 11.2.7.1. Overview
- 11.2.7.2. Products
- 11.2.7.3. SWOT Analysis
- 11.2.7.4. Recent Developments
- 11.2.7.5. Financials (Based on Availability)
- 11.2.8 The Coca-Cola Company
- 11.2.8.1. Overview
- 11.2.8.2. Products
- 11.2.8.3. SWOT Analysis
- 11.2.8.4. Recent Developments
- 11.2.8.5. Financials (Based on Availability)
- 11.2.9 Campbell Soup Company
- 11.2.9.1. Overview
- 11.2.9.2. Products
- 11.2.9.3. SWOT Analysis
- 11.2.9.4. Recent Developments
- 11.2.9.5. Financials (Based on Availability)
- 11.2.10 General Nutrition Centers Inc
- 11.2.10.1. Overview
- 11.2.10.2. Products
- 11.2.10.3. SWOT Analysis
- 11.2.10.4. Recent Developments
- 11.2.10.5. Financials (Based on Availability)
- 11.2.1 Nestle SA
List of Figures
- Figure 1: Global Functional Beverages Industry in North America Revenue Breakdown (Million, %) by Region 2025 & 2033
- Figure 2: North America Functional Beverages Industry in North America Revenue (Million), by Type 2025 & 2033
- Figure 3: North America Functional Beverages Industry in North America Revenue Share (%), by Type 2025 & 2033
- Figure 4: North America Functional Beverages Industry in North America Revenue (Million), by Distribution Channel 2025 & 2033
- Figure 5: North America Functional Beverages Industry in North America Revenue Share (%), by Distribution Channel 2025 & 2033
- Figure 6: North America Functional Beverages Industry in North America Revenue (Million), by Country 2025 & 2033
- Figure 7: North America Functional Beverages Industry in North America Revenue Share (%), by Country 2025 & 2033
- Figure 8: South America Functional Beverages Industry in North America Revenue (Million), by Type 2025 & 2033
- Figure 9: South America Functional Beverages Industry in North America Revenue Share (%), by Type 2025 & 2033
- Figure 10: South America Functional Beverages Industry in North America Revenue (Million), by Distribution Channel 2025 & 2033
- Figure 11: South America Functional Beverages Industry in North America Revenue Share (%), by Distribution Channel 2025 & 2033
- Figure 12: South America Functional Beverages Industry in North America Revenue (Million), by Country 2025 & 2033
- Figure 13: South America Functional Beverages Industry in North America Revenue Share (%), by Country 2025 & 2033
- Figure 14: Europe Functional Beverages Industry in North America Revenue (Million), by Type 2025 & 2033
- Figure 15: Europe Functional Beverages Industry in North America Revenue Share (%), by Type 2025 & 2033
- Figure 16: Europe Functional Beverages Industry in North America Revenue (Million), by Distribution Channel 2025 & 2033
- Figure 17: Europe Functional Beverages Industry in North America Revenue Share (%), by Distribution Channel 2025 & 2033
- Figure 18: Europe Functional Beverages Industry in North America Revenue (Million), by Country 2025 & 2033
- Figure 19: Europe Functional Beverages Industry in North America Revenue Share (%), by Country 2025 & 2033
- Figure 20: Middle East & Africa Functional Beverages Industry in North America Revenue (Million), by Type 2025 & 2033
- Figure 21: Middle East & Africa Functional Beverages Industry in North America Revenue Share (%), by Type 2025 & 2033
- Figure 22: Middle East & Africa Functional Beverages Industry in North America Revenue (Million), by Distribution Channel 2025 & 2033
- Figure 23: Middle East & Africa Functional Beverages Industry in North America Revenue Share (%), by Distribution Channel 2025 & 2033
- Figure 24: Middle East & Africa Functional Beverages Industry in North America Revenue (Million), by Country 2025 & 2033
- Figure 25: Middle East & Africa Functional Beverages Industry in North America Revenue Share (%), by Country 2025 & 2033
- Figure 26: Asia Pacific Functional Beverages Industry in North America Revenue (Million), by Type 2025 & 2033
- Figure 27: Asia Pacific Functional Beverages Industry in North America Revenue Share (%), by Type 2025 & 2033
- Figure 28: Asia Pacific Functional Beverages Industry in North America Revenue (Million), by Distribution Channel 2025 & 2033
- Figure 29: Asia Pacific Functional Beverages Industry in North America Revenue Share (%), by Distribution Channel 2025 & 2033
- Figure 30: Asia Pacific Functional Beverages Industry in North America Revenue (Million), by Country 2025 & 2033
- Figure 31: Asia Pacific Functional Beverages Industry in North America Revenue Share (%), by Country 2025 & 2033
List of Tables
- Table 1: Global Functional Beverages Industry in North America Revenue Million Forecast, by Type 2020 & 2033
- Table 2: Global Functional Beverages Industry in North America Revenue Million Forecast, by Distribution Channel 2020 & 2033
- Table 3: Global Functional Beverages Industry in North America Revenue Million Forecast, by Region 2020 & 2033
- Table 4: Global Functional Beverages Industry in North America Revenue Million Forecast, by Type 2020 & 2033
- Table 5: Global Functional Beverages Industry in North America Revenue Million Forecast, by Distribution Channel 2020 & 2033
- Table 6: Global Functional Beverages Industry in North America Revenue Million Forecast, by Country 2020 & 2033
- Table 7: United States Functional Beverages Industry in North America Revenue (Million) Forecast, by Application 2020 & 2033
- Table 8: Canada Functional Beverages Industry in North America Revenue (Million) Forecast, by Application 2020 & 2033
- Table 9: Mexico Functional Beverages Industry in North America Revenue (Million) Forecast, by Application 2020 & 2033
- Table 10: Global Functional Beverages Industry in North America Revenue Million Forecast, by Type 2020 & 2033
- Table 11: Global Functional Beverages Industry in North America Revenue Million Forecast, by Distribution Channel 2020 & 2033
- Table 12: Global Functional Beverages Industry in North America Revenue Million Forecast, by Country 2020 & 2033
- Table 13: Brazil Functional Beverages Industry in North America Revenue (Million) Forecast, by Application 2020 & 2033
- Table 14: Argentina Functional Beverages Industry in North America Revenue (Million) Forecast, by Application 2020 & 2033
- Table 15: Rest of South America Functional Beverages Industry in North America Revenue (Million) Forecast, by Application 2020 & 2033
- Table 16: Global Functional Beverages Industry in North America Revenue Million Forecast, by Type 2020 & 2033
- Table 17: Global Functional Beverages Industry in North America Revenue Million Forecast, by Distribution Channel 2020 & 2033
- Table 18: Global Functional Beverages Industry in North America Revenue Million Forecast, by Country 2020 & 2033
- Table 19: United Kingdom Functional Beverages Industry in North America Revenue (Million) Forecast, by Application 2020 & 2033
- Table 20: Germany Functional Beverages Industry in North America Revenue (Million) Forecast, by Application 2020 & 2033
- Table 21: France Functional Beverages Industry in North America Revenue (Million) Forecast, by Application 2020 & 2033
- Table 22: Italy Functional Beverages Industry in North America Revenue (Million) Forecast, by Application 2020 & 2033
- Table 23: Spain Functional Beverages Industry in North America Revenue (Million) Forecast, by Application 2020 & 2033
- Table 24: Russia Functional Beverages Industry in North America Revenue (Million) Forecast, by Application 2020 & 2033
- Table 25: Benelux Functional Beverages Industry in North America Revenue (Million) Forecast, by Application 2020 & 2033
- Table 26: Nordics Functional Beverages Industry in North America Revenue (Million) Forecast, by Application 2020 & 2033
- Table 27: Rest of Europe Functional Beverages Industry in North America Revenue (Million) Forecast, by Application 2020 & 2033
- Table 28: Global Functional Beverages Industry in North America Revenue Million Forecast, by Type 2020 & 2033
- Table 29: Global Functional Beverages Industry in North America Revenue Million Forecast, by Distribution Channel 2020 & 2033
- Table 30: Global Functional Beverages Industry in North America Revenue Million Forecast, by Country 2020 & 2033
- Table 31: Turkey Functional Beverages Industry in North America Revenue (Million) Forecast, by Application 2020 & 2033
- Table 32: Israel Functional Beverages Industry in North America Revenue (Million) Forecast, by Application 2020 & 2033
- Table 33: GCC Functional Beverages Industry in North America Revenue (Million) Forecast, by Application 2020 & 2033
- Table 34: North Africa Functional Beverages Industry in North America Revenue (Million) Forecast, by Application 2020 & 2033
- Table 35: South Africa Functional Beverages Industry in North America Revenue (Million) Forecast, by Application 2020 & 2033
- Table 36: Rest of Middle East & Africa Functional Beverages Industry in North America Revenue (Million) Forecast, by Application 2020 & 2033
- Table 37: Global Functional Beverages Industry in North America Revenue Million Forecast, by Type 2020 & 2033
- Table 38: Global Functional Beverages Industry in North America Revenue Million Forecast, by Distribution Channel 2020 & 2033
- Table 39: Global Functional Beverages Industry in North America Revenue Million Forecast, by Country 2020 & 2033
- Table 40: China Functional Beverages Industry in North America Revenue (Million) Forecast, by Application 2020 & 2033
- Table 41: India Functional Beverages Industry in North America Revenue (Million) Forecast, by Application 2020 & 2033
- Table 42: Japan Functional Beverages Industry in North America Revenue (Million) Forecast, by Application 2020 & 2033
- Table 43: South Korea Functional Beverages Industry in North America Revenue (Million) Forecast, by Application 2020 & 2033
- Table 44: ASEAN Functional Beverages Industry in North America Revenue (Million) Forecast, by Application 2020 & 2033
- Table 45: Oceania Functional Beverages Industry in North America Revenue (Million) Forecast, by Application 2020 & 2033
- Table 46: Rest of Asia Pacific Functional Beverages Industry in North America Revenue (Million) Forecast, by Application 2020 & 2033
Frequently Asked Questions
1. What is the projected Compound Annual Growth Rate (CAGR) of the Functional Beverages Industry in North America?
The projected CAGR is approximately 6.90%.
2. Which companies are prominent players in the Functional Beverages Industry in North America?
Key companies in the market include Nestle SA, Monster Beverage Corporation, Pepsico Inc, Glanbia PLC, Danone SA, Red Bull GmbH, The Hain Celestial Group Inc *List Not Exhaustive, The Coca-Cola Company, Campbell Soup Company, General Nutrition Centers Inc.
3. What are the main segments of the Functional Beverages Industry in North America?
The market segments include Type, Distribution Channel.
4. Can you provide details about the market size?
The market size is estimated to be USD 54.20 Million as of 2022.
5. What are some drivers contributing to market growth?
Demand for specialty and organic coffee pods and capsules; Innovations in packaging formats.
6. What are the notable trends driving market growth?
Flavor Innovations Leading to the Growth of the Market.
7. Are there any restraints impacting market growth?
Availability of counterfeit products.
8. Can you provide examples of recent developments in the market?
February 2022: Tropicana Light products introduced two flavors -Berry Colada and Tropical Sunrise. The new drinks featured 70% fewer calories and no added sugar than current Tropicana Premium Drinks brands. They are claimed to be a strong source of vitamin C and contain 15% juice. Both are sold at the suggested retail price of USD 2.79 per 52 oz bottle in grocery stores across the United States.
9. What pricing options are available for accessing the report?
Pricing options include single-user, multi-user, and enterprise licenses priced at USD 4750, USD 5250, and USD 8750 respectively.
10. Is the market size provided in terms of value or volume?
The market size is provided in terms of value, measured in Million.
11. Are there any specific market keywords associated with the report?
Yes, the market keyword associated with the report is "Functional Beverages Industry in North America," which aids in identifying and referencing the specific market segment covered.
12. How do I determine which pricing option suits my needs best?
The pricing options vary based on user requirements and access needs. Individual users may opt for single-user licenses, while businesses requiring broader access may choose multi-user or enterprise licenses for cost-effective access to the report.
13. Are there any additional resources or data provided in the Functional Beverages Industry in North America report?
While the report offers comprehensive insights, it's advisable to review the specific contents or supplementary materials provided to ascertain if additional resources or data are available.
14. How can I stay updated on further developments or reports in the Functional Beverages Industry in North America?
To stay informed about further developments, trends, and reports in the Functional Beverages Industry in North America, consider subscribing to industry newsletters, following relevant companies and organizations, or regularly checking reputable industry news sources and publications.
Methodology
Step 1 - Identification of Relevant Samples Size from Population Database


Step 2 - Approaches for Defining Global Market Size (Value, Volume* & Price*)

Note*: In applicable scenarios
Step 3 - Data Sources
Primary Research
- Web Analytics
- Survey Reports
- Research Institute
- Latest Research Reports
- Opinion Leaders
Secondary Research
- Annual Reports
- White Paper
- Latest Press Release
- Industry Association
- Paid Database
- Investor Presentations

Step 4 - Data Triangulation
Involves using different sources of information in order to increase the validity of a study
These sources are likely to be stakeholders in a program - participants, other researchers, program staff, other community members, and so on.
Then we put all data in single framework & apply various statistical tools to find out the dynamic on the market.
During the analysis stage, feedback from the stakeholder groups would be compared to determine areas of agreement as well as areas of divergence