

Key Insights
The Asia-Pacific (APAC) fermented drinks market is experiencing substantial growth, projected at a CAGR of 6.2%. This expansion is fueled by increasing health consciousness, a rising middle class with greater disposable income, and the enduring popularity of traditional fermented beverages. The region's rich culinary heritage, featuring diverse offerings such as kombucha, kefir, and kimchi juice, significantly drives consumer demand. The APAC market size is estimated at 1010.2 billion in the base year 2025, a conservative projection considering rapid growth in emerging economies. Key markets like China, India, and Japan exhibit strong performance, with traditional beverages deeply embedded in their culture and a growing adoption of Western options like kombucha and kefir among health-focused consumers. The off-trade channel, encompassing supermarkets and online retailers, is outperforming the on-trade (restaurants, bars) due to evolving consumption habits and convenience. However, challenges persist regarding consistent product quality and potential health risks associated with improper fermentation.
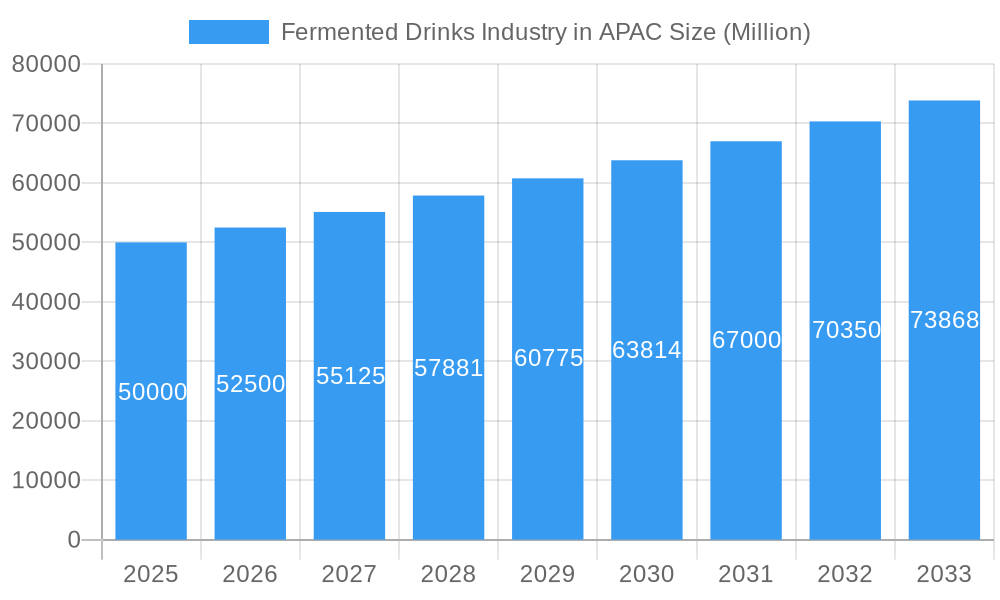
Fermented Drinks Industry in APAC Market Size (In Million)
Market segmentation within APAC shows a strong preference for both alcoholic and non-alcoholic fermented drinks. While traditional alcoholic beverages like sake and rice wine remain prominent, non-alcoholic alternatives are gaining traction due to health concerns and lifestyle shifts. Innovation in flavors, packaging, and functional ingredients is a key growth driver. Companies are developing specialized products with targeted health benefits, leading to premiumization and increased consumer willingness to invest in high-quality, niche fermented drinks. The forecast period (2025-2033) anticipates sustained growth, potentially expanding the market significantly. Competitive intensity is rising, with both global corporations and local enterprises actively seeking market share.
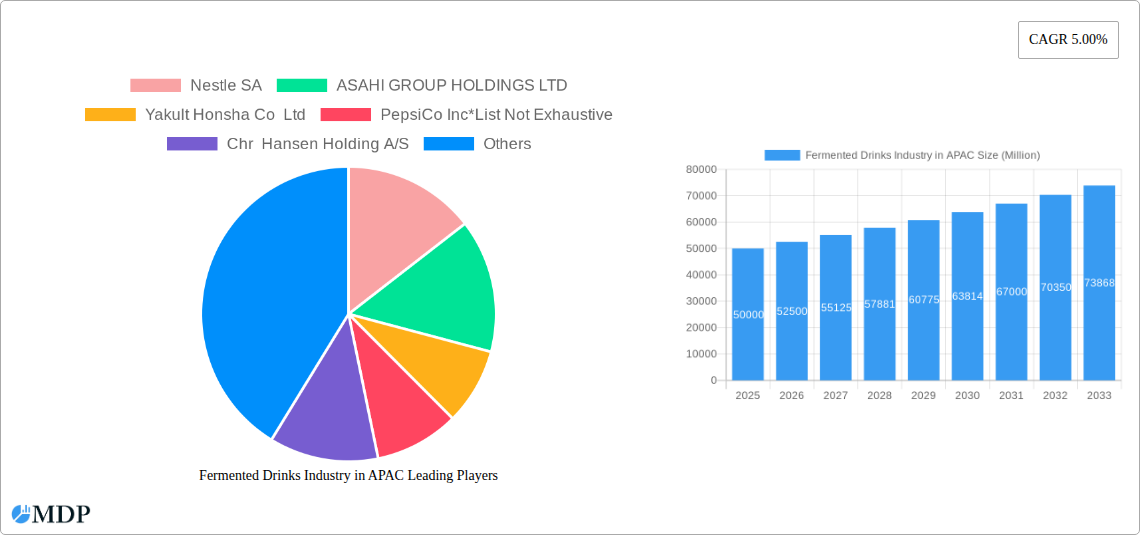
Fermented Drinks Industry in APAC Company Market Share
Unlock the Untapped Potential: Fermented Drinks Industry in APAC (2019-2033)
This comprehensive report delivers an in-depth analysis of the burgeoning Fermented Drinks market in the Asia-Pacific region, providing invaluable insights for stakeholders across the value chain. Spanning the period from 2019 to 2033, with a focus on 2025, this study unveils the market dynamics, key trends, leading players, and future opportunities shaping this dynamic sector. We project a market valued at xx Million in 2025, poised for significant growth over the forecast period (2025-2033).
Fermented Drinks Industry in APAC Market Dynamics & Concentration
The APAC fermented drinks market exhibits a complex interplay of factors influencing its growth and concentration. Market share is largely distributed among a mix of global giants and regional players. Nestle SA, Asahi Group Holdings Ltd, Yakult Honsha Co Ltd, and PepsiCo Inc. hold significant positions, though the market also supports numerous smaller, specialized companies. The market concentration ratio (CR4) for 2025 is estimated at xx%, indicating a moderately concentrated market with room for both established players and new entrants.
- Innovation Drivers: Growing consumer demand for healthier beverages, coupled with advancements in fermentation technologies (e.g., precision fermentation) are driving innovation.
- Regulatory Frameworks: Varying regulations across APAC nations concerning labeling, alcohol content, and health claims influence product development and market access. Compliance costs and complexities vary significantly.
- Product Substitutes: The market faces competition from other beverage categories like juices, soft drinks, and functional beverages.
- End-User Trends: Health-conscious consumers are driving the growth of non-alcoholic fermented drinks, while evolving tastes are fueling demand for diverse alcoholic fermented options.
- M&A Activities: The past five years have witnessed xx M&A deals in the APAC fermented drinks sector, driven by strategies of market consolidation and expansion into new product categories. This number is expected to increase to approximately xx by 2033.
Fermented Drinks Industry in APAC Industry Trends & Analysis
The APAC fermented drinks market is experiencing robust growth, fueled by several key trends. The region's large and increasingly affluent population, coupled with rising health awareness, creates a fertile ground for fermented beverage consumption. A CAGR of xx% is projected for the period 2025-2033, driven by increasing market penetration of both alcoholic and non-alcoholic fermented drinks, particularly in developing economies. Technological advancements in production processes and packaging are enhancing efficiency and product quality. Furthermore, evolving consumer preferences towards natural and functional beverages are further bolstering the sector's growth. The competitive landscape is marked by both intense competition among established players and the emergence of innovative startups offering unique products and distribution strategies. This fierce competition stimulates innovation and drives down prices. The increasing adoption of e-commerce and online marketplaces presents both opportunities and challenges for companies needing to adapt to new distribution models. Specific consumer preference trends vary considerably between countries, influenced by cultural norms and local ingredients.
Leading Markets & Segments in Fermented Drinks Industry in APAC
The APAC fermented drinks market presents significant regional and segmental variations. While China and Japan currently dominate in terms of market size, other countries, including South Korea, India, and Australia, are witnessing rapid growth.
By Type:
- Alcoholic Beverages: This segment is experiencing significant growth driven by changing consumer preferences towards craft beverages and locally produced fermented drinks.
- Non-Alcoholic Beverages: This segment demonstrates strong growth fueled by increasing health awareness and the perception of fermented drinks as probiotics beneficial for gut health.
By Distribution Channel:
- Off-Trade: This channel dominates due to the convenience of supermarket and retail purchases.
- On-Trade: This segment is experiencing moderate growth, driven by increased consumption in restaurants and bars particularly in urban areas.
Key Drivers for Dominant Markets:
- China: Strong economic growth, increasing disposable incomes, and a large population drive significant consumption.
- Japan: Established culture of fermented beverages and high health consciousness fuel consistent market growth.
The dominance of specific regions is influenced by factors such as economic development, infrastructure, cultural preferences, and regulatory environments.
Fermented Drinks Industry in APAC Product Developments
Significant innovations are transforming the APAC fermented drinks landscape. This includes the introduction of novel fermented products like kombucha and kefir, alongside fortified beverages enriched with vitamins and other functional ingredients. Companies are actively exploring sustainable packaging solutions and employing precision fermentation technologies to enhance production efficiency and product quality, meeting consumer demands for cleaner labels and more sustainable products. This focus on health and sustainability drives a strong competitive advantage.
Key Drivers of Fermented Drinks Industry in APAC Growth
The APAC fermented drinks market's growth is propelled by several key factors. Technological advancements in fermentation processes reduce production costs and improve product quality, making these beverages more affordable and appealing. A rising middle class with greater disposable income is driving increased consumption of premium fermented beverages. Supportive government policies promoting local industries and agricultural products in several APAC countries are also boosting growth.
Challenges in the Fermented Drinks Industry in APAC Market
The APAC fermented drinks market faces challenges including inconsistent regulatory frameworks across different nations, resulting in compliance complexities and variations in product standards. Furthermore, maintaining consistent supply chain efficiency amid regional variations in production capacities and distribution infrastructure presents operational obstacles. Intense competition among established players and new entrants also necessitates continuous innovation and efficient cost management. These challenges, if not addressed effectively, could slow down the market's projected growth rate.
Emerging Opportunities in Fermented Drinks Industry in APAC
Significant growth opportunities exist within the APAC fermented drinks market. The increasing adoption of e-commerce and online sales channels creates new avenues for distribution and brand building. Strategic partnerships between established beverage companies and smaller, innovative startups can fuel the introduction of novel products and reach wider consumer segments. Expanding into new markets within the region, leveraging technological advancements to enhance production efficiency, and focusing on sustainable packaging will present attractive opportunities for future market expansion.
Leading Players in the Fermented Drinks Industry in APAC Sector
- Nestle SA
- ASAHI GROUP HOLDINGS LTD
- Yakult Honsha Co Ltd
- PepsiCo Inc
- Chr Hansen Holding A/S
- Groupe Danone SA
- HAKKAISAN BREWERY CO LTD
- Heineken NV
- GT'S LIVING FOODS
Key Milestones in Fermented Drinks Industry in APAC Industry
- 2020: Increased investment in R&D for sustainable fermentation processes.
- 2021: Launch of several new functional fermented beverages with added health benefits.
- 2022: Significant growth in e-commerce sales of fermented drinks.
- 2023: Several key M&A deals reshaping the market landscape.
Strategic Outlook for Fermented Drinks Industry in APAC Market
The APAC fermented drinks market holds immense future potential. Continued innovation, strategic partnerships, and a focus on sustainability will be crucial for success. Expanding into niche segments like craft fermented beverages and adapting to changing consumer preferences will be essential for maximizing market share. The focus on health and wellness, coupled with technological advancements, positions the market for sustained and robust growth in the years to come.
Fermented Drinks Industry in APAC Segmentation
-
1. Type
- 1.1. Alcoholic Beverages
-
1.2. Non-Alcoholic Beverages
- 1.2.1. Kombucha
- 1.2.2. Kefir
- 1.2.3. Others
-
2. Distribution Channel
- 2.1. On-Trade
-
2.2. Off-Trade
- 2.2.1. Supermarket/Hypermarket
- 2.2.2. Convenience Store
- 2.2.3. Specialty Stores
- 2.2.4. Others
-
3. Geography
- 3.1. India
- 3.2. China
- 3.3. Japan
- 3.4. Australia
- 3.5. Rest of Asia Pacific
Fermented Drinks Industry in APAC Segmentation By Geography
- 1. India
- 2. China
- 3. Japan
- 4. Australia
- 5. Rest of Asia Pacific
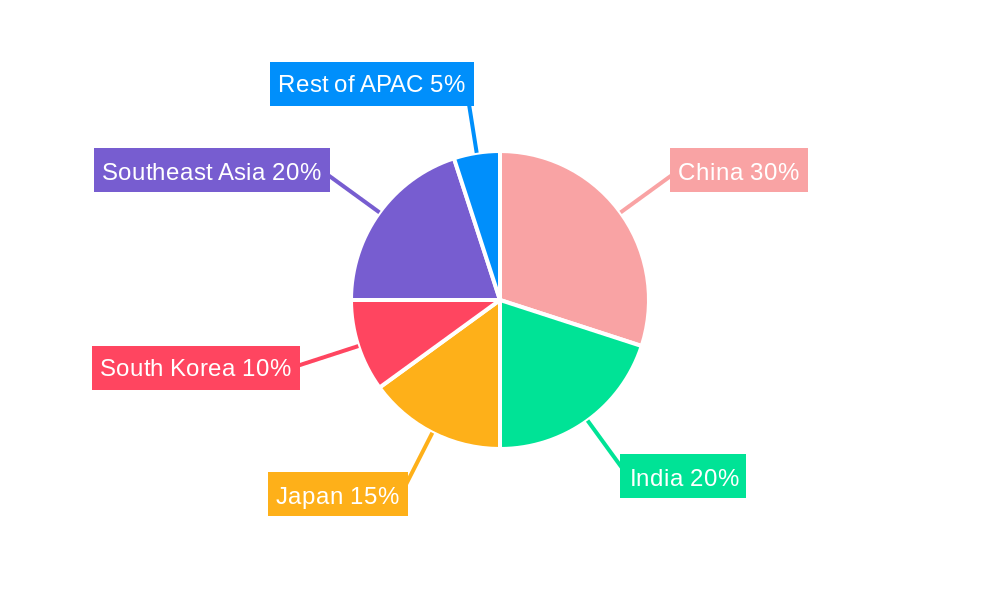
Fermented Drinks Industry in APAC Regional Market Share
Geographic Coverage of Fermented Drinks Industry in APAC
Fermented Drinks Industry in APAC REPORT HIGHLIGHTS
| Aspects | Details |
|---|---|
| Study Period | 2020-2034 |
| Base Year | 2025 |
| Estimated Year | 2026 |
| Forecast Period | 2026-2034 |
| Historical Period | 2020-2025 |
| Growth Rate | CAGR of 6.2% from 2020-2034 |
| Segmentation |
|
Table of Contents
- 1. Introduction
- 1.1. Research Scope
- 1.2. Market Segmentation
- 1.3. Research Objective
- 1.4. Definitions and Assumptions
- 2. Executive Summary
- 2.1. Market Snapshot
- 3. Market Dynamics
- 3.1. Market Drivers
- 3.2. Market Restrains
- 3.3. Market Trends
- 3.4. Market Opportunities
- 4. Market Factor Analysis
- 4.1. Porters Five Forces
- 4.1.1. Bargaining Power of Suppliers
- 4.1.2. Bargaining Power of Buyers
- 4.1.3. Threat of New Entrants
- 4.1.4. Threat of Substitutes
- 4.1.5. Competitive Rivalry
- 4.2. PESTEL analysis
- 4.3. BCG Analysis
- 4.3.1. Stars (High Growth, High Market Share)
- 4.3.2. Cash Cows (Low Growth, High Market Share)
- 4.3.3. Question Mark (High Growth, Low Market Share)
- 4.3.4. Dogs (Low Growth, Low Market Share)
- 4.4. Ansoff Matrix Analysis
- 4.5. Supply Chain Analysis
- 4.6. Regulatory Landscape
- 4.7. Current Market Potential and Opportunity Assessment (TAM–SAM–SOM Framework)
- 4.8. MDP Analyst Note
- 4.1. Porters Five Forces
- 5. Market Analysis, Insights and Forecast 2021-2033
- 5.1. Market Analysis, Insights and Forecast - by Type
- 5.1.1. Alcoholic Beverages
- 5.1.2. Non-Alcoholic Beverages
- 5.1.2.1. Kombucha
- 5.1.2.2. Kefir
- 5.1.2.3. Others
- 5.2. Market Analysis, Insights and Forecast - by Distribution Channel
- 5.2.1. On-Trade
- 5.2.2. Off-Trade
- 5.2.2.1. Supermarket/Hypermarket
- 5.2.2.2. Convenience Store
- 5.2.2.3. Specialty Stores
- 5.2.2.4. Others
- 5.3. Market Analysis, Insights and Forecast - by Geography
- 5.3.1. India
- 5.3.2. China
- 5.3.3. Japan
- 5.3.4. Australia
- 5.3.5. Rest of Asia Pacific
- 5.4. Market Analysis, Insights and Forecast - by Region
- 5.4.1. India
- 5.4.2. China
- 5.4.3. Japan
- 5.4.4. Australia
- 5.4.5. Rest of Asia Pacific
- 5.1. Market Analysis, Insights and Forecast - by Type
- 6. Global Fermented Drinks Industry in APAC Analysis, Insights and Forecast, 2021-2033
- 6.1. Market Analysis, Insights and Forecast - by Type
- 6.1.1. Alcoholic Beverages
- 6.1.2. Non-Alcoholic Beverages
- 6.1.2.1. Kombucha
- 6.1.2.2. Kefir
- 6.1.2.3. Others
- 6.2. Market Analysis, Insights and Forecast - by Distribution Channel
- 6.2.1. On-Trade
- 6.2.2. Off-Trade
- 6.2.2.1. Supermarket/Hypermarket
- 6.2.2.2. Convenience Store
- 6.2.2.3. Specialty Stores
- 6.2.2.4. Others
- 6.3. Market Analysis, Insights and Forecast - by Geography
- 6.3.1. India
- 6.3.2. China
- 6.3.3. Japan
- 6.3.4. Australia
- 6.3.5. Rest of Asia Pacific
- 6.1. Market Analysis, Insights and Forecast - by Type
- 7. India Fermented Drinks Industry in APAC Analysis, Insights and Forecast, 2020-2032
- 7.1. Market Analysis, Insights and Forecast - by Type
- 7.1.1. Alcoholic Beverages
- 7.1.2. Non-Alcoholic Beverages
- 7.1.2.1. Kombucha
- 7.1.2.2. Kefir
- 7.1.2.3. Others
- 7.2. Market Analysis, Insights and Forecast - by Distribution Channel
- 7.2.1. On-Trade
- 7.2.2. Off-Trade
- 7.2.2.1. Supermarket/Hypermarket
- 7.2.2.2. Convenience Store
- 7.2.2.3. Specialty Stores
- 7.2.2.4. Others
- 7.3. Market Analysis, Insights and Forecast - by Geography
- 7.3.1. India
- 7.3.2. China
- 7.3.3. Japan
- 7.3.4. Australia
- 7.3.5. Rest of Asia Pacific
- 7.1. Market Analysis, Insights and Forecast - by Type
- 8. China Fermented Drinks Industry in APAC Analysis, Insights and Forecast, 2020-2032
- 8.1. Market Analysis, Insights and Forecast - by Type
- 8.1.1. Alcoholic Beverages
- 8.1.2. Non-Alcoholic Beverages
- 8.1.2.1. Kombucha
- 8.1.2.2. Kefir
- 8.1.2.3. Others
- 8.2. Market Analysis, Insights and Forecast - by Distribution Channel
- 8.2.1. On-Trade
- 8.2.2. Off-Trade
- 8.2.2.1. Supermarket/Hypermarket
- 8.2.2.2. Convenience Store
- 8.2.2.3. Specialty Stores
- 8.2.2.4. Others
- 8.3. Market Analysis, Insights and Forecast - by Geography
- 8.3.1. India
- 8.3.2. China
- 8.3.3. Japan
- 8.3.4. Australia
- 8.3.5. Rest of Asia Pacific
- 8.1. Market Analysis, Insights and Forecast - by Type
- 9. Japan Fermented Drinks Industry in APAC Analysis, Insights and Forecast, 2020-2032
- 9.1. Market Analysis, Insights and Forecast - by Type
- 9.1.1. Alcoholic Beverages
- 9.1.2. Non-Alcoholic Beverages
- 9.1.2.1. Kombucha
- 9.1.2.2. Kefir
- 9.1.2.3. Others
- 9.2. Market Analysis, Insights and Forecast - by Distribution Channel
- 9.2.1. On-Trade
- 9.2.2. Off-Trade
- 9.2.2.1. Supermarket/Hypermarket
- 9.2.2.2. Convenience Store
- 9.2.2.3. Specialty Stores
- 9.2.2.4. Others
- 9.3. Market Analysis, Insights and Forecast - by Geography
- 9.3.1. India
- 9.3.2. China
- 9.3.3. Japan
- 9.3.4. Australia
- 9.3.5. Rest of Asia Pacific
- 9.1. Market Analysis, Insights and Forecast - by Type
- 10. Australia Fermented Drinks Industry in APAC Analysis, Insights and Forecast, 2020-2032
- 10.1. Market Analysis, Insights and Forecast - by Type
- 10.1.1. Alcoholic Beverages
- 10.1.2. Non-Alcoholic Beverages
- 10.1.2.1. Kombucha
- 10.1.2.2. Kefir
- 10.1.2.3. Others
- 10.2. Market Analysis, Insights and Forecast - by Distribution Channel
- 10.2.1. On-Trade
- 10.2.2. Off-Trade
- 10.2.2.1. Supermarket/Hypermarket
- 10.2.2.2. Convenience Store
- 10.2.2.3. Specialty Stores
- 10.2.2.4. Others
- 10.3. Market Analysis, Insights and Forecast - by Geography
- 10.3.1. India
- 10.3.2. China
- 10.3.3. Japan
- 10.3.4. Australia
- 10.3.5. Rest of Asia Pacific
- 10.1. Market Analysis, Insights and Forecast - by Type
- 11. Rest of Asia Pacific Fermented Drinks Industry in APAC Analysis, Insights and Forecast, 2020-2032
- 11.1. Market Analysis, Insights and Forecast - by Type
- 11.1.1. Alcoholic Beverages
- 11.1.2. Non-Alcoholic Beverages
- 11.1.2.1. Kombucha
- 11.1.2.2. Kefir
- 11.1.2.3. Others
- 11.2. Market Analysis, Insights and Forecast - by Distribution Channel
- 11.2.1. On-Trade
- 11.2.2. Off-Trade
- 11.2.2.1. Supermarket/Hypermarket
- 11.2.2.2. Convenience Store
- 11.2.2.3. Specialty Stores
- 11.2.2.4. Others
- 11.3. Market Analysis, Insights and Forecast - by Geography
- 11.3.1. India
- 11.3.2. China
- 11.3.3. Japan
- 11.3.4. Australia
- 11.3.5. Rest of Asia Pacific
- 11.1. Market Analysis, Insights and Forecast - by Type
- 12. Competitive Analysis
- 12.1. Company Profiles
- 12.1.1 Nestle SA
- 12.1.1.1. Company Overview
- 12.1.1.2. Products
- 12.1.1.3. Company Financials
- 12.1.1.4. SWOT Analysis
- 12.1.2 ASAHI GROUP HOLDINGS LTD
- 12.1.2.1. Company Overview
- 12.1.2.2. Products
- 12.1.2.3. Company Financials
- 12.1.2.4. SWOT Analysis
- 12.1.3 Yakult Honsha Co Ltd
- 12.1.3.1. Company Overview
- 12.1.3.2. Products
- 12.1.3.3. Company Financials
- 12.1.3.4. SWOT Analysis
- 12.1.4 PepsiCo Inc*List Not Exhaustive
- 12.1.4.1. Company Overview
- 12.1.4.2. Products
- 12.1.4.3. Company Financials
- 12.1.4.4. SWOT Analysis
- 12.1.5 Chr Hansen Holding A/S
- 12.1.5.1. Company Overview
- 12.1.5.2. Products
- 12.1.5.3. Company Financials
- 12.1.5.4. SWOT Analysis
- 12.1.6 Groupe Danone SA
- 12.1.6.1. Company Overview
- 12.1.6.2. Products
- 12.1.6.3. Company Financials
- 12.1.6.4. SWOT Analysis
- 12.1.7 HAKKAISAN BREWERY CO LTD
- 12.1.7.1. Company Overview
- 12.1.7.2. Products
- 12.1.7.3. Company Financials
- 12.1.7.4. SWOT Analysis
- 12.1.8 Heineken NV
- 12.1.8.1. Company Overview
- 12.1.8.2. Products
- 12.1.8.3. Company Financials
- 12.1.8.4. SWOT Analysis
- 12.1.9 GT'S LIVING FOODS
- 12.1.9.1. Company Overview
- 12.1.9.2. Products
- 12.1.9.3. Company Financials
- 12.1.9.4. SWOT Analysis
- 12.1.1 Nestle SA
- 12.2. Market Entropy
- 12.2.1 Company's Key Areas Served
- 12.2.2 Recent Developments
- 12.3. Company Market Share Analysis 2025
- 12.3.1 Top 5 Companies Market Share Analysis
- 12.3.2 Top 3 Companies Market Share Analysis
- 12.4. List of Potential Customers
- 13. Research Methodology
List of Figures
- Figure 1: Global Fermented Drinks Industry in APAC Revenue Breakdown (billion, %) by Region 2025 & 2033
- Figure 2: India Fermented Drinks Industry in APAC Revenue (billion), by Type 2025 & 2033
- Figure 3: India Fermented Drinks Industry in APAC Revenue Share (%), by Type 2025 & 2033
- Figure 4: India Fermented Drinks Industry in APAC Revenue (billion), by Distribution Channel 2025 & 2033
- Figure 5: India Fermented Drinks Industry in APAC Revenue Share (%), by Distribution Channel 2025 & 2033
- Figure 6: India Fermented Drinks Industry in APAC Revenue (billion), by Geography 2025 & 2033
- Figure 7: India Fermented Drinks Industry in APAC Revenue Share (%), by Geography 2025 & 2033
- Figure 8: India Fermented Drinks Industry in APAC Revenue (billion), by Country 2025 & 2033
- Figure 9: India Fermented Drinks Industry in APAC Revenue Share (%), by Country 2025 & 2033
- Figure 10: China Fermented Drinks Industry in APAC Revenue (billion), by Type 2025 & 2033
- Figure 11: China Fermented Drinks Industry in APAC Revenue Share (%), by Type 2025 & 2033
- Figure 12: China Fermented Drinks Industry in APAC Revenue (billion), by Distribution Channel 2025 & 2033
- Figure 13: China Fermented Drinks Industry in APAC Revenue Share (%), by Distribution Channel 2025 & 2033
- Figure 14: China Fermented Drinks Industry in APAC Revenue (billion), by Geography 2025 & 2033
- Figure 15: China Fermented Drinks Industry in APAC Revenue Share (%), by Geography 2025 & 2033
- Figure 16: China Fermented Drinks Industry in APAC Revenue (billion), by Country 2025 & 2033
- Figure 17: China Fermented Drinks Industry in APAC Revenue Share (%), by Country 2025 & 2033
- Figure 18: Japan Fermented Drinks Industry in APAC Revenue (billion), by Type 2025 & 2033
- Figure 19: Japan Fermented Drinks Industry in APAC Revenue Share (%), by Type 2025 & 2033
- Figure 20: Japan Fermented Drinks Industry in APAC Revenue (billion), by Distribution Channel 2025 & 2033
- Figure 21: Japan Fermented Drinks Industry in APAC Revenue Share (%), by Distribution Channel 2025 & 2033
- Figure 22: Japan Fermented Drinks Industry in APAC Revenue (billion), by Geography 2025 & 2033
- Figure 23: Japan Fermented Drinks Industry in APAC Revenue Share (%), by Geography 2025 & 2033
- Figure 24: Japan Fermented Drinks Industry in APAC Revenue (billion), by Country 2025 & 2033
- Figure 25: Japan Fermented Drinks Industry in APAC Revenue Share (%), by Country 2025 & 2033
- Figure 26: Australia Fermented Drinks Industry in APAC Revenue (billion), by Type 2025 & 2033
- Figure 27: Australia Fermented Drinks Industry in APAC Revenue Share (%), by Type 2025 & 2033
- Figure 28: Australia Fermented Drinks Industry in APAC Revenue (billion), by Distribution Channel 2025 & 2033
- Figure 29: Australia Fermented Drinks Industry in APAC Revenue Share (%), by Distribution Channel 2025 & 2033
- Figure 30: Australia Fermented Drinks Industry in APAC Revenue (billion), by Geography 2025 & 2033
- Figure 31: Australia Fermented Drinks Industry in APAC Revenue Share (%), by Geography 2025 & 2033
- Figure 32: Australia Fermented Drinks Industry in APAC Revenue (billion), by Country 2025 & 2033
- Figure 33: Australia Fermented Drinks Industry in APAC Revenue Share (%), by Country 2025 & 2033
- Figure 34: Rest of Asia Pacific Fermented Drinks Industry in APAC Revenue (billion), by Type 2025 & 2033
- Figure 35: Rest of Asia Pacific Fermented Drinks Industry in APAC Revenue Share (%), by Type 2025 & 2033
- Figure 36: Rest of Asia Pacific Fermented Drinks Industry in APAC Revenue (billion), by Distribution Channel 2025 & 2033
- Figure 37: Rest of Asia Pacific Fermented Drinks Industry in APAC Revenue Share (%), by Distribution Channel 2025 & 2033
- Figure 38: Rest of Asia Pacific Fermented Drinks Industry in APAC Revenue (billion), by Geography 2025 & 2033
- Figure 39: Rest of Asia Pacific Fermented Drinks Industry in APAC Revenue Share (%), by Geography 2025 & 2033
- Figure 40: Rest of Asia Pacific Fermented Drinks Industry in APAC Revenue (billion), by Country 2025 & 2033
- Figure 41: Rest of Asia Pacific Fermented Drinks Industry in APAC Revenue Share (%), by Country 2025 & 2033
List of Tables
- Table 1: Global Fermented Drinks Industry in APAC Revenue billion Forecast, by Type 2020 & 2033
- Table 2: Global Fermented Drinks Industry in APAC Revenue billion Forecast, by Distribution Channel 2020 & 2033
- Table 3: Global Fermented Drinks Industry in APAC Revenue billion Forecast, by Geography 2020 & 2033
- Table 4: Global Fermented Drinks Industry in APAC Revenue billion Forecast, by Region 2020 & 2033
- Table 5: Global Fermented Drinks Industry in APAC Revenue billion Forecast, by Type 2020 & 2033
- Table 6: Global Fermented Drinks Industry in APAC Revenue billion Forecast, by Distribution Channel 2020 & 2033
- Table 7: Global Fermented Drinks Industry in APAC Revenue billion Forecast, by Geography 2020 & 2033
- Table 8: Global Fermented Drinks Industry in APAC Revenue billion Forecast, by Country 2020 & 2033
- Table 9: Global Fermented Drinks Industry in APAC Revenue billion Forecast, by Type 2020 & 2033
- Table 10: Global Fermented Drinks Industry in APAC Revenue billion Forecast, by Distribution Channel 2020 & 2033
- Table 11: Global Fermented Drinks Industry in APAC Revenue billion Forecast, by Geography 2020 & 2033
- Table 12: Global Fermented Drinks Industry in APAC Revenue billion Forecast, by Country 2020 & 2033
- Table 13: Global Fermented Drinks Industry in APAC Revenue billion Forecast, by Type 2020 & 2033
- Table 14: Global Fermented Drinks Industry in APAC Revenue billion Forecast, by Distribution Channel 2020 & 2033
- Table 15: Global Fermented Drinks Industry in APAC Revenue billion Forecast, by Geography 2020 & 2033
- Table 16: Global Fermented Drinks Industry in APAC Revenue billion Forecast, by Country 2020 & 2033
- Table 17: Global Fermented Drinks Industry in APAC Revenue billion Forecast, by Type 2020 & 2033
- Table 18: Global Fermented Drinks Industry in APAC Revenue billion Forecast, by Distribution Channel 2020 & 2033
- Table 19: Global Fermented Drinks Industry in APAC Revenue billion Forecast, by Geography 2020 & 2033
- Table 20: Global Fermented Drinks Industry in APAC Revenue billion Forecast, by Country 2020 & 2033
- Table 21: Global Fermented Drinks Industry in APAC Revenue billion Forecast, by Type 2020 & 2033
- Table 22: Global Fermented Drinks Industry in APAC Revenue billion Forecast, by Distribution Channel 2020 & 2033
- Table 23: Global Fermented Drinks Industry in APAC Revenue billion Forecast, by Geography 2020 & 2033
- Table 24: Global Fermented Drinks Industry in APAC Revenue billion Forecast, by Country 2020 & 2033
Frequently Asked Questions
1. What is the projected Compound Annual Growth Rate (CAGR) of the Fermented Drinks Industry in APAC?
The projected CAGR is approximately 6.2%.
2. Which companies are prominent players in the Fermented Drinks Industry in APAC?
Key companies in the market include Nestle SA, ASAHI GROUP HOLDINGS LTD, Yakult Honsha Co Ltd, PepsiCo Inc*List Not Exhaustive, Chr Hansen Holding A/S, Groupe Danone SA, HAKKAISAN BREWERY CO LTD, Heineken NV, GT'S LIVING FOODS.
3. What are the main segments of the Fermented Drinks Industry in APAC?
The market segments include Type, Distribution Channel, Geography.
4. Can you provide details about the market size?
The market size is estimated to be USD 1010.2 billion as of 2022.
5. What are some drivers contributing to market growth?
Government Initiatives and E-commerce Penetration.
6. What are the notable trends driving market growth?
Increase in Demand for Functional Beverages.
7. Are there any restraints impacting market growth?
Detrimental Health Impact of Caffeine Intake.
8. Can you provide examples of recent developments in the market?
N/A
9. What pricing options are available for accessing the report?
Pricing options include single-user, multi-user, and enterprise licenses priced at USD 4750, USD 5250, and USD 8750 respectively.
10. Is the market size provided in terms of value or volume?
The market size is provided in terms of value, measured in billion.
11. Are there any specific market keywords associated with the report?
Yes, the market keyword associated with the report is "Fermented Drinks Industry in APAC," which aids in identifying and referencing the specific market segment covered.
12. How do I determine which pricing option suits my needs best?
The pricing options vary based on user requirements and access needs. Individual users may opt for single-user licenses, while businesses requiring broader access may choose multi-user or enterprise licenses for cost-effective access to the report.
13. Are there any additional resources or data provided in the Fermented Drinks Industry in APAC report?
While the report offers comprehensive insights, it's advisable to review the specific contents or supplementary materials provided to ascertain if additional resources or data are available.
14. How can I stay updated on further developments or reports in the Fermented Drinks Industry in APAC?
To stay informed about further developments, trends, and reports in the Fermented Drinks Industry in APAC, consider subscribing to industry newsletters, following relevant companies and organizations, or regularly checking reputable industry news sources and publications.
Methodology
Step 1 - Identification of Relevant Samples Size from Population Database


Step 2 - Approaches for Defining Global Market Size (Value, Volume* & Price*)

Note*: In applicable scenarios
Step 3 - Data Sources
Primary Research
- Web Analytics
- Survey Reports
- Research Institute
- Latest Research Reports
- Opinion Leaders
Secondary Research
- Annual Reports
- White Paper
- Latest Press Release
- Industry Association
- Paid Database
- Investor Presentations

Step 4 - Data Triangulation
Involves using different sources of information in order to increase the validity of a study
These sources are likely to be stakeholders in a program - participants, other researchers, program staff, other community members, and so on.
Then we put all data in single framework & apply various statistical tools to find out the dynamic on the market.
During the analysis stage, feedback from the stakeholder groups would be compared to determine areas of agreement as well as areas of divergence