

Key Insights
The global Eye Drops Market is forecast to experience significant growth, with a projected Compound Annual Growth Rate (CAGR) of 4.7%. Valued at $18.1 billion in the base year of 2025, the market is expected to expand substantially through 2033. This expansion is driven by the rising incidence of ocular conditions such as allergic conjunctivitis, dry eye syndrome, and infections. Key growth catalysts include an aging demographic, increased digital screen usage contributing to digital eye strain, and heightened awareness of eye health. The market is segmented by drug class, including Antihistamines, Non-steroidal Anti-Inflammatory Drugs (NSAIDs), and Vasoconstrictors, alongside specialized formulations. Therapeutic applications like Seasonal and Perennial Allergic Conjunctivitis and Dry Eye Syndrome are prominent, followed by conditions such as Vernal Keratoconjunctivitis and Atopic Keratoconjunctivitis.
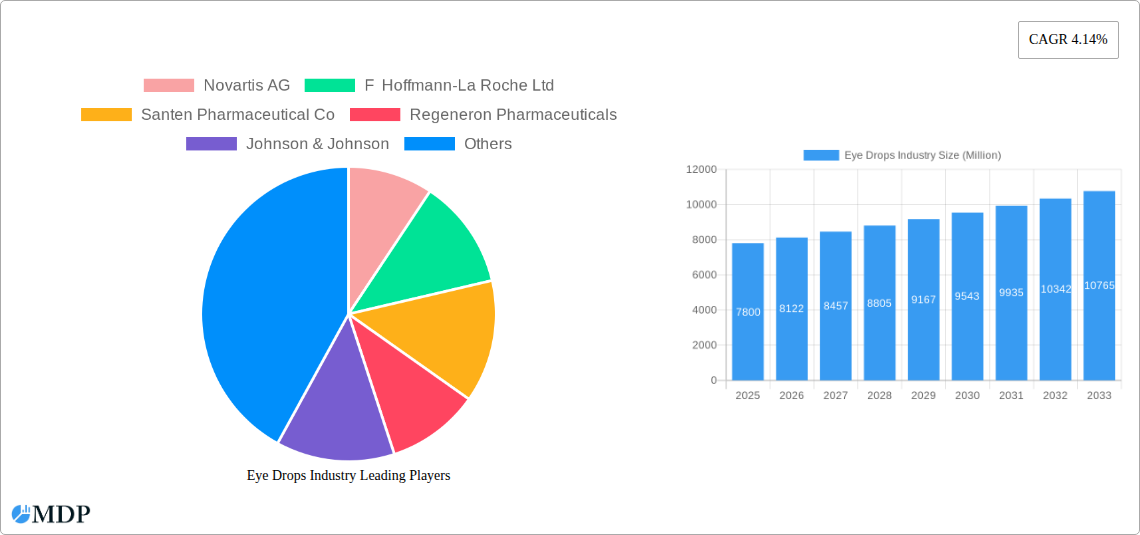
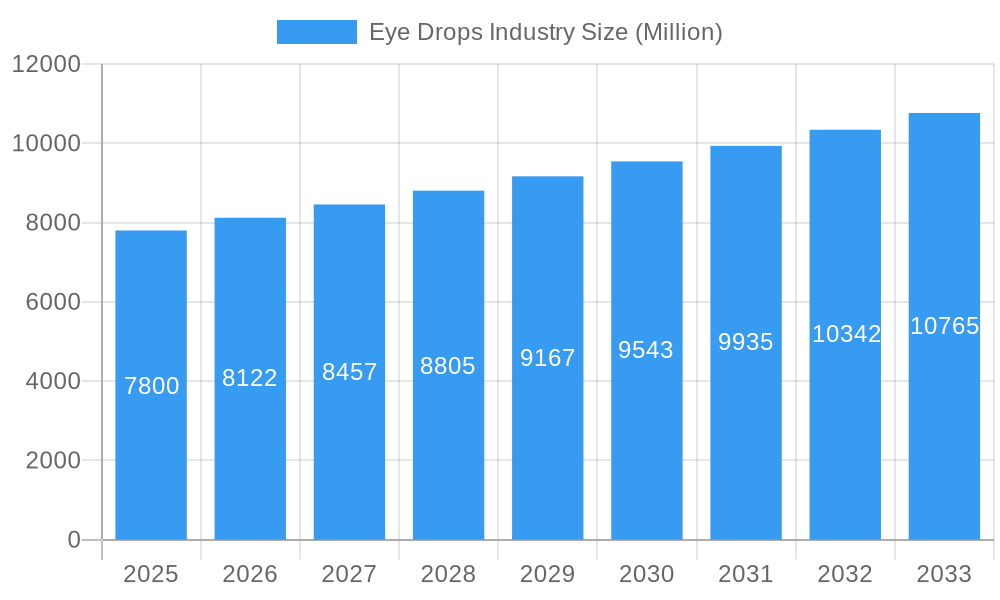
Eye Drops Industry Market Size (In Billion)
Leading companies including Novartis AG, F Hoffmann-La Roche Ltd, Santen Pharmaceutical Co., Regeneron Pharmaceuticals, Johnson & Johnson, AbbVie Inc. (Allergan Plc), Bausch Health Companies Inc., and Pfizer Inc. are actively engaged in R&D, introducing advanced formulations for enhanced efficacy and patient comfort. Market growth is further supported by innovations in drug delivery systems and the availability of both prescription and over-the-counter (OTC) eye drop options. Geographically, North America and Europe currently lead the market, attributed to robust healthcare infrastructure, high disposable incomes, and a strong focus on eye care. The Asia Pacific region is poised for the fastest growth, fueled by escalating healthcare spending, a vast patient population, and increasing awareness of ocular health. Despite potential challenges such as stringent regulatory approvals and the risk of side effects with prolonged use, the Eye Drops Market exhibits a highly positive outlook, underpinned by unmet medical needs and continuous product innovation.
Eye Drops Industry Company Market Share
Unlocking the Future of Ocular Health: Comprehensive Eye Drops Industry Market Report (2019-2033)
Dive deep into the dynamic and rapidly evolving eye drops market with this in-depth industry analysis. This comprehensive report, spanning from 2019 to 2033, provides critical insights for pharmaceutical manufacturers, investors, researchers, and healthcare providers navigating the complexities of ocular therapeutics. We forecast the market value to reach USD 25 Billion by 2025, with a projected Compound Annual Growth Rate (CAGR) of 6.5% during the forecast period (2025-2033). This report offers actionable intelligence on allergy eye drops, dry eye treatments, prescription eye drops, and over-the-counter eye drops, utilizing extensive research and granular data from the historical period (2019-2024) to the projected future.
Eye Drops Industry Market Dynamics & Concentration
The eye drops industry is characterized by moderate to high concentration, with key players like Novartis AG, F Hoffmann-La Roche Ltd, Santen Pharmaceutical Co, Regeneron Pharmaceuticals, Johnson & Johnson, AbbVie Inc (Allergan Plc), Bausch Health Companies Inc, and Pfizer Inc holding significant market share. Innovation is a primary driver, fueled by advancements in drug delivery systems and the development of novel therapeutic agents targeting a wide range of ophthalmic conditions. Regulatory frameworks, established by bodies like the FDA and EMA, play a crucial role in product approvals and market access, influencing product development timelines and strategies. The threat of product substitutes, while present in the form of alternative therapies or surgical interventions, remains relatively low for common ocular ailments addressed by eye drops. End-user trends highlight a growing demand for convenient, effective, and accessible treatments for conditions such as allergic conjunctivitis, dry eye syndrome, and glaucoma. Mergers and Acquisitions (M&A) activities are strategically employed by leading companies to expand their product portfolios, gain access to new technologies, and consolidate market positions. For instance, the market witnessed an average of 15 M&A deals annually during the historical period (2019-2024), with an estimated combined deal value exceeding USD 3 Billion. The market share distribution indicates that the top 5 players collectively command approximately 60% of the global eye drops market.
Eye Drops Industry Industry Trends & Analysis
The eye drops industry is experiencing robust growth driven by an increasing prevalence of ophthalmic disorders, particularly dry eye disease and allergic conjunctivitis, coupled with a rapidly aging global population. Technological disruptions are revolutionizing product development, with a focus on preservative-free formulations, sustained-release drug delivery systems, and innovative ophthalmic solutions for enhanced patient compliance and therapeutic efficacy. Consumer preferences are shifting towards over-the-counter (OTC) options for milder conditions, while the demand for specialized prescription eye drops for chronic and severe ophthalmic diseases continues to rise. The competitive dynamics are intense, with companies investing heavily in research and development to launch differentiated products and secure intellectual property. Market penetration for advanced eye drop formulations is expected to reach 70% by 2025, signifying a substantial adoption rate. The CAGR for the eye drops market is projected at a healthy 6.5% from 2025 to 2033. Key market growth drivers include the rising incidence of digital eye strain, the growing awareness of eye health, and the expansion of healthcare access in emerging economies. Furthermore, the increasing incidence of eye infections and post-operative care requirements also contribute significantly to market expansion. The global eye drops market size was estimated at USD 20 Billion in 2024 and is poised for significant growth.
Leading Markets & Segments in Eye Drops Industry
The North America region is the dominant market for eye drops, driven by a high prevalence of ocular diseases, advanced healthcare infrastructure, and significant R&D investments. Within North America, the United States stands as the largest single country market, accounting for approximately 40% of the global eye drops revenue.
Dominance by Drug Class:
- Antihistamines: This segment holds a substantial market share, estimated at 35%, due to the widespread prevalence of allergic conjunctivitis. Factors contributing to this dominance include the increasing incidence of seasonal allergies and the availability of effective OTC and prescription antihistamine eye drops.
- Vasoconstrictors: While historically significant, this segment is experiencing a gradual decline in market share, now estimated at 15%, due to concerns regarding rebound hyperemia and long-term side effects. However, they remain crucial for immediate relief in certain inflammatory conditions.
- Non-steroidal Anti-Inflammatory Drugs (NSAIDs): This segment, holding around 25% of the market, is crucial for managing inflammatory conditions such as post-operative inflammation and certain types of keratitis.
- Others: This includes lubricants, antibiotics, antifungals, glaucoma medications, and specialty ophthalmic solutions, collectively representing the remaining 25% of the market. This segment is poised for significant growth due to advancements in treating chronic eye diseases.
Dominance by Type:
- Seasonal and Perennial Allergic Conjunctivitis: This segment is the largest revenue generator, accounting for over 45% of the total market. The increasing prevalence of environmental allergens and the growing demand for targeted allergy relief are key drivers.
- Dry Eye Syndrome (Implied within Others/Lubricants): While not explicitly listed as a "Type," the management of dry eye syndrome is a major market driver, often addressed by lubricating eye drops and other specialized formulations. The rising prevalence of digital device usage contributes to a significant demand in this area.
- Vernal Keratoconjunctivitis (VKC) and Atopic Keratoconjunctivitis (AKC): These segments, while smaller, are critical for specialized treatments and are growing due to increased diagnosis and targeted therapeutic development. VKC accounts for approximately 10% of the market, while AKC represents around 15%.
- Giant Papillary Conjunctivitis (GPC): This segment, often associated with contact lens wear, holds a smaller but significant share of around 5%.
- Others: This broad category includes treatments for infections, glaucoma, post-operative care, and dry eye, representing a substantial 20% of the market and showing significant growth potential.
Key drivers for dominance in these segments include increasing disposable incomes, rising healthcare expenditure, a growing awareness of eye health, and the introduction of innovative treatments by major pharmaceutical companies. Economic policies supporting R&D and healthcare access further bolster market expansion.
Eye Drops Industry Product Developments
Product developments in the eye drops industry are largely focused on enhancing efficacy, safety, and patient convenience. Innovations include the advancement of preservative-free formulations to mitigate ocular surface toxicity, particularly for dry eye patients. Sustained-release drug delivery systems are emerging, aiming to reduce the frequency of administration and improve patient adherence for chronic conditions like glaucoma. Novel therapeutic molecules targeting specific inflammatory pathways and gene therapies for rare ophthalmic diseases represent the cutting edge of research. Competitive advantages are gained through superior bioequivalence, reduced side effects, and innovative packaging that ensures sterility and ease of use. The market is witnessing a surge in advanced formulations for treating persistent dry eye and managing allergic conjunctivitis, with a strong emphasis on therapeutic outcomes and patient quality of life.
Key Drivers of Eye Drops Industry Growth
The eye drops industry is propelled by a confluence of factors driving its substantial growth. A primary driver is the escalating prevalence of ocular diseases, including dry eye syndrome, allergic conjunctivitis, and glaucoma, exacerbated by an aging population and increased screen time. Technological advancements in pharmaceutical formulation and drug delivery systems are enabling the development of more effective and patient-friendly eye drops, such as preservative-free solutions and sustained-release technologies. Favorable regulatory pathways for novel ophthalmic treatments also encourage innovation. Furthermore, rising healthcare expenditure globally and increased patient awareness regarding eye health contribute significantly to market expansion. The economic imperative to manage chronic conditions efficiently also favors the adoption of advanced eye drop therapies.
Challenges in the Eye Drops Industry Market
Despite its robust growth trajectory, the eye drops industry faces several challenges. Stringent regulatory approval processes for new ophthalmic drugs can lead to lengthy development timelines and substantial R&D costs, impacting market entry. Supply chain disruptions, as witnessed in recent global events, can affect the availability and affordability of raw materials and finished products. Intense competition among established players and emerging biopharmaceutical companies necessitates continuous innovation and competitive pricing strategies, which can compress profit margins. Furthermore, issues related to product counterfeiting and the risk of antibiotic resistance with overuse of certain eye drops pose significant hurdles to market sustainability and public health.
Emerging Opportunities in Eye Drops Industry
The eye drops industry is ripe with emerging opportunities driven by unmet medical needs and technological breakthroughs. The development of novel treatments for age-related macular degeneration (AMD) and diabetic retinopathy, delivered via advanced ophthalmic solutions, presents a significant growth avenue. Strategic partnerships between pharmaceutical giants and biotech startups specializing in gene therapy and precision medicine are poised to unlock revolutionary treatments for rare ophthalmic diseases. The expansion of telehealth and remote patient monitoring platforms offers new avenues for prescribing and managing eye drop therapies, particularly for chronic conditions. Furthermore, the growing demand for personalized medicine in ophthalmology, tailoring treatments to individual patient profiles, represents a significant long-term growth catalyst.
Leading Players in the Eye Drops Industry Sector
- Novartis AG
- F Hoffmann-La Roche Ltd
- Santen Pharmaceutical Co
- Regeneron Pharmaceuticals
- Johnson & Johnson
- AbbVie Inc (Allergan Plc)
- Bausch Health Companies Inc
- Pfizer Inc
Key Milestones in Eye Drops Industry Industry
- May 2022: Santen Inc., the United States subsidiary of Santen Pharmaceutical Co., Ltd., announced the release of Verkazia (cyclosporine ophthalmic emulsion) 0.1% in the United States for the treatment of vernal keratoconjunctivitis (VKC) eye allergy. This launch significantly expanded treatment options for a specific segment of allergic eye disease.
- March 2022: AbbVie Inc. (Allergan Plc) announced that LASTACAFT (alcaftadine ophthalmic solution 0.25%) is available without a prescription for the estimated 40 percent of Americans living with ocular allergies. This move democratized access to effective allergy eye relief and boosted the OTC segment.
Strategic Outlook for Eye Drops Industry Market
The strategic outlook for the eye drops industry remains highly positive, driven by continued innovation and expanding market access. Companies are focusing on developing next-generation therapies for chronic ocular diseases, including sustained-release formulations and gene-based interventions. Strategic collaborations and acquisitions will continue to be pivotal for consolidating market share and accessing novel technologies. The increasing penetration of OTC products for common eye conditions, coupled with the demand for specialized prescription treatments, presents a dual growth opportunity. Furthermore, the growing emphasis on patient-centric care and the integration of digital health solutions will shape future market strategies, ensuring sustained growth and the advancement of ocular health solutions globally.
Eye Drops Industry Segmentation
-
1. Drug Class
- 1.1. Antihistamines
- 1.2. Non-steroidal anti-Inflammatory Drugs
- 1.3. Vasoconstrictors
- 1.4. Others
-
2. Type
- 2.1. Seasonal and Perennial Allergic Conjunctivitis
- 2.2. Vernal Keratoconjunctivitis
- 2.3. Atopic Keratoconjunctivitis
- 2.4. Giant Papillary Conjunctivitis
- 2.5. Others
Eye Drops Industry Segmentation By Geography
-
1. North America
- 1.1. United States
- 1.2. Canada
- 1.3. Mexico
-
2. Europe
- 2.1. Germany
- 2.2. United Kingdom
- 2.3. France
- 2.4. Italy
- 2.5. Spain
- 2.6. Rest of Europe
-
3. Asia Pacific
- 3.1. China
- 3.2. Japan
- 3.3. India
- 3.4. Australia
- 3.5. South Korea
- 3.6. Rest of Asia Pacific
-
4. Middle East and Africa
- 4.1. GCC
- 4.2. South Africa
- 4.3. Rest of Middle East and Africa
-
5. South America
- 5.1. Brazil
- 5.2. Argentina
- 5.3. Rest of South America
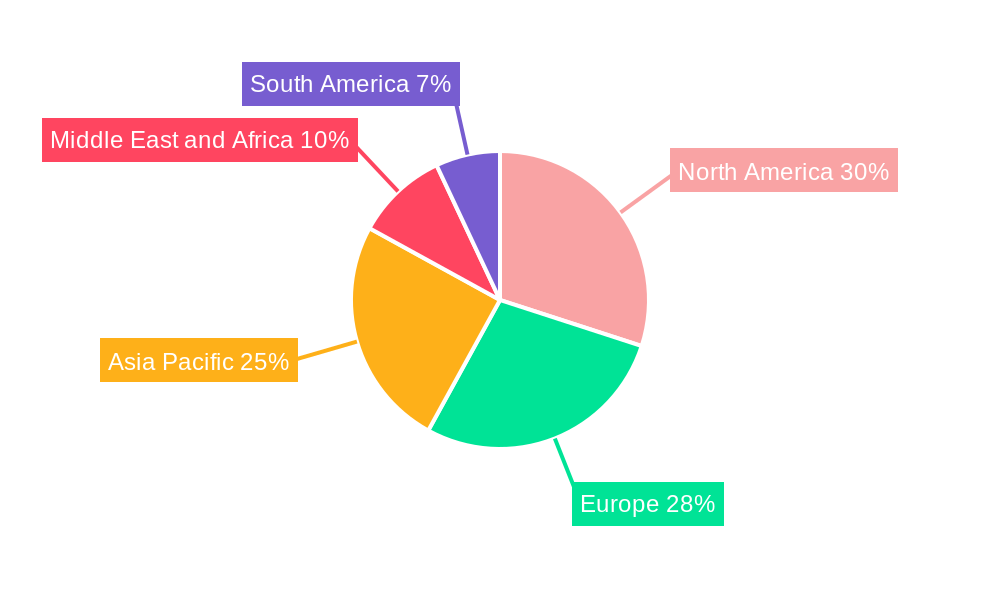
Eye Drops Industry Regional Market Share
Geographic Coverage of Eye Drops Industry
Eye Drops Industry REPORT HIGHLIGHTS
| Aspects | Details |
|---|---|
| Study Period | 2020-2034 |
| Base Year | 2025 |
| Estimated Year | 2026 |
| Forecast Period | 2026-2034 |
| Historical Period | 2020-2025 |
| Growth Rate | CAGR of 4.7% from 2020-2034 |
| Segmentation |
|
Table of Contents
- 1. Introduction
- 1.1. Research Scope
- 1.2. Market Segmentation
- 1.3. Research Objective
- 1.4. Definitions and Assumptions
- 2. Executive Summary
- 2.1. Market Snapshot
- 3. Market Dynamics
- 3.1. Market Drivers
- 3.2. Market Restrains
- 3.3. Market Trends
- 3.4. Market Opportunities
- 4. Market Factor Analysis
- 4.1. Porters Five Forces
- 4.1.1. Bargaining Power of Suppliers
- 4.1.2. Bargaining Power of Buyers
- 4.1.3. Threat of New Entrants
- 4.1.4. Threat of Substitutes
- 4.1.5. Competitive Rivalry
- 4.2. PESTEL analysis
- 4.3. BCG Analysis
- 4.3.1. Stars (High Growth, High Market Share)
- 4.3.2. Cash Cows (Low Growth, High Market Share)
- 4.3.3. Question Mark (High Growth, Low Market Share)
- 4.3.4. Dogs (Low Growth, Low Market Share)
- 4.4. Ansoff Matrix Analysis
- 4.5. Supply Chain Analysis
- 4.6. Regulatory Landscape
- 4.7. Current Market Potential and Opportunity Assessment (TAM–SAM–SOM Framework)
- 4.8. MDP Analyst Note
- 4.1. Porters Five Forces
- 5. Market Analysis, Insights and Forecast 2021-2033
- 5.1. Market Analysis, Insights and Forecast - by Drug Class
- 5.1.1. Antihistamines
- 5.1.2. Non-steroidal anti-Inflammatory Drugs
- 5.1.3. Vasoconstrictors
- 5.1.4. Others
- 5.2. Market Analysis, Insights and Forecast - by Type
- 5.2.1. Seasonal and Perennial Allergic Conjunctivitis
- 5.2.2. Vernal Keratoconjunctivitis
- 5.2.3. Atopic Keratoconjunctivitis
- 5.2.4. Giant Papillary Conjunctivitis
- 5.2.5. Others
- 5.3. Market Analysis, Insights and Forecast - by Region
- 5.3.1. North America
- 5.3.2. Europe
- 5.3.3. Asia Pacific
- 5.3.4. Middle East and Africa
- 5.3.5. South America
- 5.1. Market Analysis, Insights and Forecast - by Drug Class
- 6. Global Eye Drops Industry Analysis, Insights and Forecast, 2021-2033
- 6.1. Market Analysis, Insights and Forecast - by Drug Class
- 6.1.1. Antihistamines
- 6.1.2. Non-steroidal anti-Inflammatory Drugs
- 6.1.3. Vasoconstrictors
- 6.1.4. Others
- 6.2. Market Analysis, Insights and Forecast - by Type
- 6.2.1. Seasonal and Perennial Allergic Conjunctivitis
- 6.2.2. Vernal Keratoconjunctivitis
- 6.2.3. Atopic Keratoconjunctivitis
- 6.2.4. Giant Papillary Conjunctivitis
- 6.2.5. Others
- 6.1. Market Analysis, Insights and Forecast - by Drug Class
- 7. North America Eye Drops Industry Analysis, Insights and Forecast, 2020-2032
- 7.1. Market Analysis, Insights and Forecast - by Drug Class
- 7.1.1. Antihistamines
- 7.1.2. Non-steroidal anti-Inflammatory Drugs
- 7.1.3. Vasoconstrictors
- 7.1.4. Others
- 7.2. Market Analysis, Insights and Forecast - by Type
- 7.2.1. Seasonal and Perennial Allergic Conjunctivitis
- 7.2.2. Vernal Keratoconjunctivitis
- 7.2.3. Atopic Keratoconjunctivitis
- 7.2.4. Giant Papillary Conjunctivitis
- 7.2.5. Others
- 7.1. Market Analysis, Insights and Forecast - by Drug Class
- 8. Europe Eye Drops Industry Analysis, Insights and Forecast, 2020-2032
- 8.1. Market Analysis, Insights and Forecast - by Drug Class
- 8.1.1. Antihistamines
- 8.1.2. Non-steroidal anti-Inflammatory Drugs
- 8.1.3. Vasoconstrictors
- 8.1.4. Others
- 8.2. Market Analysis, Insights and Forecast - by Type
- 8.2.1. Seasonal and Perennial Allergic Conjunctivitis
- 8.2.2. Vernal Keratoconjunctivitis
- 8.2.3. Atopic Keratoconjunctivitis
- 8.2.4. Giant Papillary Conjunctivitis
- 8.2.5. Others
- 8.1. Market Analysis, Insights and Forecast - by Drug Class
- 9. Asia Pacific Eye Drops Industry Analysis, Insights and Forecast, 2020-2032
- 9.1. Market Analysis, Insights and Forecast - by Drug Class
- 9.1.1. Antihistamines
- 9.1.2. Non-steroidal anti-Inflammatory Drugs
- 9.1.3. Vasoconstrictors
- 9.1.4. Others
- 9.2. Market Analysis, Insights and Forecast - by Type
- 9.2.1. Seasonal and Perennial Allergic Conjunctivitis
- 9.2.2. Vernal Keratoconjunctivitis
- 9.2.3. Atopic Keratoconjunctivitis
- 9.2.4. Giant Papillary Conjunctivitis
- 9.2.5. Others
- 9.1. Market Analysis, Insights and Forecast - by Drug Class
- 10. Middle East and Africa Eye Drops Industry Analysis, Insights and Forecast, 2020-2032
- 10.1. Market Analysis, Insights and Forecast - by Drug Class
- 10.1.1. Antihistamines
- 10.1.2. Non-steroidal anti-Inflammatory Drugs
- 10.1.3. Vasoconstrictors
- 10.1.4. Others
- 10.2. Market Analysis, Insights and Forecast - by Type
- 10.2.1. Seasonal and Perennial Allergic Conjunctivitis
- 10.2.2. Vernal Keratoconjunctivitis
- 10.2.3. Atopic Keratoconjunctivitis
- 10.2.4. Giant Papillary Conjunctivitis
- 10.2.5. Others
- 10.1. Market Analysis, Insights and Forecast - by Drug Class
- 11. South America Eye Drops Industry Analysis, Insights and Forecast, 2020-2032
- 11.1. Market Analysis, Insights and Forecast - by Drug Class
- 11.1.1. Antihistamines
- 11.1.2. Non-steroidal anti-Inflammatory Drugs
- 11.1.3. Vasoconstrictors
- 11.1.4. Others
- 11.2. Market Analysis, Insights and Forecast - by Type
- 11.2.1. Seasonal and Perennial Allergic Conjunctivitis
- 11.2.2. Vernal Keratoconjunctivitis
- 11.2.3. Atopic Keratoconjunctivitis
- 11.2.4. Giant Papillary Conjunctivitis
- 11.2.5. Others
- 11.1. Market Analysis, Insights and Forecast - by Drug Class
- 12. Competitive Analysis
- 12.1. Company Profiles
- 12.1.1 Novartis AG
- 12.1.1.1. Company Overview
- 12.1.1.2. Products
- 12.1.1.3. Company Financials
- 12.1.1.4. SWOT Analysis
- 12.1.2 F Hoffmann-La Roche Ltd
- 12.1.2.1. Company Overview
- 12.1.2.2. Products
- 12.1.2.3. Company Financials
- 12.1.2.4. SWOT Analysis
- 12.1.3 Santen Pharmaceutical Co
- 12.1.3.1. Company Overview
- 12.1.3.2. Products
- 12.1.3.3. Company Financials
- 12.1.3.4. SWOT Analysis
- 12.1.4 Regeneron Pharmaceuticals
- 12.1.4.1. Company Overview
- 12.1.4.2. Products
- 12.1.4.3. Company Financials
- 12.1.4.4. SWOT Analysis
- 12.1.5 Johnson & Johnson
- 12.1.5.1. Company Overview
- 12.1.5.2. Products
- 12.1.5.3. Company Financials
- 12.1.5.4. SWOT Analysis
- 12.1.6 AbbVie Inc (Allergan Plc)
- 12.1.6.1. Company Overview
- 12.1.6.2. Products
- 12.1.6.3. Company Financials
- 12.1.6.4. SWOT Analysis
- 12.1.7 Bausch Health Companies Inc
- 12.1.7.1. Company Overview
- 12.1.7.2. Products
- 12.1.7.3. Company Financials
- 12.1.7.4. SWOT Analysis
- 12.1.8 Pfizer Inc
- 12.1.8.1. Company Overview
- 12.1.8.2. Products
- 12.1.8.3. Company Financials
- 12.1.8.4. SWOT Analysis
- 12.1.1 Novartis AG
- 12.2. Market Entropy
- 12.2.1 Company's Key Areas Served
- 12.2.2 Recent Developments
- 12.3. Company Market Share Analysis 2025
- 12.3.1 Top 5 Companies Market Share Analysis
- 12.3.2 Top 3 Companies Market Share Analysis
- 12.4. List of Potential Customers
- 13. Research Methodology
List of Figures
- Figure 1: Global Eye Drops Industry Revenue Breakdown (billion, %) by Region 2025 & 2033
- Figure 2: Global Eye Drops Industry Volume Breakdown (K Unit, %) by Region 2025 & 2033
- Figure 3: North America Eye Drops Industry Revenue (billion), by Drug Class 2025 & 2033
- Figure 4: North America Eye Drops Industry Volume (K Unit), by Drug Class 2025 & 2033
- Figure 5: North America Eye Drops Industry Revenue Share (%), by Drug Class 2025 & 2033
- Figure 6: North America Eye Drops Industry Volume Share (%), by Drug Class 2025 & 2033
- Figure 7: North America Eye Drops Industry Revenue (billion), by Type 2025 & 2033
- Figure 8: North America Eye Drops Industry Volume (K Unit), by Type 2025 & 2033
- Figure 9: North America Eye Drops Industry Revenue Share (%), by Type 2025 & 2033
- Figure 10: North America Eye Drops Industry Volume Share (%), by Type 2025 & 2033
- Figure 11: North America Eye Drops Industry Revenue (billion), by Country 2025 & 2033
- Figure 12: North America Eye Drops Industry Volume (K Unit), by Country 2025 & 2033
- Figure 13: North America Eye Drops Industry Revenue Share (%), by Country 2025 & 2033
- Figure 14: North America Eye Drops Industry Volume Share (%), by Country 2025 & 2033
- Figure 15: Europe Eye Drops Industry Revenue (billion), by Drug Class 2025 & 2033
- Figure 16: Europe Eye Drops Industry Volume (K Unit), by Drug Class 2025 & 2033
- Figure 17: Europe Eye Drops Industry Revenue Share (%), by Drug Class 2025 & 2033
- Figure 18: Europe Eye Drops Industry Volume Share (%), by Drug Class 2025 & 2033
- Figure 19: Europe Eye Drops Industry Revenue (billion), by Type 2025 & 2033
- Figure 20: Europe Eye Drops Industry Volume (K Unit), by Type 2025 & 2033
- Figure 21: Europe Eye Drops Industry Revenue Share (%), by Type 2025 & 2033
- Figure 22: Europe Eye Drops Industry Volume Share (%), by Type 2025 & 2033
- Figure 23: Europe Eye Drops Industry Revenue (billion), by Country 2025 & 2033
- Figure 24: Europe Eye Drops Industry Volume (K Unit), by Country 2025 & 2033
- Figure 25: Europe Eye Drops Industry Revenue Share (%), by Country 2025 & 2033
- Figure 26: Europe Eye Drops Industry Volume Share (%), by Country 2025 & 2033
- Figure 27: Asia Pacific Eye Drops Industry Revenue (billion), by Drug Class 2025 & 2033
- Figure 28: Asia Pacific Eye Drops Industry Volume (K Unit), by Drug Class 2025 & 2033
- Figure 29: Asia Pacific Eye Drops Industry Revenue Share (%), by Drug Class 2025 & 2033
- Figure 30: Asia Pacific Eye Drops Industry Volume Share (%), by Drug Class 2025 & 2033
- Figure 31: Asia Pacific Eye Drops Industry Revenue (billion), by Type 2025 & 2033
- Figure 32: Asia Pacific Eye Drops Industry Volume (K Unit), by Type 2025 & 2033
- Figure 33: Asia Pacific Eye Drops Industry Revenue Share (%), by Type 2025 & 2033
- Figure 34: Asia Pacific Eye Drops Industry Volume Share (%), by Type 2025 & 2033
- Figure 35: Asia Pacific Eye Drops Industry Revenue (billion), by Country 2025 & 2033
- Figure 36: Asia Pacific Eye Drops Industry Volume (K Unit), by Country 2025 & 2033
- Figure 37: Asia Pacific Eye Drops Industry Revenue Share (%), by Country 2025 & 2033
- Figure 38: Asia Pacific Eye Drops Industry Volume Share (%), by Country 2025 & 2033
- Figure 39: Middle East and Africa Eye Drops Industry Revenue (billion), by Drug Class 2025 & 2033
- Figure 40: Middle East and Africa Eye Drops Industry Volume (K Unit), by Drug Class 2025 & 2033
- Figure 41: Middle East and Africa Eye Drops Industry Revenue Share (%), by Drug Class 2025 & 2033
- Figure 42: Middle East and Africa Eye Drops Industry Volume Share (%), by Drug Class 2025 & 2033
- Figure 43: Middle East and Africa Eye Drops Industry Revenue (billion), by Type 2025 & 2033
- Figure 44: Middle East and Africa Eye Drops Industry Volume (K Unit), by Type 2025 & 2033
- Figure 45: Middle East and Africa Eye Drops Industry Revenue Share (%), by Type 2025 & 2033
- Figure 46: Middle East and Africa Eye Drops Industry Volume Share (%), by Type 2025 & 2033
- Figure 47: Middle East and Africa Eye Drops Industry Revenue (billion), by Country 2025 & 2033
- Figure 48: Middle East and Africa Eye Drops Industry Volume (K Unit), by Country 2025 & 2033
- Figure 49: Middle East and Africa Eye Drops Industry Revenue Share (%), by Country 2025 & 2033
- Figure 50: Middle East and Africa Eye Drops Industry Volume Share (%), by Country 2025 & 2033
- Figure 51: South America Eye Drops Industry Revenue (billion), by Drug Class 2025 & 2033
- Figure 52: South America Eye Drops Industry Volume (K Unit), by Drug Class 2025 & 2033
- Figure 53: South America Eye Drops Industry Revenue Share (%), by Drug Class 2025 & 2033
- Figure 54: South America Eye Drops Industry Volume Share (%), by Drug Class 2025 & 2033
- Figure 55: South America Eye Drops Industry Revenue (billion), by Type 2025 & 2033
- Figure 56: South America Eye Drops Industry Volume (K Unit), by Type 2025 & 2033
- Figure 57: South America Eye Drops Industry Revenue Share (%), by Type 2025 & 2033
- Figure 58: South America Eye Drops Industry Volume Share (%), by Type 2025 & 2033
- Figure 59: South America Eye Drops Industry Revenue (billion), by Country 2025 & 2033
- Figure 60: South America Eye Drops Industry Volume (K Unit), by Country 2025 & 2033
- Figure 61: South America Eye Drops Industry Revenue Share (%), by Country 2025 & 2033
- Figure 62: South America Eye Drops Industry Volume Share (%), by Country 2025 & 2033
List of Tables
- Table 1: Global Eye Drops Industry Revenue billion Forecast, by Drug Class 2020 & 2033
- Table 2: Global Eye Drops Industry Volume K Unit Forecast, by Drug Class 2020 & 2033
- Table 3: Global Eye Drops Industry Revenue billion Forecast, by Type 2020 & 2033
- Table 4: Global Eye Drops Industry Volume K Unit Forecast, by Type 2020 & 2033
- Table 5: Global Eye Drops Industry Revenue billion Forecast, by Region 2020 & 2033
- Table 6: Global Eye Drops Industry Volume K Unit Forecast, by Region 2020 & 2033
- Table 7: Global Eye Drops Industry Revenue billion Forecast, by Drug Class 2020 & 2033
- Table 8: Global Eye Drops Industry Volume K Unit Forecast, by Drug Class 2020 & 2033
- Table 9: Global Eye Drops Industry Revenue billion Forecast, by Type 2020 & 2033
- Table 10: Global Eye Drops Industry Volume K Unit Forecast, by Type 2020 & 2033
- Table 11: Global Eye Drops Industry Revenue billion Forecast, by Country 2020 & 2033
- Table 12: Global Eye Drops Industry Volume K Unit Forecast, by Country 2020 & 2033
- Table 13: United States Eye Drops Industry Revenue (billion) Forecast, by Application 2020 & 2033
- Table 14: United States Eye Drops Industry Volume (K Unit) Forecast, by Application 2020 & 2033
- Table 15: Canada Eye Drops Industry Revenue (billion) Forecast, by Application 2020 & 2033
- Table 16: Canada Eye Drops Industry Volume (K Unit) Forecast, by Application 2020 & 2033
- Table 17: Mexico Eye Drops Industry Revenue (billion) Forecast, by Application 2020 & 2033
- Table 18: Mexico Eye Drops Industry Volume (K Unit) Forecast, by Application 2020 & 2033
- Table 19: Global Eye Drops Industry Revenue billion Forecast, by Drug Class 2020 & 2033
- Table 20: Global Eye Drops Industry Volume K Unit Forecast, by Drug Class 2020 & 2033
- Table 21: Global Eye Drops Industry Revenue billion Forecast, by Type 2020 & 2033
- Table 22: Global Eye Drops Industry Volume K Unit Forecast, by Type 2020 & 2033
- Table 23: Global Eye Drops Industry Revenue billion Forecast, by Country 2020 & 2033
- Table 24: Global Eye Drops Industry Volume K Unit Forecast, by Country 2020 & 2033
- Table 25: Germany Eye Drops Industry Revenue (billion) Forecast, by Application 2020 & 2033
- Table 26: Germany Eye Drops Industry Volume (K Unit) Forecast, by Application 2020 & 2033
- Table 27: United Kingdom Eye Drops Industry Revenue (billion) Forecast, by Application 2020 & 2033
- Table 28: United Kingdom Eye Drops Industry Volume (K Unit) Forecast, by Application 2020 & 2033
- Table 29: France Eye Drops Industry Revenue (billion) Forecast, by Application 2020 & 2033
- Table 30: France Eye Drops Industry Volume (K Unit) Forecast, by Application 2020 & 2033
- Table 31: Italy Eye Drops Industry Revenue (billion) Forecast, by Application 2020 & 2033
- Table 32: Italy Eye Drops Industry Volume (K Unit) Forecast, by Application 2020 & 2033
- Table 33: Spain Eye Drops Industry Revenue (billion) Forecast, by Application 2020 & 2033
- Table 34: Spain Eye Drops Industry Volume (K Unit) Forecast, by Application 2020 & 2033
- Table 35: Rest of Europe Eye Drops Industry Revenue (billion) Forecast, by Application 2020 & 2033
- Table 36: Rest of Europe Eye Drops Industry Volume (K Unit) Forecast, by Application 2020 & 2033
- Table 37: Global Eye Drops Industry Revenue billion Forecast, by Drug Class 2020 & 2033
- Table 38: Global Eye Drops Industry Volume K Unit Forecast, by Drug Class 2020 & 2033
- Table 39: Global Eye Drops Industry Revenue billion Forecast, by Type 2020 & 2033
- Table 40: Global Eye Drops Industry Volume K Unit Forecast, by Type 2020 & 2033
- Table 41: Global Eye Drops Industry Revenue billion Forecast, by Country 2020 & 2033
- Table 42: Global Eye Drops Industry Volume K Unit Forecast, by Country 2020 & 2033
- Table 43: China Eye Drops Industry Revenue (billion) Forecast, by Application 2020 & 2033
- Table 44: China Eye Drops Industry Volume (K Unit) Forecast, by Application 2020 & 2033
- Table 45: Japan Eye Drops Industry Revenue (billion) Forecast, by Application 2020 & 2033
- Table 46: Japan Eye Drops Industry Volume (K Unit) Forecast, by Application 2020 & 2033
- Table 47: India Eye Drops Industry Revenue (billion) Forecast, by Application 2020 & 2033
- Table 48: India Eye Drops Industry Volume (K Unit) Forecast, by Application 2020 & 2033
- Table 49: Australia Eye Drops Industry Revenue (billion) Forecast, by Application 2020 & 2033
- Table 50: Australia Eye Drops Industry Volume (K Unit) Forecast, by Application 2020 & 2033
- Table 51: South Korea Eye Drops Industry Revenue (billion) Forecast, by Application 2020 & 2033
- Table 52: South Korea Eye Drops Industry Volume (K Unit) Forecast, by Application 2020 & 2033
- Table 53: Rest of Asia Pacific Eye Drops Industry Revenue (billion) Forecast, by Application 2020 & 2033
- Table 54: Rest of Asia Pacific Eye Drops Industry Volume (K Unit) Forecast, by Application 2020 & 2033
- Table 55: Global Eye Drops Industry Revenue billion Forecast, by Drug Class 2020 & 2033
- Table 56: Global Eye Drops Industry Volume K Unit Forecast, by Drug Class 2020 & 2033
- Table 57: Global Eye Drops Industry Revenue billion Forecast, by Type 2020 & 2033
- Table 58: Global Eye Drops Industry Volume K Unit Forecast, by Type 2020 & 2033
- Table 59: Global Eye Drops Industry Revenue billion Forecast, by Country 2020 & 2033
- Table 60: Global Eye Drops Industry Volume K Unit Forecast, by Country 2020 & 2033
- Table 61: GCC Eye Drops Industry Revenue (billion) Forecast, by Application 2020 & 2033
- Table 62: GCC Eye Drops Industry Volume (K Unit) Forecast, by Application 2020 & 2033
- Table 63: South Africa Eye Drops Industry Revenue (billion) Forecast, by Application 2020 & 2033
- Table 64: South Africa Eye Drops Industry Volume (K Unit) Forecast, by Application 2020 & 2033
- Table 65: Rest of Middle East and Africa Eye Drops Industry Revenue (billion) Forecast, by Application 2020 & 2033
- Table 66: Rest of Middle East and Africa Eye Drops Industry Volume (K Unit) Forecast, by Application 2020 & 2033
- Table 67: Global Eye Drops Industry Revenue billion Forecast, by Drug Class 2020 & 2033
- Table 68: Global Eye Drops Industry Volume K Unit Forecast, by Drug Class 2020 & 2033
- Table 69: Global Eye Drops Industry Revenue billion Forecast, by Type 2020 & 2033
- Table 70: Global Eye Drops Industry Volume K Unit Forecast, by Type 2020 & 2033
- Table 71: Global Eye Drops Industry Revenue billion Forecast, by Country 2020 & 2033
- Table 72: Global Eye Drops Industry Volume K Unit Forecast, by Country 2020 & 2033
- Table 73: Brazil Eye Drops Industry Revenue (billion) Forecast, by Application 2020 & 2033
- Table 74: Brazil Eye Drops Industry Volume (K Unit) Forecast, by Application 2020 & 2033
- Table 75: Argentina Eye Drops Industry Revenue (billion) Forecast, by Application 2020 & 2033
- Table 76: Argentina Eye Drops Industry Volume (K Unit) Forecast, by Application 2020 & 2033
- Table 77: Rest of South America Eye Drops Industry Revenue (billion) Forecast, by Application 2020 & 2033
- Table 78: Rest of South America Eye Drops Industry Volume (K Unit) Forecast, by Application 2020 & 2033
Frequently Asked Questions
1. What is the projected Compound Annual Growth Rate (CAGR) of the Eye Drops Industry?
The projected CAGR is approximately 4.7%.
2. Which companies are prominent players in the Eye Drops Industry?
Key companies in the market include Novartis AG, F Hoffmann-La Roche Ltd, Santen Pharmaceutical Co, Regeneron Pharmaceuticals, Johnson & Johnson, AbbVie Inc (Allergan Plc), Bausch Health Companies Inc, Pfizer Inc.
3. What are the main segments of the Eye Drops Industry?
The market segments include Drug Class, Type.
4. Can you provide details about the market size?
The market size is estimated to be USD 18.1 billion as of 2022.
5. What are some drivers contributing to market growth?
Rise in Incidence of Ocular Diseases; Increasing Research and Development in Eye Allergy Medication.
6. What are the notable trends driving market growth?
Antihistamines are Expected to Register a High Growth Rate Over the Forecast Period.
7. Are there any restraints impacting market growth?
Side Effects from Eye Drops.
8. Can you provide examples of recent developments in the market?
In May 2022, Santen Inc., the United States subsidiary of Santen Pharmaceutical Co., Ltd., announced that Verkazia (cyclosporine ophthalmic emulsion) 0.1% has been released in the United States for the treatment of vernal keratoconjunctivitis (VKC) eye allergy.
9. What pricing options are available for accessing the report?
Pricing options include single-user, multi-user, and enterprise licenses priced at USD 4750, USD 5250, and USD 8750 respectively.
10. Is the market size provided in terms of value or volume?
The market size is provided in terms of value, measured in billion and volume, measured in K Unit.
11. Are there any specific market keywords associated with the report?
Yes, the market keyword associated with the report is "Eye Drops Industry," which aids in identifying and referencing the specific market segment covered.
12. How do I determine which pricing option suits my needs best?
The pricing options vary based on user requirements and access needs. Individual users may opt for single-user licenses, while businesses requiring broader access may choose multi-user or enterprise licenses for cost-effective access to the report.
13. Are there any additional resources or data provided in the Eye Drops Industry report?
While the report offers comprehensive insights, it's advisable to review the specific contents or supplementary materials provided to ascertain if additional resources or data are available.
14. How can I stay updated on further developments or reports in the Eye Drops Industry?
To stay informed about further developments, trends, and reports in the Eye Drops Industry, consider subscribing to industry newsletters, following relevant companies and organizations, or regularly checking reputable industry news sources and publications.
Methodology
Step 1 - Identification of Relevant Samples Size from Population Database


Step 2 - Approaches for Defining Global Market Size (Value, Volume* & Price*)

Note*: In applicable scenarios
Step 3 - Data Sources
Primary Research
- Web Analytics
- Survey Reports
- Research Institute
- Latest Research Reports
- Opinion Leaders
Secondary Research
- Annual Reports
- White Paper
- Latest Press Release
- Industry Association
- Paid Database
- Investor Presentations

Step 4 - Data Triangulation
Involves using different sources of information in order to increase the validity of a study
These sources are likely to be stakeholders in a program - participants, other researchers, program staff, other community members, and so on.
Then we put all data in single framework & apply various statistical tools to find out the dynamic on the market.
During the analysis stage, feedback from the stakeholder groups would be compared to determine areas of agreement as well as areas of divergence