

Key Insights
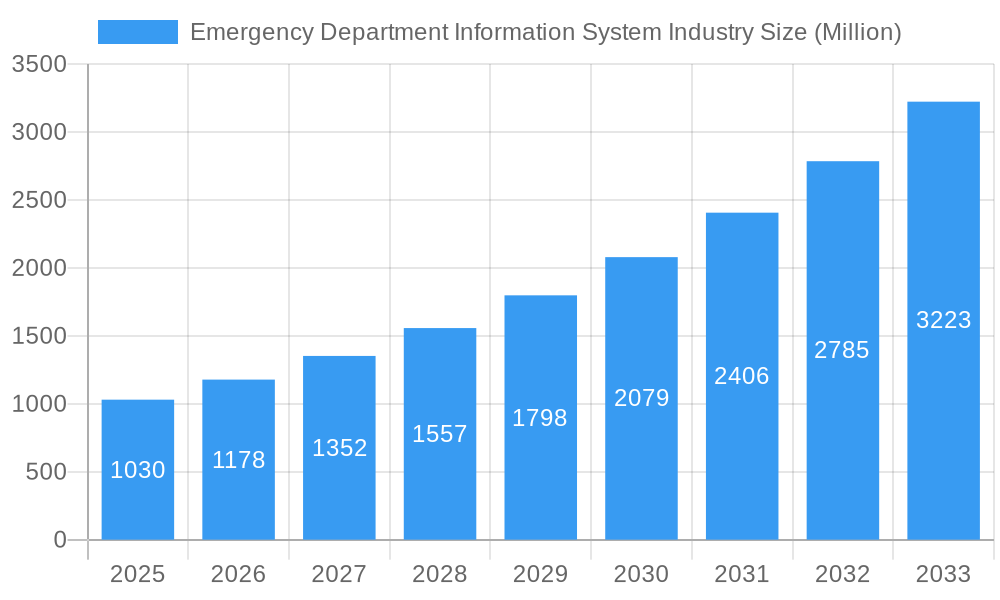
The Emergency Department Information System (EDIS) market is experiencing robust growth, projected to reach a market size of $1.03 billion in 2025, with a Compound Annual Growth Rate (CAGR) of 14.37% from 2019-2033. This expansion is driven by several key factors. The increasing volume of patients in emergency departments necessitates efficient patient management systems, pushing hospitals and healthcare providers to adopt advanced EDIS solutions. Furthermore, the rising adoption of electronic health records (EHRs) and the growing emphasis on improving healthcare quality and reducing medical errors are significant drivers. The shift towards value-based care models, which incentivize better patient outcomes and operational efficiency, is further fueling the demand for sophisticated EDIS platforms. Technological advancements, such as the integration of artificial intelligence (AI) for improved diagnostics and predictive analytics, and the increasing availability of cloud-based SaaS solutions, contribute to market growth. Different segments within the market, such as Computerized Physician Order Entry (CPOE) and e-prescribing, are experiencing particularly strong growth, driven by regulatory mandates and the need for streamlined workflows. The competitive landscape is characterized by a mix of established players like Epic Systems and Cerner Corporation, and smaller, specialized vendors offering Best-of-Breed (BOB) solutions. Geographic expansion, particularly in developing economies, presents a significant opportunity for market players. However, factors such as high implementation costs and the need for extensive staff training can act as restraints on market growth. Despite these challenges, the long-term outlook for the EDIS market remains positive, driven by the ongoing need for improved efficiency, patient safety, and cost-effectiveness in emergency care.
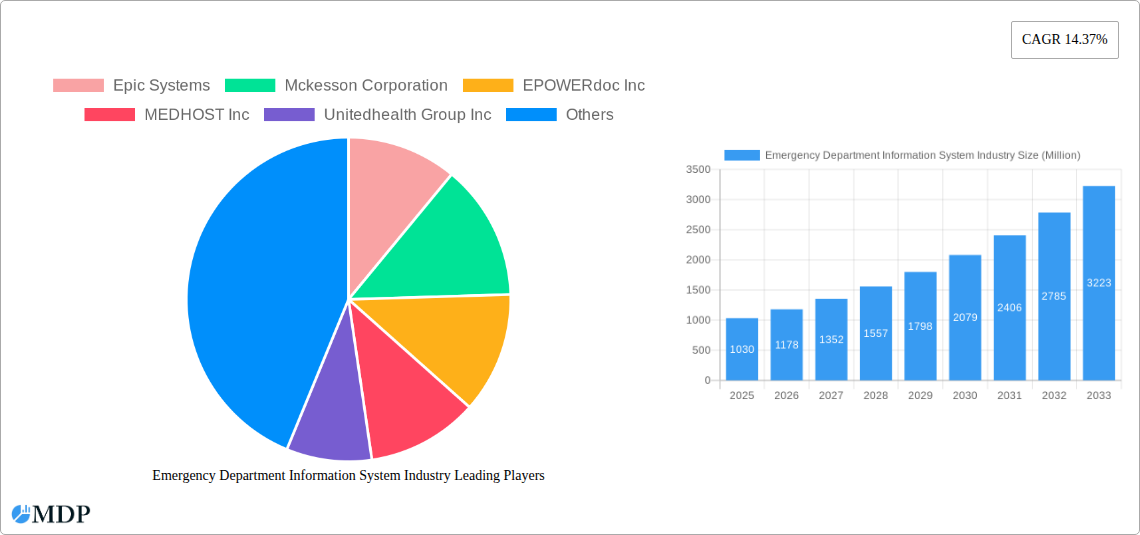
Emergency Department Information System Industry Market Size (In Billion)
The continued growth in the EDIS market is expected to be fueled by several factors beyond the aforementioned. These include the increasing adoption of telehealth, which necessitates seamless integration with EDIS for remote patient monitoring and management. The growing focus on data analytics and reporting to extract meaningful insights from patient data for improved decision-making and resource allocation will further bolster demand. Government initiatives to promote the adoption of electronic health records and interoperability standards will also play a crucial role. Furthermore, the increasing prevalence of chronic diseases and the aging population are contributing to higher emergency department visit volumes, creating a greater need for robust and efficient EDIS systems. While security concerns and data privacy regulations pose challenges, the industry is adapting through robust security protocols and compliance measures to maintain trust and ensure the widespread adoption of EDIS solutions across various healthcare settings.
Emergency Department Information System Industry Company Market Share
Emergency Department Information System (EDIS) Market Report: 2019-2033
This comprehensive report provides a detailed analysis of the Emergency Department Information System (EDIS) industry, offering invaluable insights for stakeholders, investors, and industry professionals. With a forecast period spanning 2025-2033 and a base year of 2025, this report leverages historical data (2019-2024) to project future market trends, growth drivers, and challenges. The EDIS market, valued at xx Million in 2025, is poised for significant expansion, reaching xx Million by 2033, exhibiting a CAGR of xx%.
Emergency Department Information System Industry Market Dynamics & Concentration
The EDIS market exhibits a moderately concentrated landscape, with key players such as Epic Systems, McKesson Corporation, and Cerner Corporation holding significant market share. However, the presence of numerous smaller, specialized vendors offering Best-of-Breed (B.O.B.) solutions fosters competition. Innovation in areas like AI-powered triage and predictive analytics is a primary growth driver, while regulatory compliance (e.g., HIPAA, GDPR) and interoperability standards significantly influence market dynamics. Product substitutes, primarily legacy systems and manual processes, are gradually losing ground due to increasing efficiency demands. End-user trends show a clear preference for cloud-based SaaS solutions due to their scalability and cost-effectiveness. M&A activity in the sector has been moderate, with approximately xx deals recorded between 2019 and 2024, primarily focused on consolidating market share and expanding product portfolios. The market share distribution is as follows (2025 estimates):
- Epic Systems: xx%
- McKesson Corporation: xx%
- Cerner Corporation: xx%
- Others: xx%
The average deal size for M&A activities during the historical period was approximately xx Million.
Emergency Department Information System Industry Industry Trends & Analysis
The EDIS market is experiencing robust growth fueled by several factors. The increasing prevalence of chronic diseases and an aging global population are driving up demand for efficient ED management. Technological advancements, such as AI-powered diagnostic tools and improved data analytics, are enhancing the capabilities of EDIS solutions, leading to better patient care and operational efficiency. Consumer preferences are shifting towards user-friendly, integrated systems that offer seamless data exchange and interoperability. The competitive landscape is characterized by continuous innovation, strategic partnerships, and the emergence of specialized niche players. This intense competition is driving down costs and improving the quality of EDIS solutions. The market penetration rate for EDIS in large hospitals is estimated at xx%, while smaller hospitals show a penetration rate of xx%.
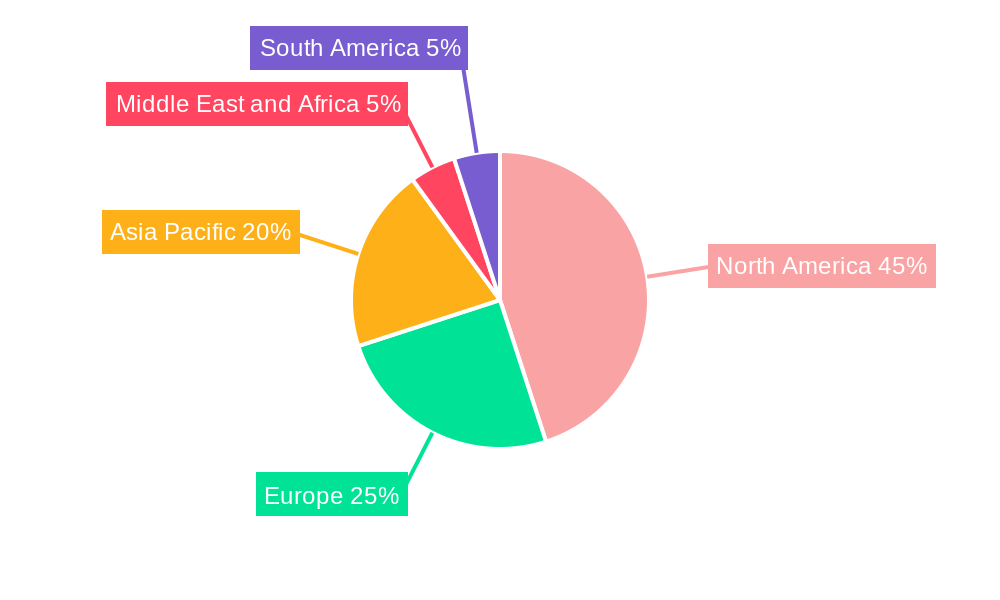
Leading Markets & Segments in Emergency Department Information System Industry
The North American market currently dominates the EDIS industry, driven by factors such as robust healthcare infrastructure, high technological adoption rates, and favorable regulatory frameworks. Within this region, the United States holds the largest market share.
Key Drivers:
- Economic Policies: Government initiatives promoting healthcare IT modernization and interoperability are driving market growth.
- Technological Infrastructure: Advanced internet connectivity and robust IT infrastructure support the adoption of cloud-based EDIS solutions.
- High Healthcare Expenditure: Significant investments in healthcare infrastructure and technology fuel EDIS adoption.
Dominant Segments:
- Application: Computerized Physician Order Entry (CPOE) and Patient Tracking & Triage are the largest segments due to their crucial role in ED workflow optimization.
- Deployment: SaaS solutions are gaining traction over on-premise deployments due to their cost-effectiveness and scalability.
- Software Type: Enterprise solutions are dominant in large hospitals, while B.O.B. solutions cater to specific needs in smaller facilities.
- End User: Large hospitals are the biggest consumers of EDIS due to their increased need for sophisticated management systems.
Emergency Department Information System Industry Product Developments
Recent product innovations focus on integrating AI and machine learning capabilities into EDIS platforms, enabling predictive analytics, automated alerts, and improved diagnostic accuracy. These advancements enhance workflow efficiency, reduce ED length of stay, and improve patient outcomes. The competitive advantage lies in delivering seamless integration with other healthcare IT systems, ensuring comprehensive data exchange and interoperability. This trend is further amplified by the increasing demand for mobile-accessible EDIS solutions that facilitate remote monitoring and care coordination.
Key Drivers of Emergency Department Information System Industry Growth
The EDIS market's growth is propelled by several key factors: the increasing demand for improved efficiency and reduced costs in emergency departments, government initiatives promoting healthcare IT modernization and interoperability, the rise of cloud-based solutions offering enhanced scalability and cost-effectiveness, and the development of AI-powered tools that enhance diagnostic accuracy and streamline workflows. For example, the implementation of value-based care models is pushing hospitals to adopt EDIS to improve patient outcomes and reduce costs.
Challenges in the Emergency Department Information System Industry Market
Significant challenges include high implementation costs, the need for extensive staff training, and ensuring data security and interoperability across different healthcare systems. The complexity of integrating EDIS with existing legacy systems can also pose a significant hurdle, along with concerns around data privacy and regulatory compliance. These challenges, if not addressed effectively, could potentially impede the overall market growth by xx% by 2033.
Emerging Opportunities in Emergency Department Information System Industry
The integration of AI and machine learning for predictive analytics, remote patient monitoring capabilities, and the expansion into emerging markets represent significant opportunities for EDIS vendors. Strategic partnerships with healthcare providers and technology companies will be crucial for achieving market penetration and delivering value-added solutions. Furthermore, focusing on user experience and designing intuitive interfaces will enhance adoption rates and improve user satisfaction.
Leading Players in the Emergency Department Information System Industry Sector
- Epic Systems
- Mckesson Corporation
- EPOWERdoc Inc
- MEDHOST Inc
- Unitedhealth Group Inc
- Cerner Corporation
- Medical Information Technology Inc
- Logibec Canada
- Allscripts Healthcare Solutions Inc
- T-Systems Inc
- Evident
- Medsphere Systems Corporation
Key Milestones in Emergency Department Information System Industry Industry
- March 2022: HeartBeam, Inc. signed a BAA and CTA with Phoebe Putney Health System for an ED MI software pilot study. This signifies the growing interest in AI-powered diagnostic tools within the EDIS market.
- January 2022: Aidoc partnered with Novant Health to integrate AI-driven triage solutions. This collaboration highlights the adoption of AI to improve patient outcomes and reduce ED length of stay.
Strategic Outlook for Emergency Department Information System Industry Market
The future of the EDIS market is bright, driven by continuous technological advancements, increasing demand for efficient healthcare solutions, and the growing adoption of cloud-based systems. Strategic partnerships, focus on user experience, and expansion into emerging markets will be key to success. The market's long-term growth potential is significant, particularly in regions with developing healthcare infrastructure and rising demand for improved ED management.
Emergency Department Information System Industry Segmentation
-
1. Application
- 1.1. Computerized Physician Order Entry (CPOE)
- 1.2. Clinical Documentation
- 1.3. Patient Tracking & Triage
- 1.4. E-Prescribing
- 1.5. Others
-
2. Deployment
- 2.1. On-Premise EDIS
- 2.2. Software-As-A-Services (SaaS)
-
3. Software Type
- 3.1. Enterprise Solutions
- 3.2. Best of Breed (B.O.B.) Solutions
-
4. End User
- 4.1. Small Hospitals
- 4.2. Medium-Sized Hospitals
- 4.3. Large Hospitals
Emergency Department Information System Industry Segmentation By Geography
-
1. North America
- 1.1. United States
- 1.2. Canada
- 1.3. Mexico
-
2. Europe
- 2.1. Germany
- 2.2. United Kingdom
- 2.3. France
- 2.4. Italy
- 2.5. Spain
- 2.6. Rest of Europe
-
3. Asia Pacific
- 3.1. China
- 3.2. Japan
- 3.3. India
- 3.4. Australia
- 3.5. South Korea
- 3.6. Rest of Asia Pacific
-
4. Middle East and Africa
- 4.1. GCC
- 4.2. South Africa
- 4.3. Rest of Middle East and Africa
-
5. South America
- 5.1. Brazil
- 5.2. Argentina
- 5.3. Rest of South America
Emergency Department Information System Industry Regional Market Share
Geographic Coverage of Emergency Department Information System Industry
Emergency Department Information System Industry REPORT HIGHLIGHTS
| Aspects | Details |
|---|---|
| Study Period | 2020-2034 |
| Base Year | 2025 |
| Estimated Year | 2026 |
| Forecast Period | 2026-2034 |
| Historical Period | 2020-2025 |
| Growth Rate | CAGR of 14.37% from 2020-2034 |
| Segmentation |
|
Table of Contents
- 1. Introduction
- 1.1. Research Scope
- 1.2. Market Segmentation
- 1.3. Research Methodology
- 1.4. Definitions and Assumptions
- 2. Executive Summary
- 2.1. Introduction
- 3. Market Dynamics
- 3.1. Introduction
- 3.2. Market Drivers
- 3.2.1. Rise in the Geriatric Population; Increasing Use Of Data-Driven Technologies; Increase in Number of Insured Population
- 3.3. Market Restrains
- 3.3.1. Adverse Quality and Safety Implications Of EDIS; Lack of Skilled Healthcare IT Professionals
- 3.4. Market Trends
- 3.4.1. Best of Breed (B.O.B.) Solutions are Anticipated to be the Dominant Segment in Software Type During the Forecast Period
- 4. Market Factor Analysis
- 4.1. Porters Five Forces
- 4.2. Supply/Value Chain
- 4.3. PESTEL analysis
- 4.4. Market Entropy
- 4.5. Patent/Trademark Analysis
- 5. Global Emergency Department Information System Industry Analysis, Insights and Forecast, 2020-2032
- 5.1. Market Analysis, Insights and Forecast - by Application
- 5.1.1. Computerized Physician Order Entry (CPOE)
- 5.1.2. Clinical Documentation
- 5.1.3. Patient Tracking & Triage
- 5.1.4. E-Prescribing
- 5.1.5. Others
- 5.2. Market Analysis, Insights and Forecast - by Deployment
- 5.2.1. On-Premise EDIS
- 5.2.2. Software-As-A-Services (SaaS)
- 5.3. Market Analysis, Insights and Forecast - by Software Type
- 5.3.1. Enterprise Solutions
- 5.3.2. Best of Breed (B.O.B.) Solutions
- 5.4. Market Analysis, Insights and Forecast - by End User
- 5.4.1. Small Hospitals
- 5.4.2. Medium-Sized Hospitals
- 5.4.3. Large Hospitals
- 5.5. Market Analysis, Insights and Forecast - by Region
- 5.5.1. North America
- 5.5.2. Europe
- 5.5.3. Asia Pacific
- 5.5.4. Middle East and Africa
- 5.5.5. South America
- 5.1. Market Analysis, Insights and Forecast - by Application
- 6. North America Emergency Department Information System Industry Analysis, Insights and Forecast, 2020-2032
- 6.1. Market Analysis, Insights and Forecast - by Application
- 6.1.1. Computerized Physician Order Entry (CPOE)
- 6.1.2. Clinical Documentation
- 6.1.3. Patient Tracking & Triage
- 6.1.4. E-Prescribing
- 6.1.5. Others
- 6.2. Market Analysis, Insights and Forecast - by Deployment
- 6.2.1. On-Premise EDIS
- 6.2.2. Software-As-A-Services (SaaS)
- 6.3. Market Analysis, Insights and Forecast - by Software Type
- 6.3.1. Enterprise Solutions
- 6.3.2. Best of Breed (B.O.B.) Solutions
- 6.4. Market Analysis, Insights and Forecast - by End User
- 6.4.1. Small Hospitals
- 6.4.2. Medium-Sized Hospitals
- 6.4.3. Large Hospitals
- 6.1. Market Analysis, Insights and Forecast - by Application
- 7. Europe Emergency Department Information System Industry Analysis, Insights and Forecast, 2020-2032
- 7.1. Market Analysis, Insights and Forecast - by Application
- 7.1.1. Computerized Physician Order Entry (CPOE)
- 7.1.2. Clinical Documentation
- 7.1.3. Patient Tracking & Triage
- 7.1.4. E-Prescribing
- 7.1.5. Others
- 7.2. Market Analysis, Insights and Forecast - by Deployment
- 7.2.1. On-Premise EDIS
- 7.2.2. Software-As-A-Services (SaaS)
- 7.3. Market Analysis, Insights and Forecast - by Software Type
- 7.3.1. Enterprise Solutions
- 7.3.2. Best of Breed (B.O.B.) Solutions
- 7.4. Market Analysis, Insights and Forecast - by End User
- 7.4.1. Small Hospitals
- 7.4.2. Medium-Sized Hospitals
- 7.4.3. Large Hospitals
- 7.1. Market Analysis, Insights and Forecast - by Application
- 8. Asia Pacific Emergency Department Information System Industry Analysis, Insights and Forecast, 2020-2032
- 8.1. Market Analysis, Insights and Forecast - by Application
- 8.1.1. Computerized Physician Order Entry (CPOE)
- 8.1.2. Clinical Documentation
- 8.1.3. Patient Tracking & Triage
- 8.1.4. E-Prescribing
- 8.1.5. Others
- 8.2. Market Analysis, Insights and Forecast - by Deployment
- 8.2.1. On-Premise EDIS
- 8.2.2. Software-As-A-Services (SaaS)
- 8.3. Market Analysis, Insights and Forecast - by Software Type
- 8.3.1. Enterprise Solutions
- 8.3.2. Best of Breed (B.O.B.) Solutions
- 8.4. Market Analysis, Insights and Forecast - by End User
- 8.4.1. Small Hospitals
- 8.4.2. Medium-Sized Hospitals
- 8.4.3. Large Hospitals
- 8.1. Market Analysis, Insights and Forecast - by Application
- 9. Middle East and Africa Emergency Department Information System Industry Analysis, Insights and Forecast, 2020-2032
- 9.1. Market Analysis, Insights and Forecast - by Application
- 9.1.1. Computerized Physician Order Entry (CPOE)
- 9.1.2. Clinical Documentation
- 9.1.3. Patient Tracking & Triage
- 9.1.4. E-Prescribing
- 9.1.5. Others
- 9.2. Market Analysis, Insights and Forecast - by Deployment
- 9.2.1. On-Premise EDIS
- 9.2.2. Software-As-A-Services (SaaS)
- 9.3. Market Analysis, Insights and Forecast - by Software Type
- 9.3.1. Enterprise Solutions
- 9.3.2. Best of Breed (B.O.B.) Solutions
- 9.4. Market Analysis, Insights and Forecast - by End User
- 9.4.1. Small Hospitals
- 9.4.2. Medium-Sized Hospitals
- 9.4.3. Large Hospitals
- 9.1. Market Analysis, Insights and Forecast - by Application
- 10. South America Emergency Department Information System Industry Analysis, Insights and Forecast, 2020-2032
- 10.1. Market Analysis, Insights and Forecast - by Application
- 10.1.1. Computerized Physician Order Entry (CPOE)
- 10.1.2. Clinical Documentation
- 10.1.3. Patient Tracking & Triage
- 10.1.4. E-Prescribing
- 10.1.5. Others
- 10.2. Market Analysis, Insights and Forecast - by Deployment
- 10.2.1. On-Premise EDIS
- 10.2.2. Software-As-A-Services (SaaS)
- 10.3. Market Analysis, Insights and Forecast - by Software Type
- 10.3.1. Enterprise Solutions
- 10.3.2. Best of Breed (B.O.B.) Solutions
- 10.4. Market Analysis, Insights and Forecast - by End User
- 10.4.1. Small Hospitals
- 10.4.2. Medium-Sized Hospitals
- 10.4.3. Large Hospitals
- 10.1. Market Analysis, Insights and Forecast - by Application
- 11. Competitive Analysis
- 11.1. Global Market Share Analysis 2025
- 11.2. Company Profiles
- 11.2.1 Epic Systems
- 11.2.1.1. Overview
- 11.2.1.2. Products
- 11.2.1.3. SWOT Analysis
- 11.2.1.4. Recent Developments
- 11.2.1.5. Financials (Based on Availability)
- 11.2.2 Mckesson Corporation
- 11.2.2.1. Overview
- 11.2.2.2. Products
- 11.2.2.3. SWOT Analysis
- 11.2.2.4. Recent Developments
- 11.2.2.5. Financials (Based on Availability)
- 11.2.3 EPOWERdoc Inc
- 11.2.3.1. Overview
- 11.2.3.2. Products
- 11.2.3.3. SWOT Analysis
- 11.2.3.4. Recent Developments
- 11.2.3.5. Financials (Based on Availability)
- 11.2.4 MEDHOST Inc
- 11.2.4.1. Overview
- 11.2.4.2. Products
- 11.2.4.3. SWOT Analysis
- 11.2.4.4. Recent Developments
- 11.2.4.5. Financials (Based on Availability)
- 11.2.5 Unitedhealth Group Inc
- 11.2.5.1. Overview
- 11.2.5.2. Products
- 11.2.5.3. SWOT Analysis
- 11.2.5.4. Recent Developments
- 11.2.5.5. Financials (Based on Availability)
- 11.2.6 Cerner Corporation
- 11.2.6.1. Overview
- 11.2.6.2. Products
- 11.2.6.3. SWOT Analysis
- 11.2.6.4. Recent Developments
- 11.2.6.5. Financials (Based on Availability)
- 11.2.7 Medical Information Technology Inc
- 11.2.7.1. Overview
- 11.2.7.2. Products
- 11.2.7.3. SWOT Analysis
- 11.2.7.4. Recent Developments
- 11.2.7.5. Financials (Based on Availability)
- 11.2.8 Logibec Canada
- 11.2.8.1. Overview
- 11.2.8.2. Products
- 11.2.8.3. SWOT Analysis
- 11.2.8.4. Recent Developments
- 11.2.8.5. Financials (Based on Availability)
- 11.2.9 Allscripts Healthcare Solutions Inc
- 11.2.9.1. Overview
- 11.2.9.2. Products
- 11.2.9.3. SWOT Analysis
- 11.2.9.4. Recent Developments
- 11.2.9.5. Financials (Based on Availability)
- 11.2.10 T-Systems Inc
- 11.2.10.1. Overview
- 11.2.10.2. Products
- 11.2.10.3. SWOT Analysis
- 11.2.10.4. Recent Developments
- 11.2.10.5. Financials (Based on Availability)
- 11.2.11 Evident
- 11.2.11.1. Overview
- 11.2.11.2. Products
- 11.2.11.3. SWOT Analysis
- 11.2.11.4. Recent Developments
- 11.2.11.5. Financials (Based on Availability)
- 11.2.12 Medsphere Systems Corporation
- 11.2.12.1. Overview
- 11.2.12.2. Products
- 11.2.12.3. SWOT Analysis
- 11.2.12.4. Recent Developments
- 11.2.12.5. Financials (Based on Availability)
- 11.2.1 Epic Systems
List of Figures
- Figure 1: Global Emergency Department Information System Industry Revenue Breakdown (Million, %) by Region 2025 & 2033
- Figure 2: Global Emergency Department Information System Industry Volume Breakdown (K Unit, %) by Region 2025 & 2033
- Figure 3: North America Emergency Department Information System Industry Revenue (Million), by Application 2025 & 2033
- Figure 4: North America Emergency Department Information System Industry Volume (K Unit), by Application 2025 & 2033
- Figure 5: North America Emergency Department Information System Industry Revenue Share (%), by Application 2025 & 2033
- Figure 6: North America Emergency Department Information System Industry Volume Share (%), by Application 2025 & 2033
- Figure 7: North America Emergency Department Information System Industry Revenue (Million), by Deployment 2025 & 2033
- Figure 8: North America Emergency Department Information System Industry Volume (K Unit), by Deployment 2025 & 2033
- Figure 9: North America Emergency Department Information System Industry Revenue Share (%), by Deployment 2025 & 2033
- Figure 10: North America Emergency Department Information System Industry Volume Share (%), by Deployment 2025 & 2033
- Figure 11: North America Emergency Department Information System Industry Revenue (Million), by Software Type 2025 & 2033
- Figure 12: North America Emergency Department Information System Industry Volume (K Unit), by Software Type 2025 & 2033
- Figure 13: North America Emergency Department Information System Industry Revenue Share (%), by Software Type 2025 & 2033
- Figure 14: North America Emergency Department Information System Industry Volume Share (%), by Software Type 2025 & 2033
- Figure 15: North America Emergency Department Information System Industry Revenue (Million), by End User 2025 & 2033
- Figure 16: North America Emergency Department Information System Industry Volume (K Unit), by End User 2025 & 2033
- Figure 17: North America Emergency Department Information System Industry Revenue Share (%), by End User 2025 & 2033
- Figure 18: North America Emergency Department Information System Industry Volume Share (%), by End User 2025 & 2033
- Figure 19: North America Emergency Department Information System Industry Revenue (Million), by Country 2025 & 2033
- Figure 20: North America Emergency Department Information System Industry Volume (K Unit), by Country 2025 & 2033
- Figure 21: North America Emergency Department Information System Industry Revenue Share (%), by Country 2025 & 2033
- Figure 22: North America Emergency Department Information System Industry Volume Share (%), by Country 2025 & 2033
- Figure 23: Europe Emergency Department Information System Industry Revenue (Million), by Application 2025 & 2033
- Figure 24: Europe Emergency Department Information System Industry Volume (K Unit), by Application 2025 & 2033
- Figure 25: Europe Emergency Department Information System Industry Revenue Share (%), by Application 2025 & 2033
- Figure 26: Europe Emergency Department Information System Industry Volume Share (%), by Application 2025 & 2033
- Figure 27: Europe Emergency Department Information System Industry Revenue (Million), by Deployment 2025 & 2033
- Figure 28: Europe Emergency Department Information System Industry Volume (K Unit), by Deployment 2025 & 2033
- Figure 29: Europe Emergency Department Information System Industry Revenue Share (%), by Deployment 2025 & 2033
- Figure 30: Europe Emergency Department Information System Industry Volume Share (%), by Deployment 2025 & 2033
- Figure 31: Europe Emergency Department Information System Industry Revenue (Million), by Software Type 2025 & 2033
- Figure 32: Europe Emergency Department Information System Industry Volume (K Unit), by Software Type 2025 & 2033
- Figure 33: Europe Emergency Department Information System Industry Revenue Share (%), by Software Type 2025 & 2033
- Figure 34: Europe Emergency Department Information System Industry Volume Share (%), by Software Type 2025 & 2033
- Figure 35: Europe Emergency Department Information System Industry Revenue (Million), by End User 2025 & 2033
- Figure 36: Europe Emergency Department Information System Industry Volume (K Unit), by End User 2025 & 2033
- Figure 37: Europe Emergency Department Information System Industry Revenue Share (%), by End User 2025 & 2033
- Figure 38: Europe Emergency Department Information System Industry Volume Share (%), by End User 2025 & 2033
- Figure 39: Europe Emergency Department Information System Industry Revenue (Million), by Country 2025 & 2033
- Figure 40: Europe Emergency Department Information System Industry Volume (K Unit), by Country 2025 & 2033
- Figure 41: Europe Emergency Department Information System Industry Revenue Share (%), by Country 2025 & 2033
- Figure 42: Europe Emergency Department Information System Industry Volume Share (%), by Country 2025 & 2033
- Figure 43: Asia Pacific Emergency Department Information System Industry Revenue (Million), by Application 2025 & 2033
- Figure 44: Asia Pacific Emergency Department Information System Industry Volume (K Unit), by Application 2025 & 2033
- Figure 45: Asia Pacific Emergency Department Information System Industry Revenue Share (%), by Application 2025 & 2033
- Figure 46: Asia Pacific Emergency Department Information System Industry Volume Share (%), by Application 2025 & 2033
- Figure 47: Asia Pacific Emergency Department Information System Industry Revenue (Million), by Deployment 2025 & 2033
- Figure 48: Asia Pacific Emergency Department Information System Industry Volume (K Unit), by Deployment 2025 & 2033
- Figure 49: Asia Pacific Emergency Department Information System Industry Revenue Share (%), by Deployment 2025 & 2033
- Figure 50: Asia Pacific Emergency Department Information System Industry Volume Share (%), by Deployment 2025 & 2033
- Figure 51: Asia Pacific Emergency Department Information System Industry Revenue (Million), by Software Type 2025 & 2033
- Figure 52: Asia Pacific Emergency Department Information System Industry Volume (K Unit), by Software Type 2025 & 2033
- Figure 53: Asia Pacific Emergency Department Information System Industry Revenue Share (%), by Software Type 2025 & 2033
- Figure 54: Asia Pacific Emergency Department Information System Industry Volume Share (%), by Software Type 2025 & 2033
- Figure 55: Asia Pacific Emergency Department Information System Industry Revenue (Million), by End User 2025 & 2033
- Figure 56: Asia Pacific Emergency Department Information System Industry Volume (K Unit), by End User 2025 & 2033
- Figure 57: Asia Pacific Emergency Department Information System Industry Revenue Share (%), by End User 2025 & 2033
- Figure 58: Asia Pacific Emergency Department Information System Industry Volume Share (%), by End User 2025 & 2033
- Figure 59: Asia Pacific Emergency Department Information System Industry Revenue (Million), by Country 2025 & 2033
- Figure 60: Asia Pacific Emergency Department Information System Industry Volume (K Unit), by Country 2025 & 2033
- Figure 61: Asia Pacific Emergency Department Information System Industry Revenue Share (%), by Country 2025 & 2033
- Figure 62: Asia Pacific Emergency Department Information System Industry Volume Share (%), by Country 2025 & 2033
- Figure 63: Middle East and Africa Emergency Department Information System Industry Revenue (Million), by Application 2025 & 2033
- Figure 64: Middle East and Africa Emergency Department Information System Industry Volume (K Unit), by Application 2025 & 2033
- Figure 65: Middle East and Africa Emergency Department Information System Industry Revenue Share (%), by Application 2025 & 2033
- Figure 66: Middle East and Africa Emergency Department Information System Industry Volume Share (%), by Application 2025 & 2033
- Figure 67: Middle East and Africa Emergency Department Information System Industry Revenue (Million), by Deployment 2025 & 2033
- Figure 68: Middle East and Africa Emergency Department Information System Industry Volume (K Unit), by Deployment 2025 & 2033
- Figure 69: Middle East and Africa Emergency Department Information System Industry Revenue Share (%), by Deployment 2025 & 2033
- Figure 70: Middle East and Africa Emergency Department Information System Industry Volume Share (%), by Deployment 2025 & 2033
- Figure 71: Middle East and Africa Emergency Department Information System Industry Revenue (Million), by Software Type 2025 & 2033
- Figure 72: Middle East and Africa Emergency Department Information System Industry Volume (K Unit), by Software Type 2025 & 2033
- Figure 73: Middle East and Africa Emergency Department Information System Industry Revenue Share (%), by Software Type 2025 & 2033
- Figure 74: Middle East and Africa Emergency Department Information System Industry Volume Share (%), by Software Type 2025 & 2033
- Figure 75: Middle East and Africa Emergency Department Information System Industry Revenue (Million), by End User 2025 & 2033
- Figure 76: Middle East and Africa Emergency Department Information System Industry Volume (K Unit), by End User 2025 & 2033
- Figure 77: Middle East and Africa Emergency Department Information System Industry Revenue Share (%), by End User 2025 & 2033
- Figure 78: Middle East and Africa Emergency Department Information System Industry Volume Share (%), by End User 2025 & 2033
- Figure 79: Middle East and Africa Emergency Department Information System Industry Revenue (Million), by Country 2025 & 2033
- Figure 80: Middle East and Africa Emergency Department Information System Industry Volume (K Unit), by Country 2025 & 2033
- Figure 81: Middle East and Africa Emergency Department Information System Industry Revenue Share (%), by Country 2025 & 2033
- Figure 82: Middle East and Africa Emergency Department Information System Industry Volume Share (%), by Country 2025 & 2033
- Figure 83: South America Emergency Department Information System Industry Revenue (Million), by Application 2025 & 2033
- Figure 84: South America Emergency Department Information System Industry Volume (K Unit), by Application 2025 & 2033
- Figure 85: South America Emergency Department Information System Industry Revenue Share (%), by Application 2025 & 2033
- Figure 86: South America Emergency Department Information System Industry Volume Share (%), by Application 2025 & 2033
- Figure 87: South America Emergency Department Information System Industry Revenue (Million), by Deployment 2025 & 2033
- Figure 88: South America Emergency Department Information System Industry Volume (K Unit), by Deployment 2025 & 2033
- Figure 89: South America Emergency Department Information System Industry Revenue Share (%), by Deployment 2025 & 2033
- Figure 90: South America Emergency Department Information System Industry Volume Share (%), by Deployment 2025 & 2033
- Figure 91: South America Emergency Department Information System Industry Revenue (Million), by Software Type 2025 & 2033
- Figure 92: South America Emergency Department Information System Industry Volume (K Unit), by Software Type 2025 & 2033
- Figure 93: South America Emergency Department Information System Industry Revenue Share (%), by Software Type 2025 & 2033
- Figure 94: South America Emergency Department Information System Industry Volume Share (%), by Software Type 2025 & 2033
- Figure 95: South America Emergency Department Information System Industry Revenue (Million), by End User 2025 & 2033
- Figure 96: South America Emergency Department Information System Industry Volume (K Unit), by End User 2025 & 2033
- Figure 97: South America Emergency Department Information System Industry Revenue Share (%), by End User 2025 & 2033
- Figure 98: South America Emergency Department Information System Industry Volume Share (%), by End User 2025 & 2033
- Figure 99: South America Emergency Department Information System Industry Revenue (Million), by Country 2025 & 2033
- Figure 100: South America Emergency Department Information System Industry Volume (K Unit), by Country 2025 & 2033
- Figure 101: South America Emergency Department Information System Industry Revenue Share (%), by Country 2025 & 2033
- Figure 102: South America Emergency Department Information System Industry Volume Share (%), by Country 2025 & 2033
List of Tables
- Table 1: Global Emergency Department Information System Industry Revenue Million Forecast, by Application 2020 & 2033
- Table 2: Global Emergency Department Information System Industry Volume K Unit Forecast, by Application 2020 & 2033
- Table 3: Global Emergency Department Information System Industry Revenue Million Forecast, by Deployment 2020 & 2033
- Table 4: Global Emergency Department Information System Industry Volume K Unit Forecast, by Deployment 2020 & 2033
- Table 5: Global Emergency Department Information System Industry Revenue Million Forecast, by Software Type 2020 & 2033
- Table 6: Global Emergency Department Information System Industry Volume K Unit Forecast, by Software Type 2020 & 2033
- Table 7: Global Emergency Department Information System Industry Revenue Million Forecast, by End User 2020 & 2033
- Table 8: Global Emergency Department Information System Industry Volume K Unit Forecast, by End User 2020 & 2033
- Table 9: Global Emergency Department Information System Industry Revenue Million Forecast, by Region 2020 & 2033
- Table 10: Global Emergency Department Information System Industry Volume K Unit Forecast, by Region 2020 & 2033
- Table 11: Global Emergency Department Information System Industry Revenue Million Forecast, by Application 2020 & 2033
- Table 12: Global Emergency Department Information System Industry Volume K Unit Forecast, by Application 2020 & 2033
- Table 13: Global Emergency Department Information System Industry Revenue Million Forecast, by Deployment 2020 & 2033
- Table 14: Global Emergency Department Information System Industry Volume K Unit Forecast, by Deployment 2020 & 2033
- Table 15: Global Emergency Department Information System Industry Revenue Million Forecast, by Software Type 2020 & 2033
- Table 16: Global Emergency Department Information System Industry Volume K Unit Forecast, by Software Type 2020 & 2033
- Table 17: Global Emergency Department Information System Industry Revenue Million Forecast, by End User 2020 & 2033
- Table 18: Global Emergency Department Information System Industry Volume K Unit Forecast, by End User 2020 & 2033
- Table 19: Global Emergency Department Information System Industry Revenue Million Forecast, by Country 2020 & 2033
- Table 20: Global Emergency Department Information System Industry Volume K Unit Forecast, by Country 2020 & 2033
- Table 21: United States Emergency Department Information System Industry Revenue (Million) Forecast, by Application 2020 & 2033
- Table 22: United States Emergency Department Information System Industry Volume (K Unit) Forecast, by Application 2020 & 2033
- Table 23: Canada Emergency Department Information System Industry Revenue (Million) Forecast, by Application 2020 & 2033
- Table 24: Canada Emergency Department Information System Industry Volume (K Unit) Forecast, by Application 2020 & 2033
- Table 25: Mexico Emergency Department Information System Industry Revenue (Million) Forecast, by Application 2020 & 2033
- Table 26: Mexico Emergency Department Information System Industry Volume (K Unit) Forecast, by Application 2020 & 2033
- Table 27: Global Emergency Department Information System Industry Revenue Million Forecast, by Application 2020 & 2033
- Table 28: Global Emergency Department Information System Industry Volume K Unit Forecast, by Application 2020 & 2033
- Table 29: Global Emergency Department Information System Industry Revenue Million Forecast, by Deployment 2020 & 2033
- Table 30: Global Emergency Department Information System Industry Volume K Unit Forecast, by Deployment 2020 & 2033
- Table 31: Global Emergency Department Information System Industry Revenue Million Forecast, by Software Type 2020 & 2033
- Table 32: Global Emergency Department Information System Industry Volume K Unit Forecast, by Software Type 2020 & 2033
- Table 33: Global Emergency Department Information System Industry Revenue Million Forecast, by End User 2020 & 2033
- Table 34: Global Emergency Department Information System Industry Volume K Unit Forecast, by End User 2020 & 2033
- Table 35: Global Emergency Department Information System Industry Revenue Million Forecast, by Country 2020 & 2033
- Table 36: Global Emergency Department Information System Industry Volume K Unit Forecast, by Country 2020 & 2033
- Table 37: Germany Emergency Department Information System Industry Revenue (Million) Forecast, by Application 2020 & 2033
- Table 38: Germany Emergency Department Information System Industry Volume (K Unit) Forecast, by Application 2020 & 2033
- Table 39: United Kingdom Emergency Department Information System Industry Revenue (Million) Forecast, by Application 2020 & 2033
- Table 40: United Kingdom Emergency Department Information System Industry Volume (K Unit) Forecast, by Application 2020 & 2033
- Table 41: France Emergency Department Information System Industry Revenue (Million) Forecast, by Application 2020 & 2033
- Table 42: France Emergency Department Information System Industry Volume (K Unit) Forecast, by Application 2020 & 2033
- Table 43: Italy Emergency Department Information System Industry Revenue (Million) Forecast, by Application 2020 & 2033
- Table 44: Italy Emergency Department Information System Industry Volume (K Unit) Forecast, by Application 2020 & 2033
- Table 45: Spain Emergency Department Information System Industry Revenue (Million) Forecast, by Application 2020 & 2033
- Table 46: Spain Emergency Department Information System Industry Volume (K Unit) Forecast, by Application 2020 & 2033
- Table 47: Rest of Europe Emergency Department Information System Industry Revenue (Million) Forecast, by Application 2020 & 2033
- Table 48: Rest of Europe Emergency Department Information System Industry Volume (K Unit) Forecast, by Application 2020 & 2033
- Table 49: Global Emergency Department Information System Industry Revenue Million Forecast, by Application 2020 & 2033
- Table 50: Global Emergency Department Information System Industry Volume K Unit Forecast, by Application 2020 & 2033
- Table 51: Global Emergency Department Information System Industry Revenue Million Forecast, by Deployment 2020 & 2033
- Table 52: Global Emergency Department Information System Industry Volume K Unit Forecast, by Deployment 2020 & 2033
- Table 53: Global Emergency Department Information System Industry Revenue Million Forecast, by Software Type 2020 & 2033
- Table 54: Global Emergency Department Information System Industry Volume K Unit Forecast, by Software Type 2020 & 2033
- Table 55: Global Emergency Department Information System Industry Revenue Million Forecast, by End User 2020 & 2033
- Table 56: Global Emergency Department Information System Industry Volume K Unit Forecast, by End User 2020 & 2033
- Table 57: Global Emergency Department Information System Industry Revenue Million Forecast, by Country 2020 & 2033
- Table 58: Global Emergency Department Information System Industry Volume K Unit Forecast, by Country 2020 & 2033
- Table 59: China Emergency Department Information System Industry Revenue (Million) Forecast, by Application 2020 & 2033
- Table 60: China Emergency Department Information System Industry Volume (K Unit) Forecast, by Application 2020 & 2033
- Table 61: Japan Emergency Department Information System Industry Revenue (Million) Forecast, by Application 2020 & 2033
- Table 62: Japan Emergency Department Information System Industry Volume (K Unit) Forecast, by Application 2020 & 2033
- Table 63: India Emergency Department Information System Industry Revenue (Million) Forecast, by Application 2020 & 2033
- Table 64: India Emergency Department Information System Industry Volume (K Unit) Forecast, by Application 2020 & 2033
- Table 65: Australia Emergency Department Information System Industry Revenue (Million) Forecast, by Application 2020 & 2033
- Table 66: Australia Emergency Department Information System Industry Volume (K Unit) Forecast, by Application 2020 & 2033
- Table 67: South Korea Emergency Department Information System Industry Revenue (Million) Forecast, by Application 2020 & 2033
- Table 68: South Korea Emergency Department Information System Industry Volume (K Unit) Forecast, by Application 2020 & 2033
- Table 69: Rest of Asia Pacific Emergency Department Information System Industry Revenue (Million) Forecast, by Application 2020 & 2033
- Table 70: Rest of Asia Pacific Emergency Department Information System Industry Volume (K Unit) Forecast, by Application 2020 & 2033
- Table 71: Global Emergency Department Information System Industry Revenue Million Forecast, by Application 2020 & 2033
- Table 72: Global Emergency Department Information System Industry Volume K Unit Forecast, by Application 2020 & 2033
- Table 73: Global Emergency Department Information System Industry Revenue Million Forecast, by Deployment 2020 & 2033
- Table 74: Global Emergency Department Information System Industry Volume K Unit Forecast, by Deployment 2020 & 2033
- Table 75: Global Emergency Department Information System Industry Revenue Million Forecast, by Software Type 2020 & 2033
- Table 76: Global Emergency Department Information System Industry Volume K Unit Forecast, by Software Type 2020 & 2033
- Table 77: Global Emergency Department Information System Industry Revenue Million Forecast, by End User 2020 & 2033
- Table 78: Global Emergency Department Information System Industry Volume K Unit Forecast, by End User 2020 & 2033
- Table 79: Global Emergency Department Information System Industry Revenue Million Forecast, by Country 2020 & 2033
- Table 80: Global Emergency Department Information System Industry Volume K Unit Forecast, by Country 2020 & 2033
- Table 81: GCC Emergency Department Information System Industry Revenue (Million) Forecast, by Application 2020 & 2033
- Table 82: GCC Emergency Department Information System Industry Volume (K Unit) Forecast, by Application 2020 & 2033
- Table 83: South Africa Emergency Department Information System Industry Revenue (Million) Forecast, by Application 2020 & 2033
- Table 84: South Africa Emergency Department Information System Industry Volume (K Unit) Forecast, by Application 2020 & 2033
- Table 85: Rest of Middle East and Africa Emergency Department Information System Industry Revenue (Million) Forecast, by Application 2020 & 2033
- Table 86: Rest of Middle East and Africa Emergency Department Information System Industry Volume (K Unit) Forecast, by Application 2020 & 2033
- Table 87: Global Emergency Department Information System Industry Revenue Million Forecast, by Application 2020 & 2033
- Table 88: Global Emergency Department Information System Industry Volume K Unit Forecast, by Application 2020 & 2033
- Table 89: Global Emergency Department Information System Industry Revenue Million Forecast, by Deployment 2020 & 2033
- Table 90: Global Emergency Department Information System Industry Volume K Unit Forecast, by Deployment 2020 & 2033
- Table 91: Global Emergency Department Information System Industry Revenue Million Forecast, by Software Type 2020 & 2033
- Table 92: Global Emergency Department Information System Industry Volume K Unit Forecast, by Software Type 2020 & 2033
- Table 93: Global Emergency Department Information System Industry Revenue Million Forecast, by End User 2020 & 2033
- Table 94: Global Emergency Department Information System Industry Volume K Unit Forecast, by End User 2020 & 2033
- Table 95: Global Emergency Department Information System Industry Revenue Million Forecast, by Country 2020 & 2033
- Table 96: Global Emergency Department Information System Industry Volume K Unit Forecast, by Country 2020 & 2033
- Table 97: Brazil Emergency Department Information System Industry Revenue (Million) Forecast, by Application 2020 & 2033
- Table 98: Brazil Emergency Department Information System Industry Volume (K Unit) Forecast, by Application 2020 & 2033
- Table 99: Argentina Emergency Department Information System Industry Revenue (Million) Forecast, by Application 2020 & 2033
- Table 100: Argentina Emergency Department Information System Industry Volume (K Unit) Forecast, by Application 2020 & 2033
- Table 101: Rest of South America Emergency Department Information System Industry Revenue (Million) Forecast, by Application 2020 & 2033
- Table 102: Rest of South America Emergency Department Information System Industry Volume (K Unit) Forecast, by Application 2020 & 2033
Frequently Asked Questions
1. What is the projected Compound Annual Growth Rate (CAGR) of the Emergency Department Information System Industry?
The projected CAGR is approximately 14.37%.
2. Which companies are prominent players in the Emergency Department Information System Industry?
Key companies in the market include Epic Systems, Mckesson Corporation, EPOWERdoc Inc, MEDHOST Inc, Unitedhealth Group Inc, Cerner Corporation, Medical Information Technology Inc, Logibec Canada, Allscripts Healthcare Solutions Inc, T-Systems Inc, Evident, Medsphere Systems Corporation.
3. What are the main segments of the Emergency Department Information System Industry?
The market segments include Application, Deployment, Software Type, End User.
4. Can you provide details about the market size?
The market size is estimated to be USD 1.03 Million as of 2022.
5. What are some drivers contributing to market growth?
Rise in the Geriatric Population; Increasing Use Of Data-Driven Technologies; Increase in Number of Insured Population.
6. What are the notable trends driving market growth?
Best of Breed (B.O.B.) Solutions are Anticipated to be the Dominant Segment in Software Type During the Forecast Period.
7. Are there any restraints impacting market growth?
Adverse Quality and Safety Implications Of EDIS; Lack of Skilled Healthcare IT Professionals.
8. Can you provide examples of recent developments in the market?
In March 2022, HeartBeam, Inc. signed a Business Associate Agreement (BAA) and a Clinical Trial Agreement (CTA) with Phoebe Putney Health System to conduct a pilot study designed to evaluate HeartBeam's Emergency Department (ED) Myocardial Infarction (MI) software product.
9. What pricing options are available for accessing the report?
Pricing options include single-user, multi-user, and enterprise licenses priced at USD 4750, USD 5250, and USD 8750 respectively.
10. Is the market size provided in terms of value or volume?
The market size is provided in terms of value, measured in Million and volume, measured in K Unit.
11. Are there any specific market keywords associated with the report?
Yes, the market keyword associated with the report is "Emergency Department Information System Industry," which aids in identifying and referencing the specific market segment covered.
12. How do I determine which pricing option suits my needs best?
The pricing options vary based on user requirements and access needs. Individual users may opt for single-user licenses, while businesses requiring broader access may choose multi-user or enterprise licenses for cost-effective access to the report.
13. Are there any additional resources or data provided in the Emergency Department Information System Industry report?
While the report offers comprehensive insights, it's advisable to review the specific contents or supplementary materials provided to ascertain if additional resources or data are available.
14. How can I stay updated on further developments or reports in the Emergency Department Information System Industry?
To stay informed about further developments, trends, and reports in the Emergency Department Information System Industry, consider subscribing to industry newsletters, following relevant companies and organizations, or regularly checking reputable industry news sources and publications.
Methodology
Step 1 - Identification of Relevant Samples Size from Population Database


Step 2 - Approaches for Defining Global Market Size (Value, Volume* & Price*)

Note*: In applicable scenarios
Step 3 - Data Sources
Primary Research
- Web Analytics
- Survey Reports
- Research Institute
- Latest Research Reports
- Opinion Leaders
Secondary Research
- Annual Reports
- White Paper
- Latest Press Release
- Industry Association
- Paid Database
- Investor Presentations

Step 4 - Data Triangulation
Involves using different sources of information in order to increase the validity of a study
These sources are likely to be stakeholders in a program - participants, other researchers, program staff, other community members, and so on.
Then we put all data in single framework & apply various statistical tools to find out the dynamic on the market.
During the analysis stage, feedback from the stakeholder groups would be compared to determine areas of agreement as well as areas of divergence