

Key Insights
The CRISPR and CAS genes market is projected for substantial expansion, driven by the transformative capabilities of CRISPR-Cas gene editing technology. With a projected Compound Annual Growth Rate (CAGR) of 17.14%, the market is set to reach an estimated size of 5.6 billion by 2025. This rapid growth is underpinned by several key drivers: increasing integration of CRISPR-Cas across diverse applications such as genome engineering, disease modeling, and functional genomics; continuous innovation yielding more precise and efficient gene editing tools; and significant R&D investments from both public and private sectors. The market is segmented by product type (vector-based Cas and DNA-free Cas) and application, with genome engineering currently leading. Leading companies like Editas Medicine, CRISPR Therapeutics, and Intellia Therapeutics are at the forefront of innovation. Despite regulatory and ethical considerations, the industry outlook is exceptionally strong, with anticipated significant growth over the next decade. North America presently dominates, supported by advanced research infrastructure and early technology adoption. However, the Asia-Pacific region is expected to experience accelerated growth, fueled by rising biotechnology investments and healthcare spending.
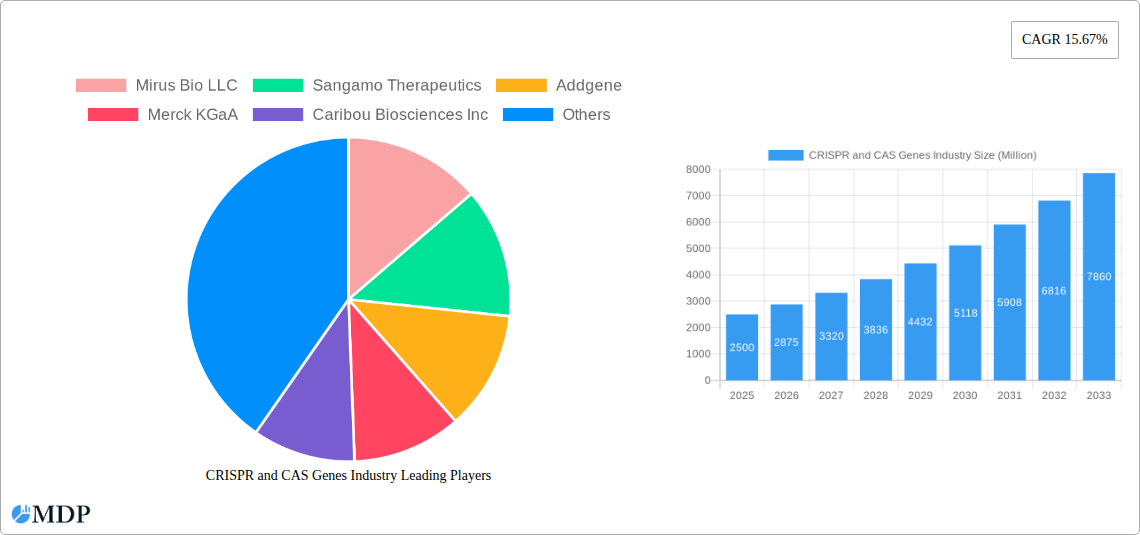
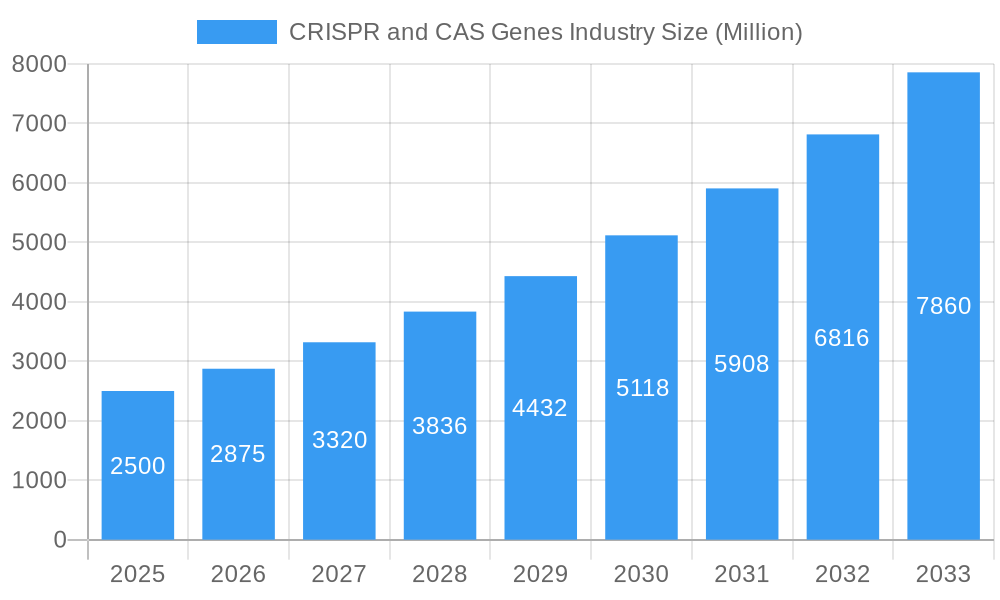
CRISPR and CAS Genes Industry Market Size (In Billion)
The future expansion of the CRISPR and CAS genes market hinges on the successful progression of clinical trials and regulatory approvals. The clinical translation of CRISPR-Cas therapies for various diseases will be a critical determinant of market growth. Advancements in delivery systems and refined editing techniques to mitigate off-target effects will also significantly influence long-term market prospects. Intense industry competition drives the development of next-generation CRISPR technologies and robust intellectual property portfolios. Companies must prioritize enhancing the safety and efficacy of CRISPR-Cas therapies and implement strategic market expansion to seize the considerable growth opportunities in this dynamic sector. The global market is estimated to reach a substantial size by 2033.
CRISPR and CAS Genes Industry Company Market Share
CRISPR and CAS Genes Industry: A Comprehensive Market Report (2019-2033)
This comprehensive report provides an in-depth analysis of the CRISPR and CAS genes industry, offering actionable insights for stakeholders across the value chain. The study period spans 2019-2033, with a base year of 2025 and a forecast period of 2025-2033. The report analyzes market dynamics, leading players, technological advancements, and future growth opportunities, projecting a market size of xx Million by 2033.
CRISPR and CAS Genes Industry Market Dynamics & Concentration
The CRISPR and CAS genes industry is characterized by dynamic market concentration, driven by continuous innovation and strategic mergers and acquisitions (M&A). The market is witnessing a surge in the development of novel CRISPR-based technologies, fueled by substantial investments from both public and private sectors. Regulatory frameworks play a crucial role in shaping market growth, with varying approval processes across different regions influencing the speed of product commercialization. Existing technologies and alternative gene-editing methods present a competitive landscape. End-user trends, particularly in therapeutic applications and research, significantly influence market demand.
The top five players currently hold approximately xx% of the market share, while a significant portion (xx%) is held by numerous smaller companies and emerging players. The number of M&A deals within the industry has averaged xx per year during the historical period (2019-2024), indicating a high level of consolidation and investment activity.
- Market Concentration: High, with top players consolidating market share.
- Innovation Drivers: Rapid advancements in CRISPR technology, increased funding for research and development.
- Regulatory Frameworks: Varying regulations across geographies impact market entry and product approvals.
- Product Substitutes: Existing gene editing technologies and other therapeutic approaches compete with CRISPR.
- End-User Trends: Growing demand from pharmaceutical companies and research institutions for genome engineering applications.
- M&A Activities: High levels of mergers and acquisitions signify consolidation and strategic investment.
CRISPR and CAS Genes Industry Industry Trends & Analysis
The CRISPR and CAS genes industry is experiencing robust growth, fueled by a confluence of factors including technological advancements, rising research funding, and increasing demand for personalized medicine. The compound annual growth rate (CAGR) is estimated at xx% during the forecast period (2025-2033). Market penetration is steadily increasing, driven by the expanding applications of CRISPR technology across diverse sectors, particularly in therapeutics, diagnostics, and agriculture. Consumer preference for targeted and personalized therapies fuels the market growth.
Technological disruptions, such as the development of improved delivery systems and enhanced targeting capabilities, significantly impact the industry landscape. Competitive dynamics are intense, with leading players focusing on developing next-generation CRISPR technologies and expanding into new therapeutic areas. Increased investments in research and development initiatives further propel the market growth. Market competition is further defined by factors like pricing strategies, intellectual property protection, and the ongoing regulatory landscape. The market size is projected to reach xx Million by 2033.
Leading Markets & Segments in CRISPR and CAS Genes Industry
North America currently holds the leading position in the CRISPR and CAS genes industry, driven primarily by robust research and development initiatives and strong regulatory support. Europe and Asia-Pacific are also witnessing significant growth, fueled by increasing investments and expanding applications of CRISPR technologies. Within the product segments, Vector-based Cas systems currently dominate, accounting for xx% of the market, with DNA-free Cas systems showing significant growth potential.
- By Product:
- Vector-based Cas: Dominant market share due to established manufacturing processes and accessibility.
- DNA-free Cas: Rapidly growing segment driven by advancements reducing off-target effects and improving delivery methods.
- By Application:
- Genome Engineering: Largest segment driven by the diverse applications in research, drug discovery, and biotechnology.
- Disease Models: High growth potential due to expanding use in preclinical research and drug development.
- Functional Genomics: Significant demand from research institutions and academic labs.
- Other Applications: Growing segment comprising agricultural biotechnology and industrial applications.
Key Drivers for North American Dominance:
- Robust funding for research and development.
- Supportive regulatory environment for clinical trials and commercialization.
- Established biotechnology infrastructure and expertise.
CRISPR and CAS Genes Industry Product Developments
Recent advancements have focused on improving the specificity and efficiency of CRISPR-Cas systems, reducing off-target effects, and developing novel delivery methods for targeted gene editing. Companies are actively developing next-generation CRISPR systems with enhanced functionalities, including base editing and prime editing, to broaden the applications of CRISPR technology. These improvements are addressing previous limitations and enhancing the precision and safety of gene editing, paving the way for the successful development of new therapies and diagnostics. The focus on improving market fit and addressing unmet medical needs is driving the product innovation.
Key Drivers of CRISPR and CAS Genes Industry Growth
The CRISPR and CAS genes industry's growth is propelled by several key factors. Technological advancements, such as the development of improved Cas enzymes and delivery systems, are enhancing the precision and efficiency of gene editing. Increased funding for research and development, coupled with supportive government policies and regulatory frameworks, is facilitating the development and commercialization of CRISPR-based therapeutics and diagnostics. The rising demand for personalized medicine is further driving market expansion, with CRISPR technology offering the potential for targeted therapies tailored to individual patient needs. Lastly, the expanding applications across diverse fields like agriculture and industrial biotechnology are adding to the industry's growth.
Challenges in the CRISPR and CAS Genes Industry Market
The CRISPR and CAS genes industry faces several challenges, including regulatory hurdles for clinical trials and commercialization, which vary across different regions, causing market uncertainties. Supply chain complexities for reagents and specialized equipment can lead to manufacturing bottlenecks. Intense competition from both established players and emerging startups for market share creates a competitive environment. Furthermore, ethical concerns and public perception surrounding gene editing remain a concern. These factors collectively impede the industry's rapid progress. The total projected market impact of these challenges is estimated at xx Million in lost revenue by 2033.
Emerging Opportunities in CRISPR and CAS Genes Industry
The long-term growth of the CRISPR and CAS genes industry is poised for acceleration due to several emerging opportunities. Ongoing technological breakthroughs, leading to improved CRISPR systems with higher accuracy and specificity, will expand therapeutic applications. Strategic partnerships between biotechnology companies and pharmaceutical giants will facilitate the development and commercialization of CRISPR-based therapies. The expansion into new markets, including diagnostics and agricultural applications, offers further growth avenues. This convergence of technological advancements, strategic collaborations, and market expansion is positioned to significantly propel the industry forward.
Leading Players in the CRISPR and CAS Genes Industry Sector
Key Milestones in CRISPR and CAS Genes Industry Industry
- November 2022: Massachusetts Institute of Technology researchers developed PASTE, a new CRISPR-based tool for inserting large DNA sequences. This advancement significantly expands the therapeutic potential of CRISPR technology.
- December 2022: A clinical trial (CRISPR_SCD001) was initiated at the University of California to evaluate CRISPR/Cas9 edited red blood cells for treating severe sickle cell disease. This marks a significant step towards the clinical translation of CRISPR-based therapies.
Strategic Outlook for CRISPR and CAS Genes Industry Market
The future of the CRISPR and CAS genes industry is exceptionally promising. Continued technological innovation, focusing on enhancing specificity, efficacy, and delivery methods, will unlock new therapeutic possibilities. Strategic partnerships and collaborations between research institutions, biotechnology companies, and pharmaceutical firms will accelerate the translation of scientific discoveries into clinically relevant therapies. The expansion of applications into diverse fields will diversify revenue streams and ensure long-term market growth. The potential for breakthroughs in gene therapies and other applications presents significant opportunities for both existing and emerging players in the market.
CRISPR and CAS Genes Industry Segmentation
-
1. Product
- 1.1. Vector-based Cas
- 1.2. DNA-free Cas
-
2. Application
- 2.1. Genome Engineering
- 2.2. Disease Models
- 2.3. Functional Genomics
- 2.4. Other Applications
CRISPR and CAS Genes Industry Segmentation By Geography
-
1. North America
- 1.1. United States
- 1.2. Canada
- 1.3. Mexico
-
2. Europe
- 2.1. Germany
- 2.2. United Kingdom
- 2.3. France
- 2.4. Italy
- 2.5. Spain
- 2.6. Rest of Europe
-
3. Asia Pacific
- 3.1. China
- 3.2. Japan
- 3.3. India
- 3.4. Australia
- 3.5. South Korea
- 3.6. Rest of Asia Pacific
-
4. Middle East and Africa
- 4.1. GCC
- 4.2. South Africa
- 4.3. Rest of Middle East and Africa
-
5. South America
- 5.1. Brazil
- 5.2. Argentina
- 5.3. Rest of South America
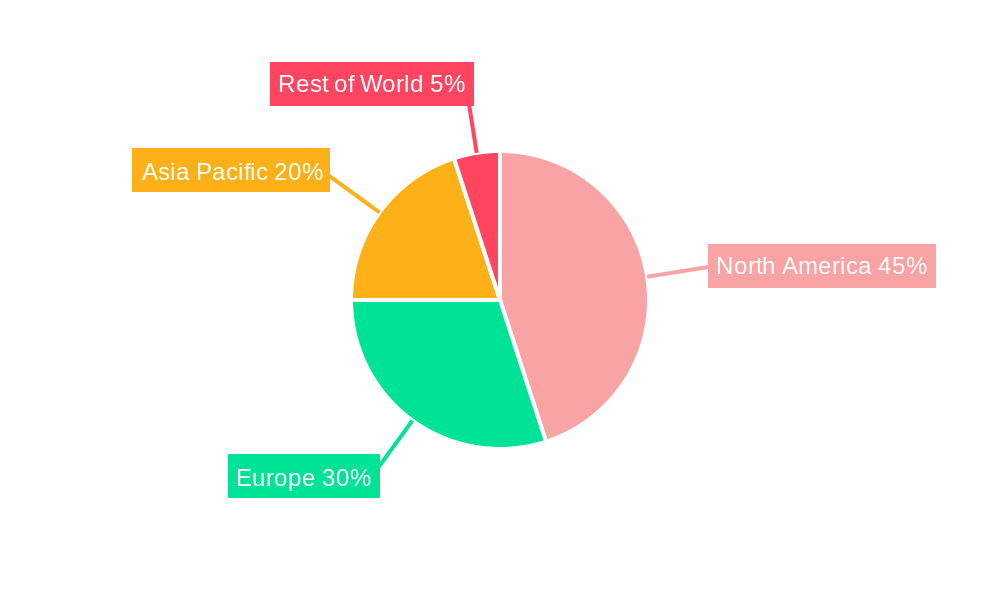
CRISPR and CAS Genes Industry Regional Market Share
Geographic Coverage of CRISPR and CAS Genes Industry
CRISPR and CAS Genes Industry REPORT HIGHLIGHTS
| Aspects | Details |
|---|---|
| Study Period | 2020-2034 |
| Base Year | 2025 |
| Estimated Year | 2026 |
| Forecast Period | 2026-2034 |
| Historical Period | 2020-2025 |
| Growth Rate | CAGR of 17.14% from 2020-2034 |
| Segmentation |
|
Table of Contents
- 1. Introduction
- 1.1. Research Scope
- 1.2. Market Segmentation
- 1.3. Research Objective
- 1.4. Definitions and Assumptions
- 2. Executive Summary
- 2.1. Market Snapshot
- 3. Market Dynamics
- 3.1. Market Drivers
- 3.2. Market Restrains
- 3.3. Market Trends
- 3.4. Market Opportunities
- 4. Market Factor Analysis
- 4.1. Porters Five Forces
- 4.1.1. Bargaining Power of Suppliers
- 4.1.2. Bargaining Power of Buyers
- 4.1.3. Threat of New Entrants
- 4.1.4. Threat of Substitutes
- 4.1.5. Competitive Rivalry
- 4.2. PESTEL analysis
- 4.3. BCG Analysis
- 4.3.1. Stars (High Growth, High Market Share)
- 4.3.2. Cash Cows (Low Growth, High Market Share)
- 4.3.3. Question Mark (High Growth, Low Market Share)
- 4.3.4. Dogs (Low Growth, Low Market Share)
- 4.4. Ansoff Matrix Analysis
- 4.5. Supply Chain Analysis
- 4.6. Regulatory Landscape
- 4.7. Current Market Potential and Opportunity Assessment (TAM–SAM–SOM Framework)
- 4.8. MDP Analyst Note
- 4.1. Porters Five Forces
- 5. Market Analysis, Insights and Forecast 2021-2033
- 5.1. Market Analysis, Insights and Forecast - by Product
- 5.1.1. Vector-based Cas
- 5.1.2. DNA-free Cas
- 5.2. Market Analysis, Insights and Forecast - by Application
- 5.2.1. Genome Engineering
- 5.2.2. Disease Models
- 5.2.3. Functional Genomics
- 5.2.4. Other Applications
- 5.3. Market Analysis, Insights and Forecast - by Region
- 5.3.1. North America
- 5.3.2. Europe
- 5.3.3. Asia Pacific
- 5.3.4. Middle East and Africa
- 5.3.5. South America
- 5.1. Market Analysis, Insights and Forecast - by Product
- 6. Global CRISPR and CAS Genes Industry Analysis, Insights and Forecast, 2021-2033
- 6.1. Market Analysis, Insights and Forecast - by Product
- 6.1.1. Vector-based Cas
- 6.1.2. DNA-free Cas
- 6.2. Market Analysis, Insights and Forecast - by Application
- 6.2.1. Genome Engineering
- 6.2.2. Disease Models
- 6.2.3. Functional Genomics
- 6.2.4. Other Applications
- 6.1. Market Analysis, Insights and Forecast - by Product
- 7. North America CRISPR and CAS Genes Industry Analysis, Insights and Forecast, 2020-2032
- 7.1. Market Analysis, Insights and Forecast - by Product
- 7.1.1. Vector-based Cas
- 7.1.2. DNA-free Cas
- 7.2. Market Analysis, Insights and Forecast - by Application
- 7.2.1. Genome Engineering
- 7.2.2. Disease Models
- 7.2.3. Functional Genomics
- 7.2.4. Other Applications
- 7.1. Market Analysis, Insights and Forecast - by Product
- 8. Europe CRISPR and CAS Genes Industry Analysis, Insights and Forecast, 2020-2032
- 8.1. Market Analysis, Insights and Forecast - by Product
- 8.1.1. Vector-based Cas
- 8.1.2. DNA-free Cas
- 8.2. Market Analysis, Insights and Forecast - by Application
- 8.2.1. Genome Engineering
- 8.2.2. Disease Models
- 8.2.3. Functional Genomics
- 8.2.4. Other Applications
- 8.1. Market Analysis, Insights and Forecast - by Product
- 9. Asia Pacific CRISPR and CAS Genes Industry Analysis, Insights and Forecast, 2020-2032
- 9.1. Market Analysis, Insights and Forecast - by Product
- 9.1.1. Vector-based Cas
- 9.1.2. DNA-free Cas
- 9.2. Market Analysis, Insights and Forecast - by Application
- 9.2.1. Genome Engineering
- 9.2.2. Disease Models
- 9.2.3. Functional Genomics
- 9.2.4. Other Applications
- 9.1. Market Analysis, Insights and Forecast - by Product
- 10. Middle East and Africa CRISPR and CAS Genes Industry Analysis, Insights and Forecast, 2020-2032
- 10.1. Market Analysis, Insights and Forecast - by Product
- 10.1.1. Vector-based Cas
- 10.1.2. DNA-free Cas
- 10.2. Market Analysis, Insights and Forecast - by Application
- 10.2.1. Genome Engineering
- 10.2.2. Disease Models
- 10.2.3. Functional Genomics
- 10.2.4. Other Applications
- 10.1. Market Analysis, Insights and Forecast - by Product
- 11. South America CRISPR and CAS Genes Industry Analysis, Insights and Forecast, 2020-2032
- 11.1. Market Analysis, Insights and Forecast - by Product
- 11.1.1. Vector-based Cas
- 11.1.2. DNA-free Cas
- 11.2. Market Analysis, Insights and Forecast - by Application
- 11.2.1. Genome Engineering
- 11.2.2. Disease Models
- 11.2.3. Functional Genomics
- 11.2.4. Other Applications
- 11.1. Market Analysis, Insights and Forecast - by Product
- 12. Competitive Analysis
- 12.1. Company Profiles
- 12.1.1 Mirus Bio LLC
- 12.1.1.1. Company Overview
- 12.1.1.2. Products
- 12.1.1.3. Company Financials
- 12.1.1.4. SWOT Analysis
- 12.1.2 Sangamo Therapeutics
- 12.1.2.1. Company Overview
- 12.1.2.2. Products
- 12.1.2.3. Company Financials
- 12.1.2.4. SWOT Analysis
- 12.1.3 Addgene
- 12.1.3.1. Company Overview
- 12.1.3.2. Products
- 12.1.3.3. Company Financials
- 12.1.3.4. SWOT Analysis
- 12.1.4 Merck KGaA
- 12.1.4.1. Company Overview
- 12.1.4.2. Products
- 12.1.4.3. Company Financials
- 12.1.4.4. SWOT Analysis
- 12.1.5 Caribou Biosciences Inc
- 12.1.5.1. Company Overview
- 12.1.5.2. Products
- 12.1.5.3. Company Financials
- 12.1.5.4. SWOT Analysis
- 12.1.6 PerkinElmer Inc (Horizon Discovery Ltd )
- 12.1.6.1. Company Overview
- 12.1.6.2. Products
- 12.1.6.3. Company Financials
- 12.1.6.4. SWOT Analysis
- 12.1.7 Takara Bio Inc
- 12.1.7.1. Company Overview
- 12.1.7.2. Products
- 12.1.7.3. Company Financials
- 12.1.7.4. SWOT Analysis
- 12.1.8 Intellia Therpeutics
- 12.1.8.1. Company Overview
- 12.1.8.2. Products
- 12.1.8.3. Company Financials
- 12.1.8.4. SWOT Analysis
- 12.1.9 Inscripta Inc
- 12.1.9.1. Company Overview
- 12.1.9.2. Products
- 12.1.9.3. Company Financials
- 12.1.9.4. SWOT Analysis
- 12.1.10 OriGene Technologies Inc
- 12.1.10.1. Company Overview
- 12.1.10.2. Products
- 12.1.10.3. Company Financials
- 12.1.10.4. SWOT Analysis
- 12.1.11 Thermo Fisher Scientific
- 12.1.11.1. Company Overview
- 12.1.11.2. Products
- 12.1.11.3. Company Financials
- 12.1.11.4. SWOT Analysis
- 12.1.12 Editas Medicine
- 12.1.12.1. Company Overview
- 12.1.12.2. Products
- 12.1.12.3. Company Financials
- 12.1.12.4. SWOT Analysis
- 12.1.13 CRISPR THERAPEUTICS
- 12.1.13.1. Company Overview
- 12.1.13.2. Products
- 12.1.13.3. Company Financials
- 12.1.13.4. SWOT Analysis
- 12.1.1 Mirus Bio LLC
- 12.2. Market Entropy
- 12.2.1 Company's Key Areas Served
- 12.2.2 Recent Developments
- 12.3. Company Market Share Analysis 2025
- 12.3.1 Top 5 Companies Market Share Analysis
- 12.3.2 Top 3 Companies Market Share Analysis
- 12.4. List of Potential Customers
- 13. Research Methodology
List of Figures
- Figure 1: Global CRISPR and CAS Genes Industry Revenue Breakdown (billion, %) by Region 2025 & 2033
- Figure 2: Global CRISPR and CAS Genes Industry Volume Breakdown (K Unit, %) by Region 2025 & 2033
- Figure 3: North America CRISPR and CAS Genes Industry Revenue (billion), by Product 2025 & 2033
- Figure 4: North America CRISPR and CAS Genes Industry Volume (K Unit), by Product 2025 & 2033
- Figure 5: North America CRISPR and CAS Genes Industry Revenue Share (%), by Product 2025 & 2033
- Figure 6: North America CRISPR and CAS Genes Industry Volume Share (%), by Product 2025 & 2033
- Figure 7: North America CRISPR and CAS Genes Industry Revenue (billion), by Application 2025 & 2033
- Figure 8: North America CRISPR and CAS Genes Industry Volume (K Unit), by Application 2025 & 2033
- Figure 9: North America CRISPR and CAS Genes Industry Revenue Share (%), by Application 2025 & 2033
- Figure 10: North America CRISPR and CAS Genes Industry Volume Share (%), by Application 2025 & 2033
- Figure 11: North America CRISPR and CAS Genes Industry Revenue (billion), by Country 2025 & 2033
- Figure 12: North America CRISPR and CAS Genes Industry Volume (K Unit), by Country 2025 & 2033
- Figure 13: North America CRISPR and CAS Genes Industry Revenue Share (%), by Country 2025 & 2033
- Figure 14: North America CRISPR and CAS Genes Industry Volume Share (%), by Country 2025 & 2033
- Figure 15: Europe CRISPR and CAS Genes Industry Revenue (billion), by Product 2025 & 2033
- Figure 16: Europe CRISPR and CAS Genes Industry Volume (K Unit), by Product 2025 & 2033
- Figure 17: Europe CRISPR and CAS Genes Industry Revenue Share (%), by Product 2025 & 2033
- Figure 18: Europe CRISPR and CAS Genes Industry Volume Share (%), by Product 2025 & 2033
- Figure 19: Europe CRISPR and CAS Genes Industry Revenue (billion), by Application 2025 & 2033
- Figure 20: Europe CRISPR and CAS Genes Industry Volume (K Unit), by Application 2025 & 2033
- Figure 21: Europe CRISPR and CAS Genes Industry Revenue Share (%), by Application 2025 & 2033
- Figure 22: Europe CRISPR and CAS Genes Industry Volume Share (%), by Application 2025 & 2033
- Figure 23: Europe CRISPR and CAS Genes Industry Revenue (billion), by Country 2025 & 2033
- Figure 24: Europe CRISPR and CAS Genes Industry Volume (K Unit), by Country 2025 & 2033
- Figure 25: Europe CRISPR and CAS Genes Industry Revenue Share (%), by Country 2025 & 2033
- Figure 26: Europe CRISPR and CAS Genes Industry Volume Share (%), by Country 2025 & 2033
- Figure 27: Asia Pacific CRISPR and CAS Genes Industry Revenue (billion), by Product 2025 & 2033
- Figure 28: Asia Pacific CRISPR and CAS Genes Industry Volume (K Unit), by Product 2025 & 2033
- Figure 29: Asia Pacific CRISPR and CAS Genes Industry Revenue Share (%), by Product 2025 & 2033
- Figure 30: Asia Pacific CRISPR and CAS Genes Industry Volume Share (%), by Product 2025 & 2033
- Figure 31: Asia Pacific CRISPR and CAS Genes Industry Revenue (billion), by Application 2025 & 2033
- Figure 32: Asia Pacific CRISPR and CAS Genes Industry Volume (K Unit), by Application 2025 & 2033
- Figure 33: Asia Pacific CRISPR and CAS Genes Industry Revenue Share (%), by Application 2025 & 2033
- Figure 34: Asia Pacific CRISPR and CAS Genes Industry Volume Share (%), by Application 2025 & 2033
- Figure 35: Asia Pacific CRISPR and CAS Genes Industry Revenue (billion), by Country 2025 & 2033
- Figure 36: Asia Pacific CRISPR and CAS Genes Industry Volume (K Unit), by Country 2025 & 2033
- Figure 37: Asia Pacific CRISPR and CAS Genes Industry Revenue Share (%), by Country 2025 & 2033
- Figure 38: Asia Pacific CRISPR and CAS Genes Industry Volume Share (%), by Country 2025 & 2033
- Figure 39: Middle East and Africa CRISPR and CAS Genes Industry Revenue (billion), by Product 2025 & 2033
- Figure 40: Middle East and Africa CRISPR and CAS Genes Industry Volume (K Unit), by Product 2025 & 2033
- Figure 41: Middle East and Africa CRISPR and CAS Genes Industry Revenue Share (%), by Product 2025 & 2033
- Figure 42: Middle East and Africa CRISPR and CAS Genes Industry Volume Share (%), by Product 2025 & 2033
- Figure 43: Middle East and Africa CRISPR and CAS Genes Industry Revenue (billion), by Application 2025 & 2033
- Figure 44: Middle East and Africa CRISPR and CAS Genes Industry Volume (K Unit), by Application 2025 & 2033
- Figure 45: Middle East and Africa CRISPR and CAS Genes Industry Revenue Share (%), by Application 2025 & 2033
- Figure 46: Middle East and Africa CRISPR and CAS Genes Industry Volume Share (%), by Application 2025 & 2033
- Figure 47: Middle East and Africa CRISPR and CAS Genes Industry Revenue (billion), by Country 2025 & 2033
- Figure 48: Middle East and Africa CRISPR and CAS Genes Industry Volume (K Unit), by Country 2025 & 2033
- Figure 49: Middle East and Africa CRISPR and CAS Genes Industry Revenue Share (%), by Country 2025 & 2033
- Figure 50: Middle East and Africa CRISPR and CAS Genes Industry Volume Share (%), by Country 2025 & 2033
- Figure 51: South America CRISPR and CAS Genes Industry Revenue (billion), by Product 2025 & 2033
- Figure 52: South America CRISPR and CAS Genes Industry Volume (K Unit), by Product 2025 & 2033
- Figure 53: South America CRISPR and CAS Genes Industry Revenue Share (%), by Product 2025 & 2033
- Figure 54: South America CRISPR and CAS Genes Industry Volume Share (%), by Product 2025 & 2033
- Figure 55: South America CRISPR and CAS Genes Industry Revenue (billion), by Application 2025 & 2033
- Figure 56: South America CRISPR and CAS Genes Industry Volume (K Unit), by Application 2025 & 2033
- Figure 57: South America CRISPR and CAS Genes Industry Revenue Share (%), by Application 2025 & 2033
- Figure 58: South America CRISPR and CAS Genes Industry Volume Share (%), by Application 2025 & 2033
- Figure 59: South America CRISPR and CAS Genes Industry Revenue (billion), by Country 2025 & 2033
- Figure 60: South America CRISPR and CAS Genes Industry Volume (K Unit), by Country 2025 & 2033
- Figure 61: South America CRISPR and CAS Genes Industry Revenue Share (%), by Country 2025 & 2033
- Figure 62: South America CRISPR and CAS Genes Industry Volume Share (%), by Country 2025 & 2033
List of Tables
- Table 1: Global CRISPR and CAS Genes Industry Revenue billion Forecast, by Product 2020 & 2033
- Table 2: Global CRISPR and CAS Genes Industry Volume K Unit Forecast, by Product 2020 & 2033
- Table 3: Global CRISPR and CAS Genes Industry Revenue billion Forecast, by Application 2020 & 2033
- Table 4: Global CRISPR and CAS Genes Industry Volume K Unit Forecast, by Application 2020 & 2033
- Table 5: Global CRISPR and CAS Genes Industry Revenue billion Forecast, by Region 2020 & 2033
- Table 6: Global CRISPR and CAS Genes Industry Volume K Unit Forecast, by Region 2020 & 2033
- Table 7: Global CRISPR and CAS Genes Industry Revenue billion Forecast, by Product 2020 & 2033
- Table 8: Global CRISPR and CAS Genes Industry Volume K Unit Forecast, by Product 2020 & 2033
- Table 9: Global CRISPR and CAS Genes Industry Revenue billion Forecast, by Application 2020 & 2033
- Table 10: Global CRISPR and CAS Genes Industry Volume K Unit Forecast, by Application 2020 & 2033
- Table 11: Global CRISPR and CAS Genes Industry Revenue billion Forecast, by Country 2020 & 2033
- Table 12: Global CRISPR and CAS Genes Industry Volume K Unit Forecast, by Country 2020 & 2033
- Table 13: United States CRISPR and CAS Genes Industry Revenue (billion) Forecast, by Application 2020 & 2033
- Table 14: United States CRISPR and CAS Genes Industry Volume (K Unit) Forecast, by Application 2020 & 2033
- Table 15: Canada CRISPR and CAS Genes Industry Revenue (billion) Forecast, by Application 2020 & 2033
- Table 16: Canada CRISPR and CAS Genes Industry Volume (K Unit) Forecast, by Application 2020 & 2033
- Table 17: Mexico CRISPR and CAS Genes Industry Revenue (billion) Forecast, by Application 2020 & 2033
- Table 18: Mexico CRISPR and CAS Genes Industry Volume (K Unit) Forecast, by Application 2020 & 2033
- Table 19: Global CRISPR and CAS Genes Industry Revenue billion Forecast, by Product 2020 & 2033
- Table 20: Global CRISPR and CAS Genes Industry Volume K Unit Forecast, by Product 2020 & 2033
- Table 21: Global CRISPR and CAS Genes Industry Revenue billion Forecast, by Application 2020 & 2033
- Table 22: Global CRISPR and CAS Genes Industry Volume K Unit Forecast, by Application 2020 & 2033
- Table 23: Global CRISPR and CAS Genes Industry Revenue billion Forecast, by Country 2020 & 2033
- Table 24: Global CRISPR and CAS Genes Industry Volume K Unit Forecast, by Country 2020 & 2033
- Table 25: Germany CRISPR and CAS Genes Industry Revenue (billion) Forecast, by Application 2020 & 2033
- Table 26: Germany CRISPR and CAS Genes Industry Volume (K Unit) Forecast, by Application 2020 & 2033
- Table 27: United Kingdom CRISPR and CAS Genes Industry Revenue (billion) Forecast, by Application 2020 & 2033
- Table 28: United Kingdom CRISPR and CAS Genes Industry Volume (K Unit) Forecast, by Application 2020 & 2033
- Table 29: France CRISPR and CAS Genes Industry Revenue (billion) Forecast, by Application 2020 & 2033
- Table 30: France CRISPR and CAS Genes Industry Volume (K Unit) Forecast, by Application 2020 & 2033
- Table 31: Italy CRISPR and CAS Genes Industry Revenue (billion) Forecast, by Application 2020 & 2033
- Table 32: Italy CRISPR and CAS Genes Industry Volume (K Unit) Forecast, by Application 2020 & 2033
- Table 33: Spain CRISPR and CAS Genes Industry Revenue (billion) Forecast, by Application 2020 & 2033
- Table 34: Spain CRISPR and CAS Genes Industry Volume (K Unit) Forecast, by Application 2020 & 2033
- Table 35: Rest of Europe CRISPR and CAS Genes Industry Revenue (billion) Forecast, by Application 2020 & 2033
- Table 36: Rest of Europe CRISPR and CAS Genes Industry Volume (K Unit) Forecast, by Application 2020 & 2033
- Table 37: Global CRISPR and CAS Genes Industry Revenue billion Forecast, by Product 2020 & 2033
- Table 38: Global CRISPR and CAS Genes Industry Volume K Unit Forecast, by Product 2020 & 2033
- Table 39: Global CRISPR and CAS Genes Industry Revenue billion Forecast, by Application 2020 & 2033
- Table 40: Global CRISPR and CAS Genes Industry Volume K Unit Forecast, by Application 2020 & 2033
- Table 41: Global CRISPR and CAS Genes Industry Revenue billion Forecast, by Country 2020 & 2033
- Table 42: Global CRISPR and CAS Genes Industry Volume K Unit Forecast, by Country 2020 & 2033
- Table 43: China CRISPR and CAS Genes Industry Revenue (billion) Forecast, by Application 2020 & 2033
- Table 44: China CRISPR and CAS Genes Industry Volume (K Unit) Forecast, by Application 2020 & 2033
- Table 45: Japan CRISPR and CAS Genes Industry Revenue (billion) Forecast, by Application 2020 & 2033
- Table 46: Japan CRISPR and CAS Genes Industry Volume (K Unit) Forecast, by Application 2020 & 2033
- Table 47: India CRISPR and CAS Genes Industry Revenue (billion) Forecast, by Application 2020 & 2033
- Table 48: India CRISPR and CAS Genes Industry Volume (K Unit) Forecast, by Application 2020 & 2033
- Table 49: Australia CRISPR and CAS Genes Industry Revenue (billion) Forecast, by Application 2020 & 2033
- Table 50: Australia CRISPR and CAS Genes Industry Volume (K Unit) Forecast, by Application 2020 & 2033
- Table 51: South Korea CRISPR and CAS Genes Industry Revenue (billion) Forecast, by Application 2020 & 2033
- Table 52: South Korea CRISPR and CAS Genes Industry Volume (K Unit) Forecast, by Application 2020 & 2033
- Table 53: Rest of Asia Pacific CRISPR and CAS Genes Industry Revenue (billion) Forecast, by Application 2020 & 2033
- Table 54: Rest of Asia Pacific CRISPR and CAS Genes Industry Volume (K Unit) Forecast, by Application 2020 & 2033
- Table 55: Global CRISPR and CAS Genes Industry Revenue billion Forecast, by Product 2020 & 2033
- Table 56: Global CRISPR and CAS Genes Industry Volume K Unit Forecast, by Product 2020 & 2033
- Table 57: Global CRISPR and CAS Genes Industry Revenue billion Forecast, by Application 2020 & 2033
- Table 58: Global CRISPR and CAS Genes Industry Volume K Unit Forecast, by Application 2020 & 2033
- Table 59: Global CRISPR and CAS Genes Industry Revenue billion Forecast, by Country 2020 & 2033
- Table 60: Global CRISPR and CAS Genes Industry Volume K Unit Forecast, by Country 2020 & 2033
- Table 61: GCC CRISPR and CAS Genes Industry Revenue (billion) Forecast, by Application 2020 & 2033
- Table 62: GCC CRISPR and CAS Genes Industry Volume (K Unit) Forecast, by Application 2020 & 2033
- Table 63: South Africa CRISPR and CAS Genes Industry Revenue (billion) Forecast, by Application 2020 & 2033
- Table 64: South Africa CRISPR and CAS Genes Industry Volume (K Unit) Forecast, by Application 2020 & 2033
- Table 65: Rest of Middle East and Africa CRISPR and CAS Genes Industry Revenue (billion) Forecast, by Application 2020 & 2033
- Table 66: Rest of Middle East and Africa CRISPR and CAS Genes Industry Volume (K Unit) Forecast, by Application 2020 & 2033
- Table 67: Global CRISPR and CAS Genes Industry Revenue billion Forecast, by Product 2020 & 2033
- Table 68: Global CRISPR and CAS Genes Industry Volume K Unit Forecast, by Product 2020 & 2033
- Table 69: Global CRISPR and CAS Genes Industry Revenue billion Forecast, by Application 2020 & 2033
- Table 70: Global CRISPR and CAS Genes Industry Volume K Unit Forecast, by Application 2020 & 2033
- Table 71: Global CRISPR and CAS Genes Industry Revenue billion Forecast, by Country 2020 & 2033
- Table 72: Global CRISPR and CAS Genes Industry Volume K Unit Forecast, by Country 2020 & 2033
- Table 73: Brazil CRISPR and CAS Genes Industry Revenue (billion) Forecast, by Application 2020 & 2033
- Table 74: Brazil CRISPR and CAS Genes Industry Volume (K Unit) Forecast, by Application 2020 & 2033
- Table 75: Argentina CRISPR and CAS Genes Industry Revenue (billion) Forecast, by Application 2020 & 2033
- Table 76: Argentina CRISPR and CAS Genes Industry Volume (K Unit) Forecast, by Application 2020 & 2033
- Table 77: Rest of South America CRISPR and CAS Genes Industry Revenue (billion) Forecast, by Application 2020 & 2033
- Table 78: Rest of South America CRISPR and CAS Genes Industry Volume (K Unit) Forecast, by Application 2020 & 2033
Frequently Asked Questions
1. What is the projected Compound Annual Growth Rate (CAGR) of the CRISPR and CAS Genes Industry?
The projected CAGR is approximately 17.14%.
2. Which companies are prominent players in the CRISPR and CAS Genes Industry?
Key companies in the market include Mirus Bio LLC, Sangamo Therapeutics, Addgene, Merck KGaA, Caribou Biosciences Inc, PerkinElmer Inc (Horizon Discovery Ltd ), Takara Bio Inc, Intellia Therpeutics, Inscripta Inc, OriGene Technologies Inc, Thermo Fisher Scientific, Editas Medicine, CRISPR THERAPEUTICS.
3. What are the main segments of the CRISPR and CAS Genes Industry?
The market segments include Product, Application.
4. Can you provide details about the market size?
The market size is estimated to be USD 5.6 billion as of 2022.
5. What are some drivers contributing to market growth?
Increasing Investment by Biotechnology Companies for Novel Therapeutics; Increasing Genomics Research and Development Activities and Funding; High Burden of Cancer and Other Diseases.
6. What are the notable trends driving market growth?
Genome Engineering Segment is Anticipated to Witness a Growth in the Market Over the Forecast Period.
7. Are there any restraints impacting market growth?
Off-target Effects Associated with the Implementation of CRISPR; High Cost and Ethical Concerns Associated with CRISPR Technology.
8. Can you provide examples of recent developments in the market?
December 2022: A researcher from the University of California sponsored a clinical trial under the title "Transplantation of Clustered Regularly Interspaced Short Palindromic Repeats Modified Hematopoietic Progenitor Stem Cells (CRISPR_SCD001) in Patients With Severe Sickle Cell Disease" to evaluate the hematopoietic stem cell transplantation (HSCT) using CRISPR/Cas9 edited red blood cells (known as CRISPR_SCD001 Drug Product).
9. What pricing options are available for accessing the report?
Pricing options include single-user, multi-user, and enterprise licenses priced at USD 4750, USD 5250, and USD 8750 respectively.
10. Is the market size provided in terms of value or volume?
The market size is provided in terms of value, measured in billion and volume, measured in K Unit.
11. Are there any specific market keywords associated with the report?
Yes, the market keyword associated with the report is "CRISPR and CAS Genes Industry," which aids in identifying and referencing the specific market segment covered.
12. How do I determine which pricing option suits my needs best?
The pricing options vary based on user requirements and access needs. Individual users may opt for single-user licenses, while businesses requiring broader access may choose multi-user or enterprise licenses for cost-effective access to the report.
13. Are there any additional resources or data provided in the CRISPR and CAS Genes Industry report?
While the report offers comprehensive insights, it's advisable to review the specific contents or supplementary materials provided to ascertain if additional resources or data are available.
14. How can I stay updated on further developments or reports in the CRISPR and CAS Genes Industry?
To stay informed about further developments, trends, and reports in the CRISPR and CAS Genes Industry, consider subscribing to industry newsletters, following relevant companies and organizations, or regularly checking reputable industry news sources and publications.
Methodology
Step 1 - Identification of Relevant Samples Size from Population Database


Step 2 - Approaches for Defining Global Market Size (Value, Volume* & Price*)

Note*: In applicable scenarios
Step 3 - Data Sources
Primary Research
- Web Analytics
- Survey Reports
- Research Institute
- Latest Research Reports
- Opinion Leaders
Secondary Research
- Annual Reports
- White Paper
- Latest Press Release
- Industry Association
- Paid Database
- Investor Presentations

Step 4 - Data Triangulation
Involves using different sources of information in order to increase the validity of a study
These sources are likely to be stakeholders in a program - participants, other researchers, program staff, other community members, and so on.
Then we put all data in single framework & apply various statistical tools to find out the dynamic on the market.
During the analysis stage, feedback from the stakeholder groups would be compared to determine areas of agreement as well as areas of divergence