
Key Insights
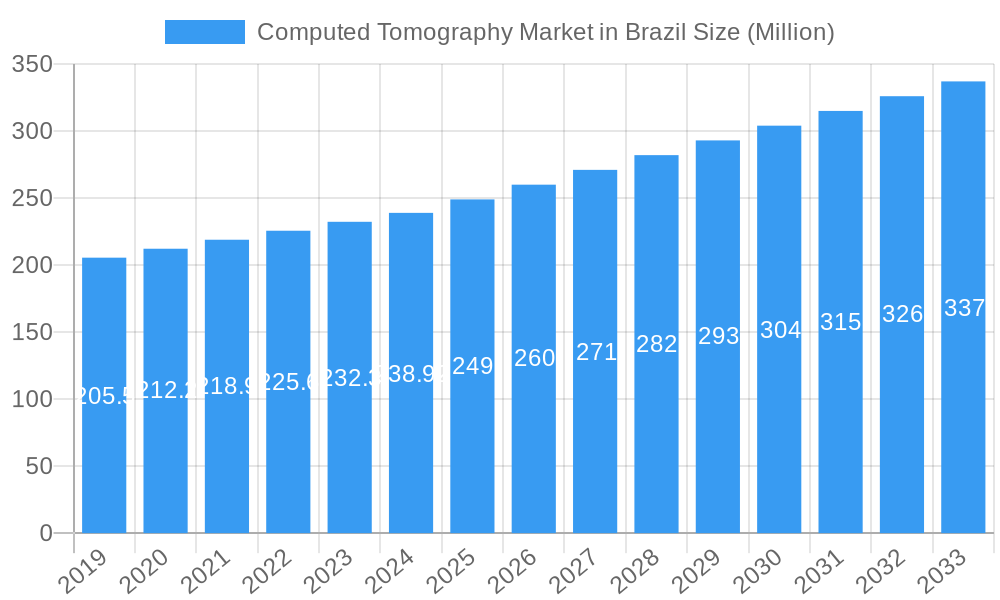
The Computed Tomography (CT) market in Brazil is poised for significant growth, driven by increasing healthcare expenditure, a rising prevalence of chronic diseases, and a growing demand for advanced diagnostic imaging solutions. With an estimated market size of USD 238.92 million in 2025 and a projected Compound Annual Growth Rate (CAGR) of 4.25% through 2033, the Brazilian CT market presents a lucrative opportunity for stakeholders. Key drivers include the escalating burden of oncology, cardiovascular, and neurological conditions, all of which heavily rely on CT scans for accurate diagnosis and treatment planning. Furthermore, the increasing adoption of low-slice and medium-slice CT scanners, particularly in public and private hospitals seeking cost-effective yet efficient imaging solutions, is contributing to market expansion. Government initiatives aimed at improving healthcare infrastructure and accessibility in remote regions are also expected to boost the demand for CT equipment.
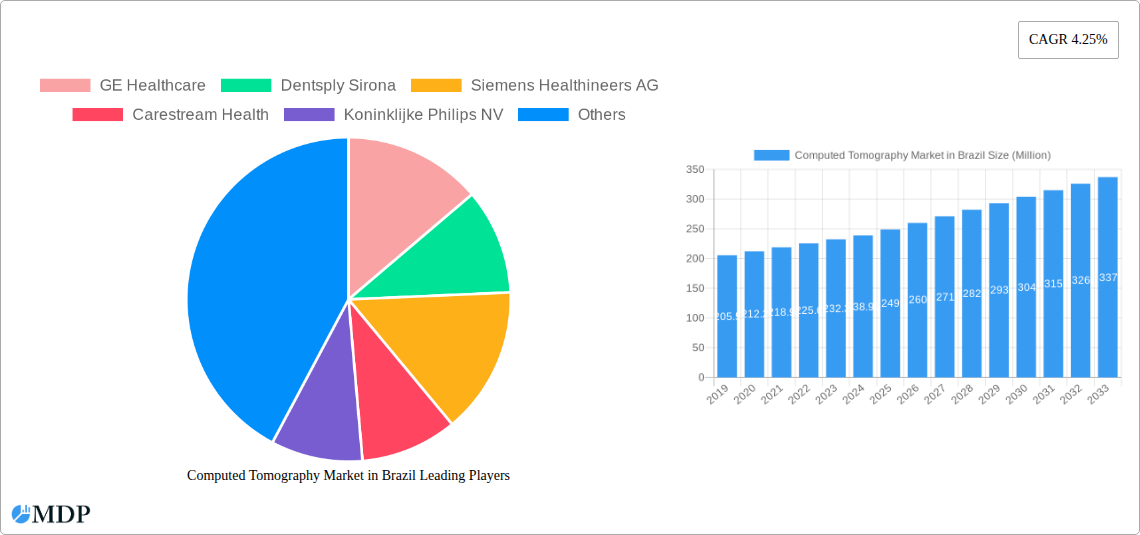
Computed Tomography Market in Brazil Market Size (In Million)
The market segmentation reveals a dynamic landscape. While low and medium slice CT systems cater to a broader demand owing to their affordability and suitability for a range of common diagnostic needs, the high slice CT segment is anticipated to witness robust growth driven by advancements in technology and increasing demand for ultra-high resolution imaging in specialized applications like neurology and oncology. Diagnostic centers and hospitals are the primary end-users, with hospitals, especially those in urban centers, leading the adoption of cutting-edge CT technologies. Trends such as the integration of artificial intelligence (AI) in CT image analysis, the development of portable and mobile CT units for enhanced accessibility, and the focus on radiation dose reduction technologies are shaping the competitive environment. Despite the promising outlook, factors such as the high initial investment cost of advanced CT systems and the need for skilled personnel for operation and maintenance may pose certain restraints, albeit these are being addressed through technological advancements and evolving service models.
Computed Tomography Market in Brazil Company Market Share
Comprehensive Report: Computed Tomography (CT) Market in Brazil – Trends, Opportunities, and Growth Projections (2019-2033)
Dive deep into the burgeoning Computed Tomography (CT) market in Brazil with this in-depth analytical report. Covering the study period from 2019 to 2033, with a base year of 2025 and a forecast period extending from 2025 to 2033, this report provides an indispensable resource for understanding market dynamics, segmentation, and future trajectory. We analyze key segments including CT scanner types (Low Slice, Medium Slice, High Slice), critical applications such as oncology CT scans, neurology CT scans, cardiovascular CT scans, musculoskeletal CT scans, and other applications. Furthermore, we scrutinize end-user preferences across hospitals, diagnostic centers, and other end users.
This report offers unparalleled insights into the Brazilian CT scanner market, identifying key growth drivers, technological advancements, and strategic imperatives for market leaders. With a focus on actionable intelligence, stakeholders can leverage this report to capitalize on emerging opportunities and navigate market challenges. Essential for medical imaging market analysis in Brazil, radiology equipment trends, and healthcare technology investment in Brazil, this comprehensive study is your guide to the Computed Tomography market in Brazil.
Computed Tomography Market in Brazil Market Dynamics & Concentration
The Computed Tomography (CT) market in Brazil exhibits a moderate to high concentration, with a few key global players dominating market share. Siemens Healthineers AG, GE Healthcare, and Koninklijke Philips NV are prominent entities, frequently vying for leadership through innovation and strategic acquisitions. The market is driven by continuous innovation in imaging technology, leading to enhanced diagnostic accuracy and patient outcomes, particularly in critical areas like oncology CT scans and neurology CT scans. Regulatory frameworks in Brazil, while evolving, play a crucial role in dictating market access and product approvals for advanced CT scanner types. The availability of product substitutes, though limited for advanced diagnostic imaging, exists in the form of MRI and ultrasound, influencing market segmentation and pricing strategies. End-user trends are shifting towards a greater demand for integrated imaging solutions and AI-powered diagnostic tools, pushing providers to invest in research and development. Merger and Acquisition (M&A) activities, while not overtly frequent, are strategic, aiming to consolidate market presence and expand service offerings. For instance, the market has seen M&A deal counts of approximately 3-5 significant deals over the past decade, primarily involving smaller regional distributors or technology integration firms. The estimated market share for leading players like Siemens Healthineers AG hovers around 25-30%, with GE Healthcare and Philips following closely.
Computed Tomography Market in Brazil Industry Trends & Analysis
The Computed Tomography (CT) market in Brazil is poised for robust growth, driven by increasing healthcare expenditure, a rising prevalence of chronic diseases, and the ongoing technological evolution of imaging equipment. The market is anticipated to experience a Compound Annual Growth Rate (CAGR) of approximately 7-9% during the forecast period (2025-2033). This growth is fueled by the escalating demand for precise diagnostic tools across various medical applications, including oncology CT scans, neurology CT scans, and cardiovascular CT scans. The penetration of advanced CT technology, especially in urban and semi-urban areas, is steadily increasing, supported by government initiatives aimed at improving healthcare infrastructure and accessibility. Technological disruptions are at the forefront, with the integration of Artificial Intelligence (AI) into CT scanners revolutionizing image acquisition, reconstruction, and analysis, leading to faster diagnoses and reduced radiation exposure for patients. Innovations in spectral CT, dual-energy CT, and photon-counting detectors are enhancing diagnostic capabilities, allowing for better differentiation of tissues and detection of subtle pathologies. Consumer preferences are leaning towards less invasive diagnostic procedures and faster scan times, which modern CT technology effectively addresses. Competitive dynamics are characterized by intense R&D investments, strategic partnerships between technology providers and healthcare institutions, and a focus on cost-effectiveness and efficiency. Market penetration of high-end CT scanners is expected to rise, particularly in specialized diagnostic centers and leading hospitals catering to a growing patient pool seeking advanced medical solutions. The overall market value is projected to reach an estimated US$ 800 Million by 2033.
Leading Markets & Segments in Computed Tomography Market in Brazil
The Computed Tomography (CT) market in Brazil is characterized by significant growth across various segments, with certain applications and end-users demonstrating pronounced dominance.
Application Dominance:
- Oncology CT Scans: This segment is a primary growth driver due to the increasing incidence of cancer in Brazil and the critical role of CT in cancer detection, staging, and treatment monitoring. Economic policies supporting cancer care and infrastructure development in oncology centers contribute to its leadership.
- Neurology CT Scans: The rising burden of neurological disorders, including stroke, Alzheimer's, and traumatic brain injuries, propels the demand for CT imaging. Advancements in neuroimaging technology and the availability of mobile stroke units further bolster this segment.
- Cardiovascular CT Scans: With the growing prevalence of cardiovascular diseases, CT angiography and cardiac CT are becoming indispensable for diagnosis and risk stratification. Improved cardiac imaging techniques and increased accessibility in hospitals are key factors.
- Musculoskeletal CT Scans: While a significant segment, its growth is more moderate compared to oncology and neurology, driven by trauma cases and degenerative conditions.
End-User Dominance:
- Hospitals: Hospitals, particularly large private and public institutions, represent the largest end-user segment. Their comprehensive healthcare services, extensive patient influx, and investment capacity in advanced medical equipment make them prime consumers of CT technology. The Brazilian government’s focus on strengthening public healthcare infrastructure and the growth of private hospital networks further amplify this dominance.
- Diagnostic Centers: These centers are emerging as significant players, driven by their specialized focus on medical imaging and increasing demand for outpatient diagnostic services. Their agility in adopting new technologies and competitive pricing models contribute to their expansion.
Segment Dominance by CT Scanner Type:
- Medium Slice CT Scanners: Currently, medium slice CT scanners constitute a substantial portion of the market due to their balanced performance and cost-effectiveness, catering to a broad range of diagnostic needs in both hospitals and diagnostic centers.
- High Slice CT Scanners: This segment is experiencing rapid growth, driven by the demand for advanced imaging capabilities in specialized applications like oncology and cardiovascular imaging. Technological advancements and increasing healthcare budgets are key enablers.
- Low Slice CT Scanners: While still relevant for basic imaging needs, their market share is gradually decreasing as facilities upgrade to higher slice count systems.
The projected market value for the CT scanner market in Brazil is estimated to reach US$ 800 Million by 2033.
Computed Tomography Market in Brazil Product Developments
Product innovation in the Computed Tomography (CT) market in Brazil is primarily focused on enhancing image quality, reducing scan times, and minimizing radiation dose. Leading companies are developing CT scanners with higher slice counts and advanced detector technologies, such as photon-counting detectors, to enable more detailed anatomical visualization and functional imaging. The integration of Artificial Intelligence (AI) algorithms for image reconstruction, noise reduction, and automated analysis is a significant trend, improving diagnostic accuracy and workflow efficiency. Furthermore, specialized CT solutions for specific applications, like mobile CT scanners for emergency response and portable CT units for point-of-care diagnostics, are gaining traction. These developments aim to provide competitive advantages by offering superior diagnostic performance, improved patient comfort, and greater operational flexibility for healthcare providers.
Key Drivers of Computed Tomography Market in Brazil Growth
The Computed Tomography (CT) market in Brazil is propelled by a confluence of technological, economic, and demographic factors. A primary driver is the increasing prevalence of chronic diseases, such as cancer, cardiovascular ailments, and neurological disorders, which necessitates advanced diagnostic imaging for early detection and effective management. Furthermore, growing healthcare expenditure by both the government and private sectors is enabling greater investment in medical infrastructure and advanced medical equipment, including CT scanners. Technological advancements in CT imaging, leading to higher resolution, faster scanning, and reduced radiation exposure, are making these systems more appealing and accessible. The expanding network of hospitals and diagnostic centers, particularly in underserved regions, is also contributing to market expansion. Finally, favorable regulatory policies and government initiatives aimed at improving public health outcomes and modernizing healthcare facilities further stimulate demand for CT technology.
Challenges in the Computed Tomography Market in Brazil Market
Despite its growth potential, the Computed Tomography (CT) market in Brazil faces several challenges. High acquisition and maintenance costs of advanced CT scanners can be a significant barrier, especially for smaller healthcare facilities and in regions with limited financial resources. Limited reimbursement rates for certain CT procedures can also impact adoption. Regulatory hurdles and lengthy approval processes for new medical devices can slow down market entry for innovative products. Furthermore, shortages of trained radiographers and radiologists, particularly in specialized CT applications, can limit the effective utilization of sophisticated equipment. Infrastructure limitations in some areas, including inconsistent power supply and lack of robust IT networks required for advanced imaging systems, pose additional challenges. The dynamic economic climate and currency fluctuations can also affect the import of expensive medical equipment.
Emerging Opportunities in Computed Tomography Market in Brazil
Emerging opportunities in the Computed Tomography (CT) market in Brazil are abundant, driven by ongoing advancements and evolving healthcare needs. The increasing adoption of Artificial Intelligence (AI) in medical imaging presents a significant growth avenue, offering enhanced diagnostic capabilities, predictive analytics, and workflow optimization. The development and deployment of mobile CT scanners and point-of-care CT solutions are creating new market segments, particularly for emergency medical services and remote healthcare delivery. Strategic partnerships between CT scanner manufacturers, software developers, and healthcare providers are fostering innovation and expanding market reach. Growing awareness and demand for specialized imaging in areas like interventional radiology and personalized medicine are creating opportunities for high-end CT systems with advanced functionalities. Furthermore, the expansion of private healthcare services and the continuous need for upgrading existing medical infrastructure in public hospitals provide a fertile ground for market growth.
Leading Players in the Computed Tomography Market in Brazil Sector
- GE Healthcare
- Dentsply Sirona
- Siemens Healthineers AG
- Carestream Health
- Koninklijke Philips NV
- Canon Medical Systems Corporation
- Samsung Medison
- Planmeca Group (Planmed OY)
Key Milestones in Computed Tomography Market in Brazil Industry
- June 2020: Agfa and VMI Technologies formed a partnership agreement to launch computed tomography production in Brazil, signaling a move towards localized manufacturing and potential cost efficiencies.
- November 2020: A Samsung NeuroLogica Mobile Stroke CT scanner was donated to the Santa Lucia Hospital Network in Brasilia, Brazil, highlighting the growing importance of rapid diagnostic tools for acute neurological conditions and the role of corporate social responsibility in market penetration.
Strategic Outlook for Computed Tomography Market in Brazil Market
The strategic outlook for the Computed Tomography (CT) market in Brazil is highly positive, characterized by sustained growth and evolving technological integration. Key growth accelerators include the continued demand for advanced diagnostic imaging driven by the increasing burden of chronic diseases and an aging population. The strategic focus on expanding healthcare access and improving the quality of medical services across the nation will further bolster the adoption of CT technology, particularly in underserved regions. Innovations in AI-powered diagnostics, photon-counting CT, and portable imaging solutions are expected to shape future market offerings and create new avenues for revenue generation. Collaboration between global manufacturers, local distributors, and healthcare institutions will be crucial for navigating regulatory landscapes and tailoring solutions to the specific needs of the Brazilian market. The market is poised for significant expansion, driven by a commitment to enhancing diagnostic accuracy, improving patient outcomes, and increasing operational efficiency within the healthcare ecosystem.
Computed Tomography Market in Brazil Segmentation
-
1. Type
- 1.1. Low Slice
- 1.2. Medium Slice
- 1.3. High Slice
-
2. Application
- 2.1. Oncology
- 2.2. Neurology
- 2.3. Cardiovascular
- 2.4. Musculoskeletal
- 2.5. Other Applications
-
3. End User
- 3.1. Hospitals
- 3.2. Diagnostic Centers
- 3.3. Other End Users
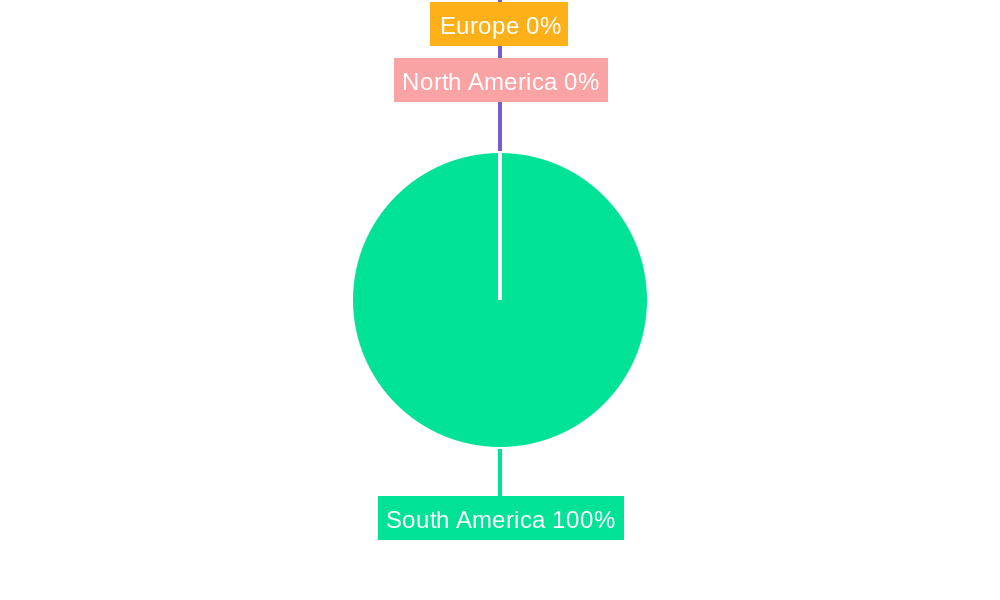
Computed Tomography Market in Brazil Segmentation By Geography
-
1. North America
- 1.1. United States
- 1.2. Canada
- 1.3. Mexico
-
2. South America
- 2.1. Brazil
- 2.2. Argentina
- 2.3. Rest of South America
-
3. Europe
- 3.1. United Kingdom
- 3.2. Germany
- 3.3. France
- 3.4. Italy
- 3.5. Spain
- 3.6. Russia
- 3.7. Benelux
- 3.8. Nordics
- 3.9. Rest of Europe
-
4. Middle East & Africa
- 4.1. Turkey
- 4.2. Israel
- 4.3. GCC
- 4.4. North Africa
- 4.5. South Africa
- 4.6. Rest of Middle East & Africa
-
5. Asia Pacific
- 5.1. China
- 5.2. India
- 5.3. Japan
- 5.4. South Korea
- 5.5. ASEAN
- 5.6. Oceania
- 5.7. Rest of Asia Pacific
Computed Tomography Market in Brazil Regional Market Share
Geographic Coverage of Computed Tomography Market in Brazil
Computed Tomography Market in Brazil REPORT HIGHLIGHTS
| Aspects | Details |
|---|---|
| Study Period | 2020-2034 |
| Base Year | 2025 |
| Estimated Year | 2026 |
| Forecast Period | 2026-2034 |
| Historical Period | 2020-2025 |
| Growth Rate | CAGR of 4.25% from 2020-2034 |
| Segmentation |
|
Table of Contents
- 1. Introduction
- 1.1. Research Scope
- 1.2. Market Segmentation
- 1.3. Research Methodology
- 1.4. Definitions and Assumptions
- 2. Executive Summary
- 2.1. Introduction
- 3. Market Dynamics
- 3.1. Introduction
- 3.2. Market Drivers
- 3.2.1. Increasing Prevalence of Chronic Diseases; Rising Geriatric Population; Increasing Technological Advancements
- 3.3. Market Restrains
- 3.3.1. Lack Of Proper Reimbursement And Stringent Regulatory Approval Procedures; High Cost of Equipment
- 3.4. Market Trends
- 3.4.1. Oncology Segment is Expected to Hold a Significant Market Share Over the Forecast Period
- 4. Market Factor Analysis
- 4.1. Porters Five Forces
- 4.2. Supply/Value Chain
- 4.3. PESTEL analysis
- 4.4. Market Entropy
- 4.5. Patent/Trademark Analysis
- 5. Global Computed Tomography Market in Brazil Analysis, Insights and Forecast, 2020-2032
- 5.1. Market Analysis, Insights and Forecast - by Type
- 5.1.1. Low Slice
- 5.1.2. Medium Slice
- 5.1.3. High Slice
- 5.2. Market Analysis, Insights and Forecast - by Application
- 5.2.1. Oncology
- 5.2.2. Neurology
- 5.2.3. Cardiovascular
- 5.2.4. Musculoskeletal
- 5.2.5. Other Applications
- 5.3. Market Analysis, Insights and Forecast - by End User
- 5.3.1. Hospitals
- 5.3.2. Diagnostic Centers
- 5.3.3. Other End Users
- 5.4. Market Analysis, Insights and Forecast - by Region
- 5.4.1. North America
- 5.4.2. South America
- 5.4.3. Europe
- 5.4.4. Middle East & Africa
- 5.4.5. Asia Pacific
- 5.1. Market Analysis, Insights and Forecast - by Type
- 6. North America Computed Tomography Market in Brazil Analysis, Insights and Forecast, 2020-2032
- 6.1. Market Analysis, Insights and Forecast - by Type
- 6.1.1. Low Slice
- 6.1.2. Medium Slice
- 6.1.3. High Slice
- 6.2. Market Analysis, Insights and Forecast - by Application
- 6.2.1. Oncology
- 6.2.2. Neurology
- 6.2.3. Cardiovascular
- 6.2.4. Musculoskeletal
- 6.2.5. Other Applications
- 6.3. Market Analysis, Insights and Forecast - by End User
- 6.3.1. Hospitals
- 6.3.2. Diagnostic Centers
- 6.3.3. Other End Users
- 6.1. Market Analysis, Insights and Forecast - by Type
- 7. South America Computed Tomography Market in Brazil Analysis, Insights and Forecast, 2020-2032
- 7.1. Market Analysis, Insights and Forecast - by Type
- 7.1.1. Low Slice
- 7.1.2. Medium Slice
- 7.1.3. High Slice
- 7.2. Market Analysis, Insights and Forecast - by Application
- 7.2.1. Oncology
- 7.2.2. Neurology
- 7.2.3. Cardiovascular
- 7.2.4. Musculoskeletal
- 7.2.5. Other Applications
- 7.3. Market Analysis, Insights and Forecast - by End User
- 7.3.1. Hospitals
- 7.3.2. Diagnostic Centers
- 7.3.3. Other End Users
- 7.1. Market Analysis, Insights and Forecast - by Type
- 8. Europe Computed Tomography Market in Brazil Analysis, Insights and Forecast, 2020-2032
- 8.1. Market Analysis, Insights and Forecast - by Type
- 8.1.1. Low Slice
- 8.1.2. Medium Slice
- 8.1.3. High Slice
- 8.2. Market Analysis, Insights and Forecast - by Application
- 8.2.1. Oncology
- 8.2.2. Neurology
- 8.2.3. Cardiovascular
- 8.2.4. Musculoskeletal
- 8.2.5. Other Applications
- 8.3. Market Analysis, Insights and Forecast - by End User
- 8.3.1. Hospitals
- 8.3.2. Diagnostic Centers
- 8.3.3. Other End Users
- 8.1. Market Analysis, Insights and Forecast - by Type
- 9. Middle East & Africa Computed Tomography Market in Brazil Analysis, Insights and Forecast, 2020-2032
- 9.1. Market Analysis, Insights and Forecast - by Type
- 9.1.1. Low Slice
- 9.1.2. Medium Slice
- 9.1.3. High Slice
- 9.2. Market Analysis, Insights and Forecast - by Application
- 9.2.1. Oncology
- 9.2.2. Neurology
- 9.2.3. Cardiovascular
- 9.2.4. Musculoskeletal
- 9.2.5. Other Applications
- 9.3. Market Analysis, Insights and Forecast - by End User
- 9.3.1. Hospitals
- 9.3.2. Diagnostic Centers
- 9.3.3. Other End Users
- 9.1. Market Analysis, Insights and Forecast - by Type
- 10. Asia Pacific Computed Tomography Market in Brazil Analysis, Insights and Forecast, 2020-2032
- 10.1. Market Analysis, Insights and Forecast - by Type
- 10.1.1. Low Slice
- 10.1.2. Medium Slice
- 10.1.3. High Slice
- 10.2. Market Analysis, Insights and Forecast - by Application
- 10.2.1. Oncology
- 10.2.2. Neurology
- 10.2.3. Cardiovascular
- 10.2.4. Musculoskeletal
- 10.2.5. Other Applications
- 10.3. Market Analysis, Insights and Forecast - by End User
- 10.3.1. Hospitals
- 10.3.2. Diagnostic Centers
- 10.3.3. Other End Users
- 10.1. Market Analysis, Insights and Forecast - by Type
- 11. Competitive Analysis
- 11.1. Global Market Share Analysis 2025
- 11.2. Company Profiles
- 11.2.1 GE Healthcare
- 11.2.1.1. Overview
- 11.2.1.2. Products
- 11.2.1.3. SWOT Analysis
- 11.2.1.4. Recent Developments
- 11.2.1.5. Financials (Based on Availability)
- 11.2.2 Dentsply Sirona
- 11.2.2.1. Overview
- 11.2.2.2. Products
- 11.2.2.3. SWOT Analysis
- 11.2.2.4. Recent Developments
- 11.2.2.5. Financials (Based on Availability)
- 11.2.3 Siemens Healthineers AG
- 11.2.3.1. Overview
- 11.2.3.2. Products
- 11.2.3.3. SWOT Analysis
- 11.2.3.4. Recent Developments
- 11.2.3.5. Financials (Based on Availability)
- 11.2.4 Carestream Health
- 11.2.4.1. Overview
- 11.2.4.2. Products
- 11.2.4.3. SWOT Analysis
- 11.2.4.4. Recent Developments
- 11.2.4.5. Financials (Based on Availability)
- 11.2.5 Koninklijke Philips NV
- 11.2.5.1. Overview
- 11.2.5.2. Products
- 11.2.5.3. SWOT Analysis
- 11.2.5.4. Recent Developments
- 11.2.5.5. Financials (Based on Availability)
- 11.2.6 Canon Medical Systems Corporation
- 11.2.6.1. Overview
- 11.2.6.2. Products
- 11.2.6.3. SWOT Analysis
- 11.2.6.4. Recent Developments
- 11.2.6.5. Financials (Based on Availability)
- 11.2.7 Samsung Medison
- 11.2.7.1. Overview
- 11.2.7.2. Products
- 11.2.7.3. SWOT Analysis
- 11.2.7.4. Recent Developments
- 11.2.7.5. Financials (Based on Availability)
- 11.2.8 Planmeca Group (Planmed OY)
- 11.2.8.1. Overview
- 11.2.8.2. Products
- 11.2.8.3. SWOT Analysis
- 11.2.8.4. Recent Developments
- 11.2.8.5. Financials (Based on Availability)
- 11.2.1 GE Healthcare
List of Figures
- Figure 1: Global Computed Tomography Market in Brazil Revenue Breakdown (Million, %) by Region 2025 & 2033
- Figure 2: North America Computed Tomography Market in Brazil Revenue (Million), by Type 2025 & 2033
- Figure 3: North America Computed Tomography Market in Brazil Revenue Share (%), by Type 2025 & 2033
- Figure 4: North America Computed Tomography Market in Brazil Revenue (Million), by Application 2025 & 2033
- Figure 5: North America Computed Tomography Market in Brazil Revenue Share (%), by Application 2025 & 2033
- Figure 6: North America Computed Tomography Market in Brazil Revenue (Million), by End User 2025 & 2033
- Figure 7: North America Computed Tomography Market in Brazil Revenue Share (%), by End User 2025 & 2033
- Figure 8: North America Computed Tomography Market in Brazil Revenue (Million), by Country 2025 & 2033
- Figure 9: North America Computed Tomography Market in Brazil Revenue Share (%), by Country 2025 & 2033
- Figure 10: South America Computed Tomography Market in Brazil Revenue (Million), by Type 2025 & 2033
- Figure 11: South America Computed Tomography Market in Brazil Revenue Share (%), by Type 2025 & 2033
- Figure 12: South America Computed Tomography Market in Brazil Revenue (Million), by Application 2025 & 2033
- Figure 13: South America Computed Tomography Market in Brazil Revenue Share (%), by Application 2025 & 2033
- Figure 14: South America Computed Tomography Market in Brazil Revenue (Million), by End User 2025 & 2033
- Figure 15: South America Computed Tomography Market in Brazil Revenue Share (%), by End User 2025 & 2033
- Figure 16: South America Computed Tomography Market in Brazil Revenue (Million), by Country 2025 & 2033
- Figure 17: South America Computed Tomography Market in Brazil Revenue Share (%), by Country 2025 & 2033
- Figure 18: Europe Computed Tomography Market in Brazil Revenue (Million), by Type 2025 & 2033
- Figure 19: Europe Computed Tomography Market in Brazil Revenue Share (%), by Type 2025 & 2033
- Figure 20: Europe Computed Tomography Market in Brazil Revenue (Million), by Application 2025 & 2033
- Figure 21: Europe Computed Tomography Market in Brazil Revenue Share (%), by Application 2025 & 2033
- Figure 22: Europe Computed Tomography Market in Brazil Revenue (Million), by End User 2025 & 2033
- Figure 23: Europe Computed Tomography Market in Brazil Revenue Share (%), by End User 2025 & 2033
- Figure 24: Europe Computed Tomography Market in Brazil Revenue (Million), by Country 2025 & 2033
- Figure 25: Europe Computed Tomography Market in Brazil Revenue Share (%), by Country 2025 & 2033
- Figure 26: Middle East & Africa Computed Tomography Market in Brazil Revenue (Million), by Type 2025 & 2033
- Figure 27: Middle East & Africa Computed Tomography Market in Brazil Revenue Share (%), by Type 2025 & 2033
- Figure 28: Middle East & Africa Computed Tomography Market in Brazil Revenue (Million), by Application 2025 & 2033
- Figure 29: Middle East & Africa Computed Tomography Market in Brazil Revenue Share (%), by Application 2025 & 2033
- Figure 30: Middle East & Africa Computed Tomography Market in Brazil Revenue (Million), by End User 2025 & 2033
- Figure 31: Middle East & Africa Computed Tomography Market in Brazil Revenue Share (%), by End User 2025 & 2033
- Figure 32: Middle East & Africa Computed Tomography Market in Brazil Revenue (Million), by Country 2025 & 2033
- Figure 33: Middle East & Africa Computed Tomography Market in Brazil Revenue Share (%), by Country 2025 & 2033
- Figure 34: Asia Pacific Computed Tomography Market in Brazil Revenue (Million), by Type 2025 & 2033
- Figure 35: Asia Pacific Computed Tomography Market in Brazil Revenue Share (%), by Type 2025 & 2033
- Figure 36: Asia Pacific Computed Tomography Market in Brazil Revenue (Million), by Application 2025 & 2033
- Figure 37: Asia Pacific Computed Tomography Market in Brazil Revenue Share (%), by Application 2025 & 2033
- Figure 38: Asia Pacific Computed Tomography Market in Brazil Revenue (Million), by End User 2025 & 2033
- Figure 39: Asia Pacific Computed Tomography Market in Brazil Revenue Share (%), by End User 2025 & 2033
- Figure 40: Asia Pacific Computed Tomography Market in Brazil Revenue (Million), by Country 2025 & 2033
- Figure 41: Asia Pacific Computed Tomography Market in Brazil Revenue Share (%), by Country 2025 & 2033
List of Tables
- Table 1: Global Computed Tomography Market in Brazil Revenue Million Forecast, by Type 2020 & 2033
- Table 2: Global Computed Tomography Market in Brazil Revenue Million Forecast, by Application 2020 & 2033
- Table 3: Global Computed Tomography Market in Brazil Revenue Million Forecast, by End User 2020 & 2033
- Table 4: Global Computed Tomography Market in Brazil Revenue Million Forecast, by Region 2020 & 2033
- Table 5: Global Computed Tomography Market in Brazil Revenue Million Forecast, by Type 2020 & 2033
- Table 6: Global Computed Tomography Market in Brazil Revenue Million Forecast, by Application 2020 & 2033
- Table 7: Global Computed Tomography Market in Brazil Revenue Million Forecast, by End User 2020 & 2033
- Table 8: Global Computed Tomography Market in Brazil Revenue Million Forecast, by Country 2020 & 2033
- Table 9: United States Computed Tomography Market in Brazil Revenue (Million) Forecast, by Application 2020 & 2033
- Table 10: Canada Computed Tomography Market in Brazil Revenue (Million) Forecast, by Application 2020 & 2033
- Table 11: Mexico Computed Tomography Market in Brazil Revenue (Million) Forecast, by Application 2020 & 2033
- Table 12: Global Computed Tomography Market in Brazil Revenue Million Forecast, by Type 2020 & 2033
- Table 13: Global Computed Tomography Market in Brazil Revenue Million Forecast, by Application 2020 & 2033
- Table 14: Global Computed Tomography Market in Brazil Revenue Million Forecast, by End User 2020 & 2033
- Table 15: Global Computed Tomography Market in Brazil Revenue Million Forecast, by Country 2020 & 2033
- Table 16: Brazil Computed Tomography Market in Brazil Revenue (Million) Forecast, by Application 2020 & 2033
- Table 17: Argentina Computed Tomography Market in Brazil Revenue (Million) Forecast, by Application 2020 & 2033
- Table 18: Rest of South America Computed Tomography Market in Brazil Revenue (Million) Forecast, by Application 2020 & 2033
- Table 19: Global Computed Tomography Market in Brazil Revenue Million Forecast, by Type 2020 & 2033
- Table 20: Global Computed Tomography Market in Brazil Revenue Million Forecast, by Application 2020 & 2033
- Table 21: Global Computed Tomography Market in Brazil Revenue Million Forecast, by End User 2020 & 2033
- Table 22: Global Computed Tomography Market in Brazil Revenue Million Forecast, by Country 2020 & 2033
- Table 23: United Kingdom Computed Tomography Market in Brazil Revenue (Million) Forecast, by Application 2020 & 2033
- Table 24: Germany Computed Tomography Market in Brazil Revenue (Million) Forecast, by Application 2020 & 2033
- Table 25: France Computed Tomography Market in Brazil Revenue (Million) Forecast, by Application 2020 & 2033
- Table 26: Italy Computed Tomography Market in Brazil Revenue (Million) Forecast, by Application 2020 & 2033
- Table 27: Spain Computed Tomography Market in Brazil Revenue (Million) Forecast, by Application 2020 & 2033
- Table 28: Russia Computed Tomography Market in Brazil Revenue (Million) Forecast, by Application 2020 & 2033
- Table 29: Benelux Computed Tomography Market in Brazil Revenue (Million) Forecast, by Application 2020 & 2033
- Table 30: Nordics Computed Tomography Market in Brazil Revenue (Million) Forecast, by Application 2020 & 2033
- Table 31: Rest of Europe Computed Tomography Market in Brazil Revenue (Million) Forecast, by Application 2020 & 2033
- Table 32: Global Computed Tomography Market in Brazil Revenue Million Forecast, by Type 2020 & 2033
- Table 33: Global Computed Tomography Market in Brazil Revenue Million Forecast, by Application 2020 & 2033
- Table 34: Global Computed Tomography Market in Brazil Revenue Million Forecast, by End User 2020 & 2033
- Table 35: Global Computed Tomography Market in Brazil Revenue Million Forecast, by Country 2020 & 2033
- Table 36: Turkey Computed Tomography Market in Brazil Revenue (Million) Forecast, by Application 2020 & 2033
- Table 37: Israel Computed Tomography Market in Brazil Revenue (Million) Forecast, by Application 2020 & 2033
- Table 38: GCC Computed Tomography Market in Brazil Revenue (Million) Forecast, by Application 2020 & 2033
- Table 39: North Africa Computed Tomography Market in Brazil Revenue (Million) Forecast, by Application 2020 & 2033
- Table 40: South Africa Computed Tomography Market in Brazil Revenue (Million) Forecast, by Application 2020 & 2033
- Table 41: Rest of Middle East & Africa Computed Tomography Market in Brazil Revenue (Million) Forecast, by Application 2020 & 2033
- Table 42: Global Computed Tomography Market in Brazil Revenue Million Forecast, by Type 2020 & 2033
- Table 43: Global Computed Tomography Market in Brazil Revenue Million Forecast, by Application 2020 & 2033
- Table 44: Global Computed Tomography Market in Brazil Revenue Million Forecast, by End User 2020 & 2033
- Table 45: Global Computed Tomography Market in Brazil Revenue Million Forecast, by Country 2020 & 2033
- Table 46: China Computed Tomography Market in Brazil Revenue (Million) Forecast, by Application 2020 & 2033
- Table 47: India Computed Tomography Market in Brazil Revenue (Million) Forecast, by Application 2020 & 2033
- Table 48: Japan Computed Tomography Market in Brazil Revenue (Million) Forecast, by Application 2020 & 2033
- Table 49: South Korea Computed Tomography Market in Brazil Revenue (Million) Forecast, by Application 2020 & 2033
- Table 50: ASEAN Computed Tomography Market in Brazil Revenue (Million) Forecast, by Application 2020 & 2033
- Table 51: Oceania Computed Tomography Market in Brazil Revenue (Million) Forecast, by Application 2020 & 2033
- Table 52: Rest of Asia Pacific Computed Tomography Market in Brazil Revenue (Million) Forecast, by Application 2020 & 2033
Frequently Asked Questions
1. What is the projected Compound Annual Growth Rate (CAGR) of the Computed Tomography Market in Brazil?
The projected CAGR is approximately 4.25%.
2. Which companies are prominent players in the Computed Tomography Market in Brazil?
Key companies in the market include GE Healthcare, Dentsply Sirona, Siemens Healthineers AG, Carestream Health, Koninklijke Philips NV, Canon Medical Systems Corporation, Samsung Medison, Planmeca Group (Planmed OY).
3. What are the main segments of the Computed Tomography Market in Brazil?
The market segments include Type, Application, End User.
4. Can you provide details about the market size?
The market size is estimated to be USD 238.92 Million as of 2022.
5. What are some drivers contributing to market growth?
Increasing Prevalence of Chronic Diseases; Rising Geriatric Population; Increasing Technological Advancements.
6. What are the notable trends driving market growth?
Oncology Segment is Expected to Hold a Significant Market Share Over the Forecast Period.
7. Are there any restraints impacting market growth?
Lack Of Proper Reimbursement And Stringent Regulatory Approval Procedures; High Cost of Equipment.
8. Can you provide examples of recent developments in the market?
In November 2020, a Samsung NeuroLogica Mobile Stroke CT scanner was given to the Santa Lucia Hospital Network in Brasilia, Brazil.
9. What pricing options are available for accessing the report?
Pricing options include single-user, multi-user, and enterprise licenses priced at USD 3800, USD 4500, and USD 5800 respectively.
10. Is the market size provided in terms of value or volume?
The market size is provided in terms of value, measured in Million.
11. Are there any specific market keywords associated with the report?
Yes, the market keyword associated with the report is "Computed Tomography Market in Brazil," which aids in identifying and referencing the specific market segment covered.
12. How do I determine which pricing option suits my needs best?
The pricing options vary based on user requirements and access needs. Individual users may opt for single-user licenses, while businesses requiring broader access may choose multi-user or enterprise licenses for cost-effective access to the report.
13. Are there any additional resources or data provided in the Computed Tomography Market in Brazil report?
While the report offers comprehensive insights, it's advisable to review the specific contents or supplementary materials provided to ascertain if additional resources or data are available.
14. How can I stay updated on further developments or reports in the Computed Tomography Market in Brazil?
To stay informed about further developments, trends, and reports in the Computed Tomography Market in Brazil, consider subscribing to industry newsletters, following relevant companies and organizations, or regularly checking reputable industry news sources and publications.
Methodology
Step 1 - Identification of Relevant Samples Size from Population Database


Step 2 - Approaches for Defining Global Market Size (Value, Volume* & Price*)

Note*: In applicable scenarios
Step 3 - Data Sources
Primary Research
- Web Analytics
- Survey Reports
- Research Institute
- Latest Research Reports
- Opinion Leaders
Secondary Research
- Annual Reports
- White Paper
- Latest Press Release
- Industry Association
- Paid Database
- Investor Presentations

Step 4 - Data Triangulation
Involves using different sources of information in order to increase the validity of a study
These sources are likely to be stakeholders in a program - participants, other researchers, program staff, other community members, and so on.
Then we put all data in single framework & apply various statistical tools to find out the dynamic on the market.
During the analysis stage, feedback from the stakeholder groups would be compared to determine areas of agreement as well as areas of divergence
