

Key Insights
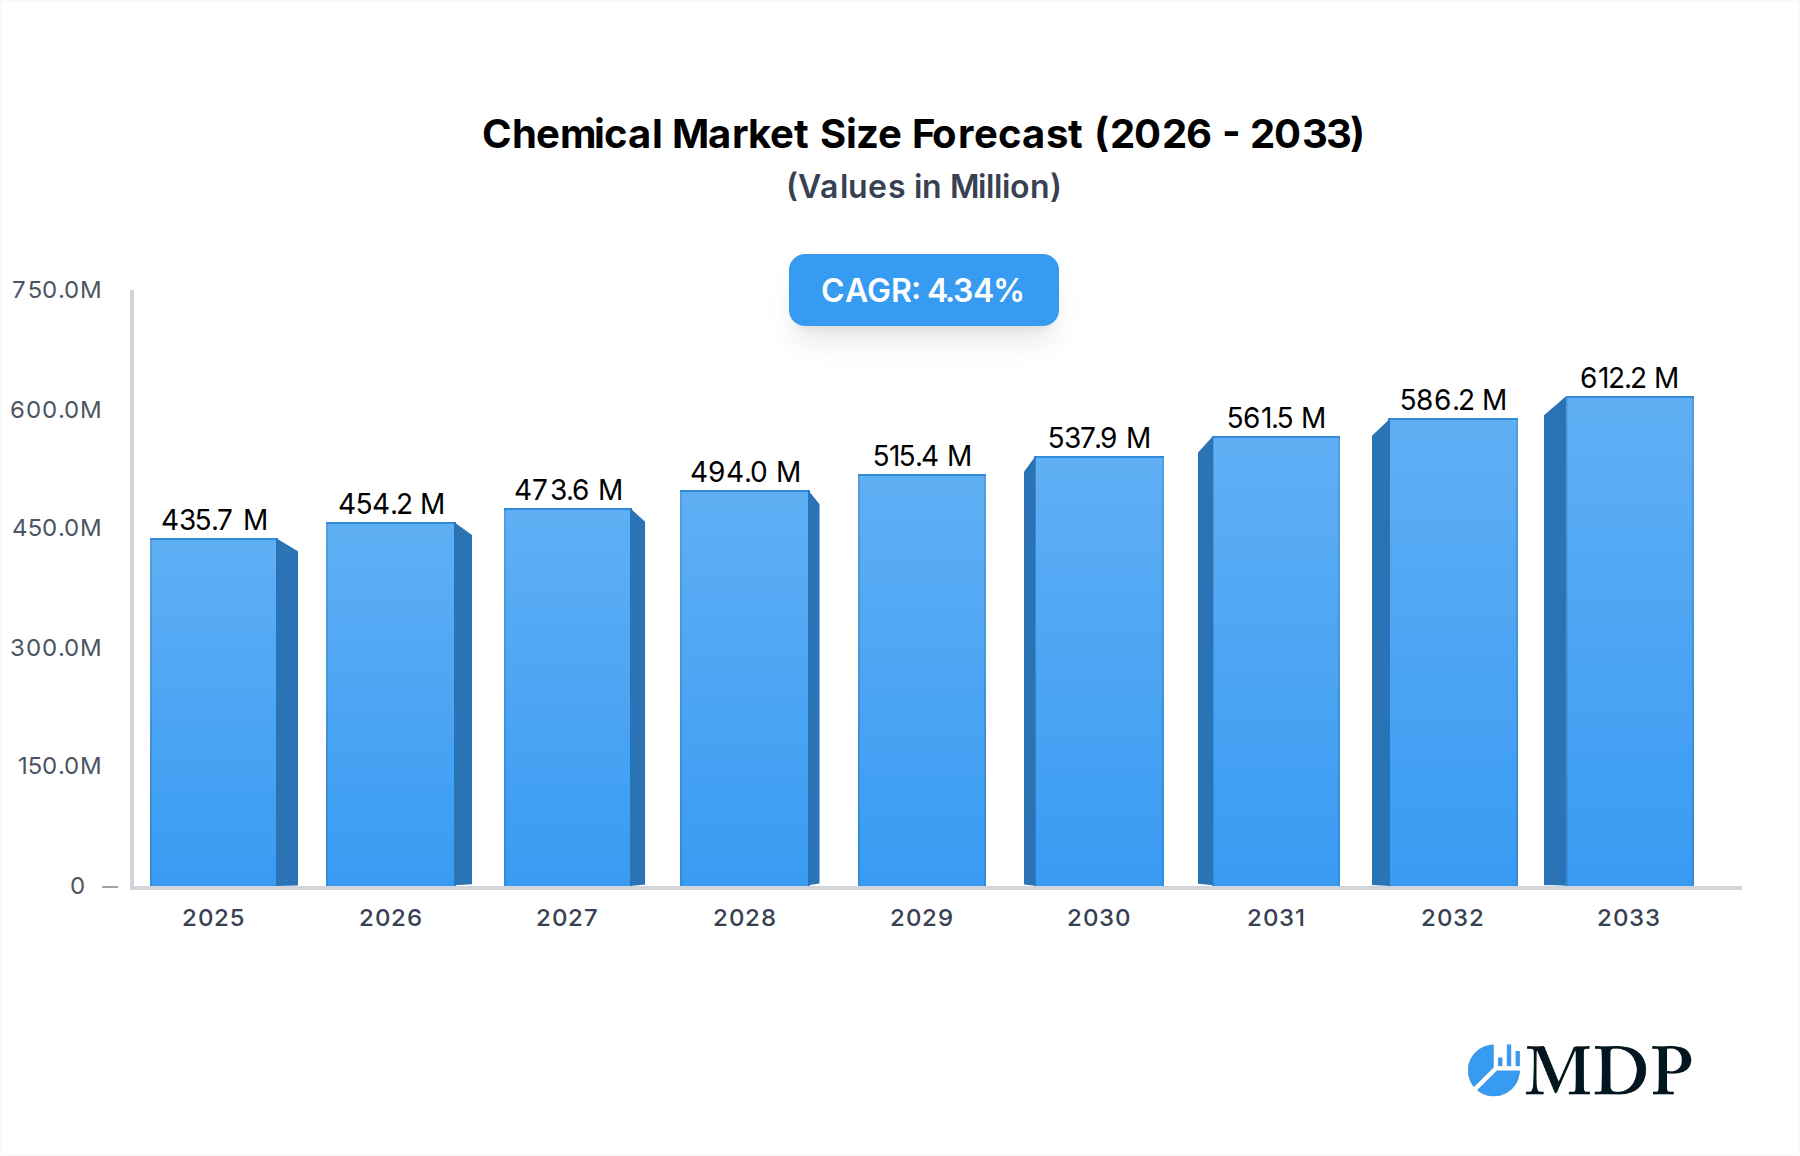
The global market for Chemical & Biological Indicators for Sterilization is projected to reach $435.7 million by 2025, exhibiting a steady Compound Annual Growth Rate (CAGR) of 4.2% during the forecast period of 2025-2033. This robust growth is primarily fueled by the increasing stringency of healthcare regulations, the rising prevalence of hospital-acquired infections (HAIs), and the growing awareness among healthcare facilities regarding the critical role of effective sterilization in patient safety and infection control. The demand for reliable sterilization monitoring solutions is paramount across diverse healthcare settings, including hospitals, clinics, dental practices, and laboratories, to ensure that medical devices and equipment are rendered safe for patient use. Advancements in indicator technology, offering enhanced accuracy and user-friendliness, further contribute to market expansion.

Chemical & Biological Indicators for Sterilization Market Size (In Million)
The market is strategically segmented by application, with Steam Sterilization, VH202 Sterilization, EO Sterilization, and Formaldehyde Sterilization emerging as key areas of focus. Biological indicators are increasingly favored for their definitive proof of microbial kill, while chemical indicators offer rapid, cost-effective monitoring of sterilization parameters. The growth trajectory is also influenced by a widening array of leading market players, including 3M Company, STERIS, and Getinge Group, who are actively investing in research and development to introduce innovative products and expand their global reach. North America and Europe currently represent significant market shares due to well-established healthcare infrastructures and stringent regulatory frameworks, while the Asia Pacific region is anticipated to witness substantial growth driven by increasing healthcare investments and a burgeoning medical device industry.
Chemical & Biological Indicators for Sterilization Company Market Share
Gain unparalleled insights into the global Chemical & Biological Indicators for Sterilization market, a critical sector for healthcare and life sciences. This meticulously researched report provides a deep dive into market dynamics, trends, leading players, and future projections, essential for manufacturers, distributors, regulatory bodies, and investors aiming to navigate this vital industry. Spanning the historical period of 2019–2024 and extending to a forecast period of 2025–2033, with a base year of 2025, this report offers actionable intelligence for strategic decision-making. The global market, projected to reach over $3,000 million, is driven by an increasing focus on patient safety and stringent regulatory compliance across healthcare facilities and pharmaceutical manufacturing.
Chemical & Biological Indicators for Sterilization Market Dynamics & Concentration
The Chemical & Biological Indicators for Sterilization market is characterized by moderate to high concentration, with a significant portion of the market share held by key players. Leading companies like STERIS and Getinge Group are at the forefront, supported by established brands and extensive distribution networks. Innovation is a primary driver, fueled by the constant need for more accurate, faster, and user-friendly sterilization monitoring solutions. Regulatory frameworks, such as ISO 11135 and EN 866, play a crucial role in shaping product development and market entry, demanding rigorous validation and certification processes. While direct product substitutes are limited due to the specialized nature of sterilization assurance, advancements in automated monitoring systems and integrated sterilization solutions present indirect competitive pressures. End-user trends are heavily influenced by the increasing demand for infection prevention in hospitals, dental clinics, and pharmaceutical manufacturing facilities, alongside the growing adoption of advanced sterilization technologies. Mergers and acquisitions (M&A) activities, with an estimated xx M&A deals recorded historically, are a significant factor in market consolidation, allowing larger players to expand their product portfolios and geographic reach.
Chemical & Biological Indicators for Sterilization Industry Trends & Analysis
The Chemical & Biological Indicators for Sterilization industry is poised for robust growth, driven by escalating global healthcare expenditures and a heightened awareness of healthcare-associated infections (HAIs). The market is projected to witness a Compound Annual Growth Rate (CAGR) of approximately 8.5%, reaching a valuation exceeding $3,000 million by 2033. Technological disruptions are a constant, with continuous innovation focusing on developing indicators with improved sensitivity, faster results, and enhanced traceability through digital integration. The increasing complexity of medical devices and the need for validated sterilization processes for novel materials further propel the demand for advanced indicators. Consumer preferences are leaning towards integrated systems that offer real-time monitoring and data logging, simplifying compliance and improving operational efficiency. Competitive dynamics are intensifying, with both established giants and emerging niche players vying for market dominance. Market penetration is steadily increasing across developed economies, while developing regions present significant untapped potential, driven by improving healthcare infrastructure and rising patient safety standards. The ongoing evolution of sterilization techniques, such as low-temperature hydrogen peroxide sterilization (VH202), necessitates the development of specialized indicators, thereby expanding the market scope.
Leading Markets & Segments in Chemical & Biological Indicators for Sterilization
The Steam Sterilization application segment is the dominant force in the Chemical & Biological Indicators for Sterilization market, consistently accounting for over 40% of the global revenue. This dominance is attributed to the widespread adoption of steam sterilization in hospitals, clinics, and laboratories worldwide due to its efficacy, cost-effectiveness, and established track record. Among the types, Biological Indicators hold a substantial market share, valued at over $1,500 million, owing to their ability to provide the highest level of assurance by confirming the actual killing of microorganisms.
- Dominant Region: North America currently leads the global market, driven by a mature healthcare infrastructure, stringent regulatory requirements enforced by bodies like the FDA, and a high adoption rate of advanced medical technologies. The region's robust healthcare spending and the presence of major medical device manufacturers contribute significantly to market leadership.
- Key Drivers for Steam Sterilization Dominance:
- Ubiquitous use in central sterile supply departments (CSSDs).
- Cost-effectiveness and proven reliability.
- Extensive regulatory endorsement for various medical procedures.
- Key Drivers for Biological Indicator Dominance:
- Gold standard for confirming sterilization effectiveness.
- Essential for validating sterilization cycles.
- Critical for meeting regulatory compliance and quality assurance.
- Emerging Segments: While Steam Sterilization leads, VH202 Sterilization is experiencing rapid growth, projected to grow at a CAGR of over 10%, driven by its suitability for heat- and moisture-sensitive instruments. EO Sterilization also holds a significant share, particularly for devices that cannot withstand steam, while Formaldehyde Sterilization, though less prevalent, caters to specific applications.
Chemical & Biological Indicators for Sterilization Product Developments
Product development in the Chemical & Biological Indicators for Sterilization sector is intensely focused on enhancing reliability, speed, and user convenience. Innovations include self-contained biological indicators that simplify handling and reduce contamination risks, alongside advanced chemical indicators offering visual cues for cycle parameters like time, temperature, and pressure. The integration of RFID technology and QR codes is also gaining traction, enabling seamless tracking, data logging, and integration with hospital information systems, thereby improving traceability and compliance. These developments aim to provide definitive assurance of sterilization efficacy across various sterilization modalities, including steam, ethylene oxide, and hydrogen peroxide.
Key Drivers of Chemical & Biological Indicators for Sterilization Growth
Several key factors are propelling the growth of the Chemical & Biological Indicators for Sterilization market. The escalating global prevalence of healthcare-associated infections (HAIs) is a primary driver, emphasizing the critical need for reliable sterilization monitoring to ensure patient safety. Stringent regulatory mandates from health authorities worldwide, requiring validated sterilization processes, further bolster demand. Technological advancements in sterilization equipment and processes necessitate the development of sophisticated indicators to match their capabilities. Moreover, the increasing volume of surgical procedures and the growing number of healthcare facilities, particularly in emerging economies, are expanding the addressable market.
Challenges in the Chemical & Biological Indicators for Sterilization Market
Despite robust growth prospects, the Chemical & Biological Indicators for Sterilization market faces several challenges. Stringent and evolving regulatory requirements can increase the cost and time for product development and market entry. The high initial investment required for research and development, particularly for novel indicator technologies, can be a barrier. Fluctuations in raw material prices and supply chain disruptions can impact manufacturing costs and product availability. Intense competition among established players and the emergence of new entrants can lead to pricing pressures. Furthermore, the need for continuous education and training for healthcare professionals on the correct use and interpretation of indicators presents an ongoing challenge.
Emerging Opportunities in Chemical & Biological Indicators for Sterilization
The Chemical & Biological Indicators for Sterilization market is ripe with emerging opportunities. The rapid adoption of low-temperature sterilization technologies like VH202 sterilization in healthcare settings presents a significant avenue for growth, demanding specialized indicator solutions. The increasing integration of digital technologies, such as IoT and AI, into sterilization monitoring systems offers opportunities for smart indicators that provide real-time data analytics and predictive maintenance capabilities. The growing demand for single-use, pre-packaged indicators in outpatient and ambulatory surgical centers also presents a burgeoning market segment. Strategic partnerships between indicator manufacturers and sterilization equipment providers can lead to the development of synergistic solutions, enhancing product adoption and market reach.
Leading Players in the Chemical & Biological Indicators for Sterilization Sector
- 3M Company
- Andersen Products Inc.
- Mesa Laboratories Inc.
- Cantel Medical Corp.
- Clinichem Oy Ltd.
- E.C.S. S.R.L.
- Etigam Bv
- Getinge Group
- Hu-Friedy Mfg. Co. LLC
- Indilab Inc.
- Matachana Group
- STERIS
- Nigk Corporation
- Parasure Limited
- PMS Healthcare Technologies
- Propper Manufacturing Co. Inc.
- Scican Inc.
- Terragene S.A.
Key Milestones in Chemical & Biological Indicators for Sterilization Industry
- 2019: Introduction of advanced self-contained biological indicators with faster read times.
- 2020: Increased focus on digital integration and traceability solutions for indicators due to pandemic-related supply chain scrutiny.
- 2021: Development of novel chemical indicators specifically designed for novel sterilization modalities like plasma sterilization.
- 2022: Significant M&A activities as larger players acquired innovative smaller companies to expand their portfolios.
- 2023: Enhanced regulatory guidance from bodies like the FDA and EMA on sterilization validation and monitoring practices.
- 2024: Growing adoption of smart indicators with IoT capabilities for remote monitoring and data analytics in healthcare facilities.
Strategic Outlook for Chemical & Biological Indicators for Sterilization Market
The strategic outlook for the Chemical & Biological Indicators for Sterilization market is overwhelmingly positive, driven by an unwavering commitment to patient safety and the continuous evolution of healthcare practices. Future growth will be accelerated by the ongoing development of smart, connected indicators that seamlessly integrate into digital hospital ecosystems, offering enhanced data management and regulatory compliance. The increasing demand for sterile medical supplies in emerging markets, coupled with rising healthcare investments, will unlock significant expansion opportunities. Companies that prioritize innovation in developing indicators for emerging sterilization technologies and focus on building strong strategic partnerships will be well-positioned to capitalize on the expanding market, ensuring the highest standards of sterilization assurance globally.
Chemical & Biological Indicators for Sterilization Segmentation
-
1. Application
- 1.1. Steam Sterilization
- 1.2. VH202 Sterilization
- 1.3. EO Sterilization
- 1.4. Formaldehyde Sterilization
- 1.5. Others
-
2. Types
- 2.1. Biological Indicator
- 2.2. Chemical Indicator
Chemical & Biological Indicators for Sterilization Segmentation By Geography
-
1. North America
- 1.1. United States
- 1.2. Canada
- 1.3. Mexico
-
2. South America
- 2.1. Brazil
- 2.2. Argentina
- 2.3. Rest of South America
-
3. Europe
- 3.1. United Kingdom
- 3.2. Germany
- 3.3. France
- 3.4. Italy
- 3.5. Spain
- 3.6. Russia
- 3.7. Benelux
- 3.8. Nordics
- 3.9. Rest of Europe
-
4. Middle East & Africa
- 4.1. Turkey
- 4.2. Israel
- 4.3. GCC
- 4.4. North Africa
- 4.5. South Africa
- 4.6. Rest of Middle East & Africa
-
5. Asia Pacific
- 5.1. China
- 5.2. India
- 5.3. Japan
- 5.4. South Korea
- 5.5. ASEAN
- 5.6. Oceania
- 5.7. Rest of Asia Pacific
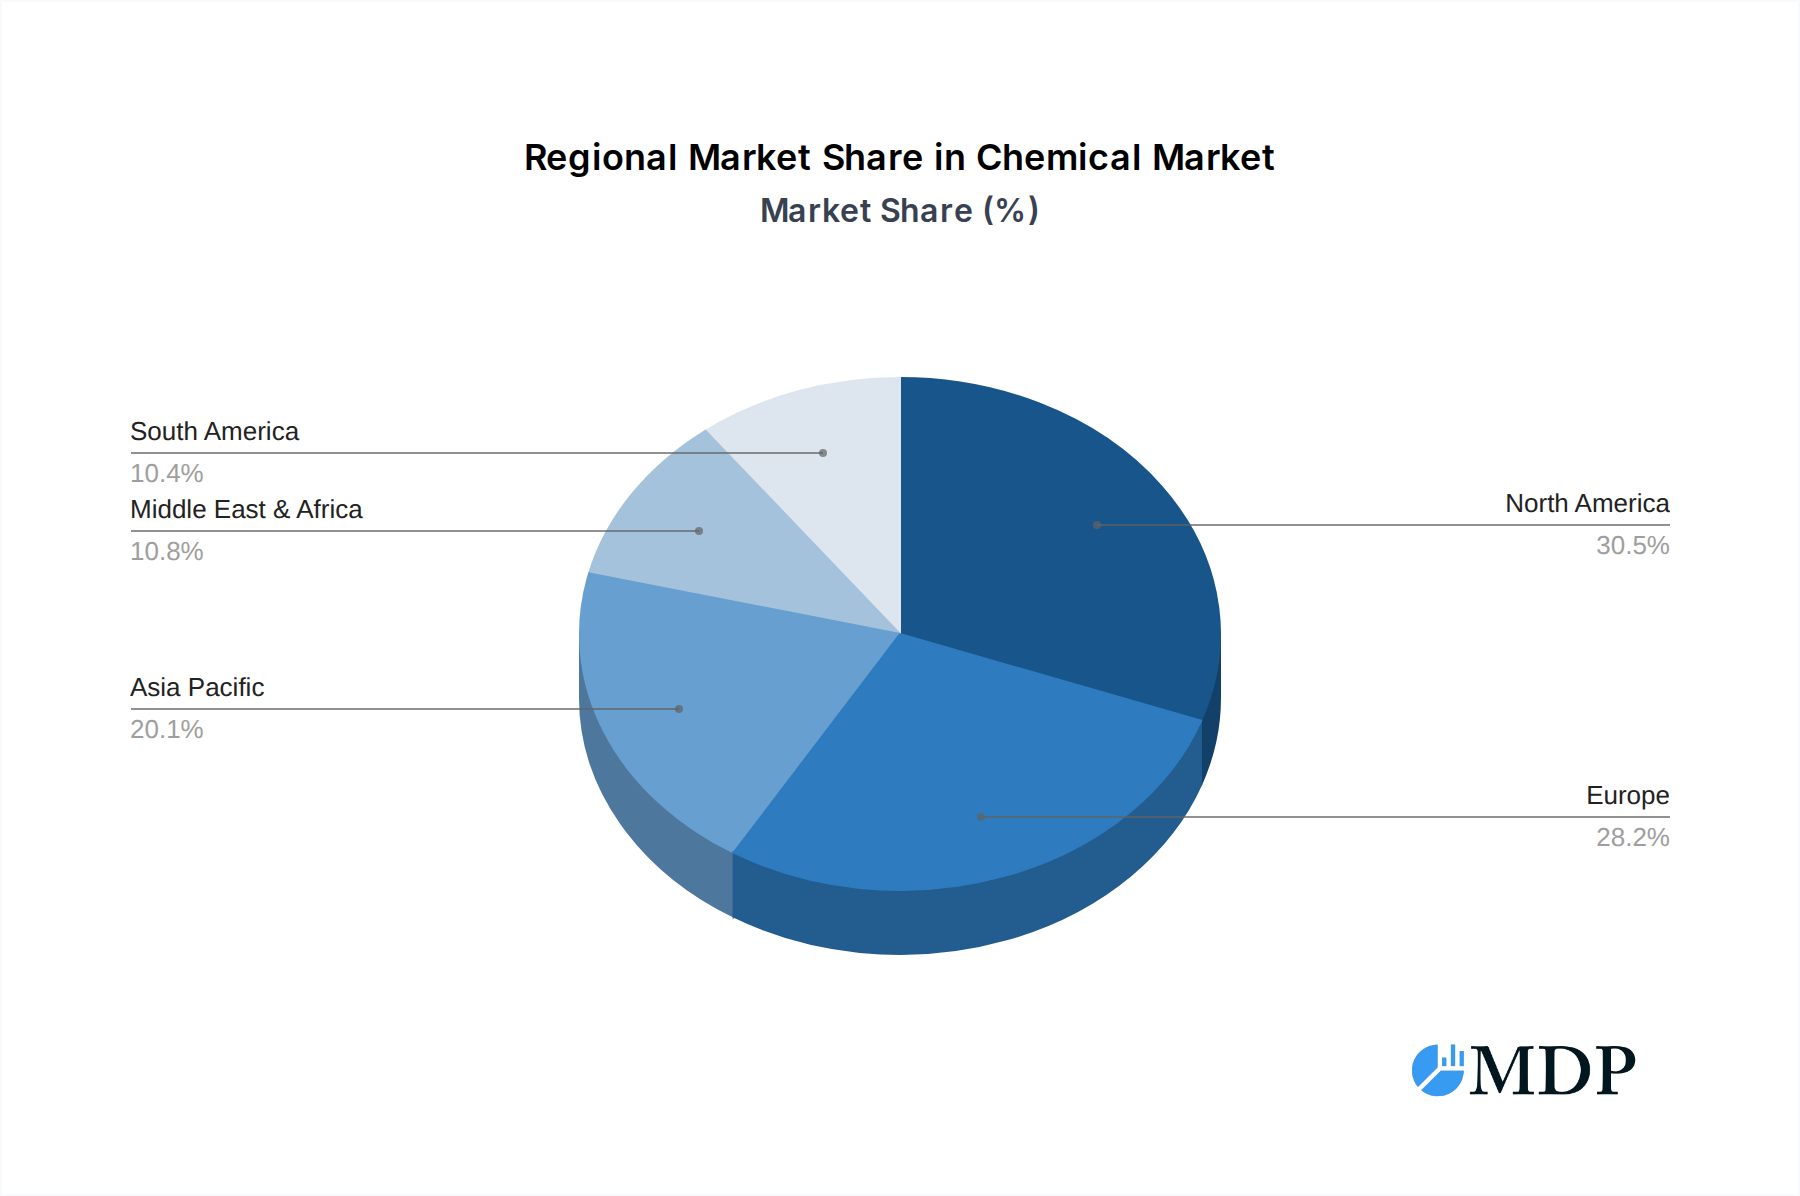
Chemical & Biological Indicators for Sterilization Regional Market Share
Geographic Coverage of Chemical & Biological Indicators for Sterilization
Chemical & Biological Indicators for Sterilization REPORT HIGHLIGHTS
| Aspects | Details |
|---|---|
| Study Period | 2020-2034 |
| Base Year | 2025 |
| Estimated Year | 2026 |
| Forecast Period | 2026-2034 |
| Historical Period | 2020-2025 |
| Growth Rate | CAGR of 4.2% from 2020-2034 |
| Segmentation |
|
Table of Contents
- 1. Introduction
- 1.1. Research Scope
- 1.2. Market Segmentation
- 1.3. Research Methodology
- 1.4. Definitions and Assumptions
- 2. Executive Summary
- 2.1. Introduction
- 3. Market Dynamics
- 3.1. Introduction
- 3.2. Market Drivers
- 3.3. Market Restrains
- 3.4. Market Trends
- 4. Market Factor Analysis
- 4.1. Porters Five Forces
- 4.2. Supply/Value Chain
- 4.3. PESTEL analysis
- 4.4. Market Entropy
- 4.5. Patent/Trademark Analysis
- 5. Global Chemical & Biological Indicators for Sterilization Analysis, Insights and Forecast, 2020-2032
- 5.1. Market Analysis, Insights and Forecast - by Application
- 5.1.1. Steam Sterilization
- 5.1.2. VH202 Sterilization
- 5.1.3. EO Sterilization
- 5.1.4. Formaldehyde Sterilization
- 5.1.5. Others
- 5.2. Market Analysis, Insights and Forecast - by Types
- 5.2.1. Biological Indicator
- 5.2.2. Chemical Indicator
- 5.3. Market Analysis, Insights and Forecast - by Region
- 5.3.1. North America
- 5.3.2. South America
- 5.3.3. Europe
- 5.3.4. Middle East & Africa
- 5.3.5. Asia Pacific
- 5.1. Market Analysis, Insights and Forecast - by Application
- 6. North America Chemical & Biological Indicators for Sterilization Analysis, Insights and Forecast, 2020-2032
- 6.1. Market Analysis, Insights and Forecast - by Application
- 6.1.1. Steam Sterilization
- 6.1.2. VH202 Sterilization
- 6.1.3. EO Sterilization
- 6.1.4. Formaldehyde Sterilization
- 6.1.5. Others
- 6.2. Market Analysis, Insights and Forecast - by Types
- 6.2.1. Biological Indicator
- 6.2.2. Chemical Indicator
- 6.1. Market Analysis, Insights and Forecast - by Application
- 7. South America Chemical & Biological Indicators for Sterilization Analysis, Insights and Forecast, 2020-2032
- 7.1. Market Analysis, Insights and Forecast - by Application
- 7.1.1. Steam Sterilization
- 7.1.2. VH202 Sterilization
- 7.1.3. EO Sterilization
- 7.1.4. Formaldehyde Sterilization
- 7.1.5. Others
- 7.2. Market Analysis, Insights and Forecast - by Types
- 7.2.1. Biological Indicator
- 7.2.2. Chemical Indicator
- 7.1. Market Analysis, Insights and Forecast - by Application
- 8. Europe Chemical & Biological Indicators for Sterilization Analysis, Insights and Forecast, 2020-2032
- 8.1. Market Analysis, Insights and Forecast - by Application
- 8.1.1. Steam Sterilization
- 8.1.2. VH202 Sterilization
- 8.1.3. EO Sterilization
- 8.1.4. Formaldehyde Sterilization
- 8.1.5. Others
- 8.2. Market Analysis, Insights and Forecast - by Types
- 8.2.1. Biological Indicator
- 8.2.2. Chemical Indicator
- 8.1. Market Analysis, Insights and Forecast - by Application
- 9. Middle East & Africa Chemical & Biological Indicators for Sterilization Analysis, Insights and Forecast, 2020-2032
- 9.1. Market Analysis, Insights and Forecast - by Application
- 9.1.1. Steam Sterilization
- 9.1.2. VH202 Sterilization
- 9.1.3. EO Sterilization
- 9.1.4. Formaldehyde Sterilization
- 9.1.5. Others
- 9.2. Market Analysis, Insights and Forecast - by Types
- 9.2.1. Biological Indicator
- 9.2.2. Chemical Indicator
- 9.1. Market Analysis, Insights and Forecast - by Application
- 10. Asia Pacific Chemical & Biological Indicators for Sterilization Analysis, Insights and Forecast, 2020-2032
- 10.1. Market Analysis, Insights and Forecast - by Application
- 10.1.1. Steam Sterilization
- 10.1.2. VH202 Sterilization
- 10.1.3. EO Sterilization
- 10.1.4. Formaldehyde Sterilization
- 10.1.5. Others
- 10.2. Market Analysis, Insights and Forecast - by Types
- 10.2.1. Biological Indicator
- 10.2.2. Chemical Indicator
- 10.1. Market Analysis, Insights and Forecast - by Application
- 11. Competitive Analysis
- 11.1. Global Market Share Analysis 2025
- 11.2. Company Profiles
- 11.2.1 3M Company
- 11.2.1.1. Overview
- 11.2.1.2. Products
- 11.2.1.3. SWOT Analysis
- 11.2.1.4. Recent Developments
- 11.2.1.5. Financials (Based on Availability)
- 11.2.2 Andersen Products Inc.
- 11.2.2.1. Overview
- 11.2.2.2. Products
- 11.2.2.3. SWOT Analysis
- 11.2.2.4. Recent Developments
- 11.2.2.5. Financials (Based on Availability)
- 11.2.3 Mesa Laboratories Inc.
- 11.2.3.1. Overview
- 11.2.3.2. Products
- 11.2.3.3. SWOT Analysis
- 11.2.3.4. Recent Developments
- 11.2.3.5. Financials (Based on Availability)
- 11.2.4 Cantel Medical Corp.
- 11.2.4.1. Overview
- 11.2.4.2. Products
- 11.2.4.3. SWOT Analysis
- 11.2.4.4. Recent Developments
- 11.2.4.5. Financials (Based on Availability)
- 11.2.5 Clinichem Oy Ltd.
- 11.2.5.1. Overview
- 11.2.5.2. Products
- 11.2.5.3. SWOT Analysis
- 11.2.5.4. Recent Developments
- 11.2.5.5. Financials (Based on Availability)
- 11.2.6 E.C.S. S.R.L.
- 11.2.6.1. Overview
- 11.2.6.2. Products
- 11.2.6.3. SWOT Analysis
- 11.2.6.4. Recent Developments
- 11.2.6.5. Financials (Based on Availability)
- 11.2.7 Etigam Bv
- 11.2.7.1. Overview
- 11.2.7.2. Products
- 11.2.7.3. SWOT Analysis
- 11.2.7.4. Recent Developments
- 11.2.7.5. Financials (Based on Availability)
- 11.2.8 Getinge Group
- 11.2.8.1. Overview
- 11.2.8.2. Products
- 11.2.8.3. SWOT Analysis
- 11.2.8.4. Recent Developments
- 11.2.8.5. Financials (Based on Availability)
- 11.2.9 Hu-Friedy Mfg. Co. LLC
- 11.2.9.1. Overview
- 11.2.9.2. Products
- 11.2.9.3. SWOT Analysis
- 11.2.9.4. Recent Developments
- 11.2.9.5. Financials (Based on Availability)
- 11.2.10 Indilab Inc.
- 11.2.10.1. Overview
- 11.2.10.2. Products
- 11.2.10.3. SWOT Analysis
- 11.2.10.4. Recent Developments
- 11.2.10.5. Financials (Based on Availability)
- 11.2.11 Matachana Group
- 11.2.11.1. Overview
- 11.2.11.2. Products
- 11.2.11.3. SWOT Analysis
- 11.2.11.4. Recent Developments
- 11.2.11.5. Financials (Based on Availability)
- 11.2.12 STERIS
- 11.2.12.1. Overview
- 11.2.12.2. Products
- 11.2.12.3. SWOT Analysis
- 11.2.12.4. Recent Developments
- 11.2.12.5. Financials (Based on Availability)
- 11.2.13 Nigk Corporation
- 11.2.13.1. Overview
- 11.2.13.2. Products
- 11.2.13.3. SWOT Analysis
- 11.2.13.4. Recent Developments
- 11.2.13.5. Financials (Based on Availability)
- 11.2.14 Parasure Limited
- 11.2.14.1. Overview
- 11.2.14.2. Products
- 11.2.14.3. SWOT Analysis
- 11.2.14.4. Recent Developments
- 11.2.14.5. Financials (Based on Availability)
- 11.2.15 PMS Healthcare Technologies
- 11.2.15.1. Overview
- 11.2.15.2. Products
- 11.2.15.3. SWOT Analysis
- 11.2.15.4. Recent Developments
- 11.2.15.5. Financials (Based on Availability)
- 11.2.16 Propper Manufacturing Co. Inc.
- 11.2.16.1. Overview
- 11.2.16.2. Products
- 11.2.16.3. SWOT Analysis
- 11.2.16.4. Recent Developments
- 11.2.16.5. Financials (Based on Availability)
- 11.2.17 Scican Inc.
- 11.2.17.1. Overview
- 11.2.17.2. Products
- 11.2.17.3. SWOT Analysis
- 11.2.17.4. Recent Developments
- 11.2.17.5. Financials (Based on Availability)
- 11.2.18 Terragene S.A.
- 11.2.18.1. Overview
- 11.2.18.2. Products
- 11.2.18.3. SWOT Analysis
- 11.2.18.4. Recent Developments
- 11.2.18.5. Financials (Based on Availability)
- 11.2.1 3M Company
List of Figures
- Figure 1: Global Chemical & Biological Indicators for Sterilization Revenue Breakdown (million, %) by Region 2025 & 2033
- Figure 2: North America Chemical & Biological Indicators for Sterilization Revenue (million), by Application 2025 & 2033
- Figure 3: North America Chemical & Biological Indicators for Sterilization Revenue Share (%), by Application 2025 & 2033
- Figure 4: North America Chemical & Biological Indicators for Sterilization Revenue (million), by Types 2025 & 2033
- Figure 5: North America Chemical & Biological Indicators for Sterilization Revenue Share (%), by Types 2025 & 2033
- Figure 6: North America Chemical & Biological Indicators for Sterilization Revenue (million), by Country 2025 & 2033
- Figure 7: North America Chemical & Biological Indicators for Sterilization Revenue Share (%), by Country 2025 & 2033
- Figure 8: South America Chemical & Biological Indicators for Sterilization Revenue (million), by Application 2025 & 2033
- Figure 9: South America Chemical & Biological Indicators for Sterilization Revenue Share (%), by Application 2025 & 2033
- Figure 10: South America Chemical & Biological Indicators for Sterilization Revenue (million), by Types 2025 & 2033
- Figure 11: South America Chemical & Biological Indicators for Sterilization Revenue Share (%), by Types 2025 & 2033
- Figure 12: South America Chemical & Biological Indicators for Sterilization Revenue (million), by Country 2025 & 2033
- Figure 13: South America Chemical & Biological Indicators for Sterilization Revenue Share (%), by Country 2025 & 2033
- Figure 14: Europe Chemical & Biological Indicators for Sterilization Revenue (million), by Application 2025 & 2033
- Figure 15: Europe Chemical & Biological Indicators for Sterilization Revenue Share (%), by Application 2025 & 2033
- Figure 16: Europe Chemical & Biological Indicators for Sterilization Revenue (million), by Types 2025 & 2033
- Figure 17: Europe Chemical & Biological Indicators for Sterilization Revenue Share (%), by Types 2025 & 2033
- Figure 18: Europe Chemical & Biological Indicators for Sterilization Revenue (million), by Country 2025 & 2033
- Figure 19: Europe Chemical & Biological Indicators for Sterilization Revenue Share (%), by Country 2025 & 2033
- Figure 20: Middle East & Africa Chemical & Biological Indicators for Sterilization Revenue (million), by Application 2025 & 2033
- Figure 21: Middle East & Africa Chemical & Biological Indicators for Sterilization Revenue Share (%), by Application 2025 & 2033
- Figure 22: Middle East & Africa Chemical & Biological Indicators for Sterilization Revenue (million), by Types 2025 & 2033
- Figure 23: Middle East & Africa Chemical & Biological Indicators for Sterilization Revenue Share (%), by Types 2025 & 2033
- Figure 24: Middle East & Africa Chemical & Biological Indicators for Sterilization Revenue (million), by Country 2025 & 2033
- Figure 25: Middle East & Africa Chemical & Biological Indicators for Sterilization Revenue Share (%), by Country 2025 & 2033
- Figure 26: Asia Pacific Chemical & Biological Indicators for Sterilization Revenue (million), by Application 2025 & 2033
- Figure 27: Asia Pacific Chemical & Biological Indicators for Sterilization Revenue Share (%), by Application 2025 & 2033
- Figure 28: Asia Pacific Chemical & Biological Indicators for Sterilization Revenue (million), by Types 2025 & 2033
- Figure 29: Asia Pacific Chemical & Biological Indicators for Sterilization Revenue Share (%), by Types 2025 & 2033
- Figure 30: Asia Pacific Chemical & Biological Indicators for Sterilization Revenue (million), by Country 2025 & 2033
- Figure 31: Asia Pacific Chemical & Biological Indicators for Sterilization Revenue Share (%), by Country 2025 & 2033
List of Tables
- Table 1: Global Chemical & Biological Indicators for Sterilization Revenue million Forecast, by Application 2020 & 2033
- Table 2: Global Chemical & Biological Indicators for Sterilization Revenue million Forecast, by Types 2020 & 2033
- Table 3: Global Chemical & Biological Indicators for Sterilization Revenue million Forecast, by Region 2020 & 2033
- Table 4: Global Chemical & Biological Indicators for Sterilization Revenue million Forecast, by Application 2020 & 2033
- Table 5: Global Chemical & Biological Indicators for Sterilization Revenue million Forecast, by Types 2020 & 2033
- Table 6: Global Chemical & Biological Indicators for Sterilization Revenue million Forecast, by Country 2020 & 2033
- Table 7: United States Chemical & Biological Indicators for Sterilization Revenue (million) Forecast, by Application 2020 & 2033
- Table 8: Canada Chemical & Biological Indicators for Sterilization Revenue (million) Forecast, by Application 2020 & 2033
- Table 9: Mexico Chemical & Biological Indicators for Sterilization Revenue (million) Forecast, by Application 2020 & 2033
- Table 10: Global Chemical & Biological Indicators for Sterilization Revenue million Forecast, by Application 2020 & 2033
- Table 11: Global Chemical & Biological Indicators for Sterilization Revenue million Forecast, by Types 2020 & 2033
- Table 12: Global Chemical & Biological Indicators for Sterilization Revenue million Forecast, by Country 2020 & 2033
- Table 13: Brazil Chemical & Biological Indicators for Sterilization Revenue (million) Forecast, by Application 2020 & 2033
- Table 14: Argentina Chemical & Biological Indicators for Sterilization Revenue (million) Forecast, by Application 2020 & 2033
- Table 15: Rest of South America Chemical & Biological Indicators for Sterilization Revenue (million) Forecast, by Application 2020 & 2033
- Table 16: Global Chemical & Biological Indicators for Sterilization Revenue million Forecast, by Application 2020 & 2033
- Table 17: Global Chemical & Biological Indicators for Sterilization Revenue million Forecast, by Types 2020 & 2033
- Table 18: Global Chemical & Biological Indicators for Sterilization Revenue million Forecast, by Country 2020 & 2033
- Table 19: United Kingdom Chemical & Biological Indicators for Sterilization Revenue (million) Forecast, by Application 2020 & 2033
- Table 20: Germany Chemical & Biological Indicators for Sterilization Revenue (million) Forecast, by Application 2020 & 2033
- Table 21: France Chemical & Biological Indicators for Sterilization Revenue (million) Forecast, by Application 2020 & 2033
- Table 22: Italy Chemical & Biological Indicators for Sterilization Revenue (million) Forecast, by Application 2020 & 2033
- Table 23: Spain Chemical & Biological Indicators for Sterilization Revenue (million) Forecast, by Application 2020 & 2033
- Table 24: Russia Chemical & Biological Indicators for Sterilization Revenue (million) Forecast, by Application 2020 & 2033
- Table 25: Benelux Chemical & Biological Indicators for Sterilization Revenue (million) Forecast, by Application 2020 & 2033
- Table 26: Nordics Chemical & Biological Indicators for Sterilization Revenue (million) Forecast, by Application 2020 & 2033
- Table 27: Rest of Europe Chemical & Biological Indicators for Sterilization Revenue (million) Forecast, by Application 2020 & 2033
- Table 28: Global Chemical & Biological Indicators for Sterilization Revenue million Forecast, by Application 2020 & 2033
- Table 29: Global Chemical & Biological Indicators for Sterilization Revenue million Forecast, by Types 2020 & 2033
- Table 30: Global Chemical & Biological Indicators for Sterilization Revenue million Forecast, by Country 2020 & 2033
- Table 31: Turkey Chemical & Biological Indicators for Sterilization Revenue (million) Forecast, by Application 2020 & 2033
- Table 32: Israel Chemical & Biological Indicators for Sterilization Revenue (million) Forecast, by Application 2020 & 2033
- Table 33: GCC Chemical & Biological Indicators for Sterilization Revenue (million) Forecast, by Application 2020 & 2033
- Table 34: North Africa Chemical & Biological Indicators for Sterilization Revenue (million) Forecast, by Application 2020 & 2033
- Table 35: South Africa Chemical & Biological Indicators for Sterilization Revenue (million) Forecast, by Application 2020 & 2033
- Table 36: Rest of Middle East & Africa Chemical & Biological Indicators for Sterilization Revenue (million) Forecast, by Application 2020 & 2033
- Table 37: Global Chemical & Biological Indicators for Sterilization Revenue million Forecast, by Application 2020 & 2033
- Table 38: Global Chemical & Biological Indicators for Sterilization Revenue million Forecast, by Types 2020 & 2033
- Table 39: Global Chemical & Biological Indicators for Sterilization Revenue million Forecast, by Country 2020 & 2033
- Table 40: China Chemical & Biological Indicators for Sterilization Revenue (million) Forecast, by Application 2020 & 2033
- Table 41: India Chemical & Biological Indicators for Sterilization Revenue (million) Forecast, by Application 2020 & 2033
- Table 42: Japan Chemical & Biological Indicators for Sterilization Revenue (million) Forecast, by Application 2020 & 2033
- Table 43: South Korea Chemical & Biological Indicators for Sterilization Revenue (million) Forecast, by Application 2020 & 2033
- Table 44: ASEAN Chemical & Biological Indicators for Sterilization Revenue (million) Forecast, by Application 2020 & 2033
- Table 45: Oceania Chemical & Biological Indicators for Sterilization Revenue (million) Forecast, by Application 2020 & 2033
- Table 46: Rest of Asia Pacific Chemical & Biological Indicators for Sterilization Revenue (million) Forecast, by Application 2020 & 2033
Frequently Asked Questions
1. What is the projected Compound Annual Growth Rate (CAGR) of the Chemical & Biological Indicators for Sterilization?
The projected CAGR is approximately 4.2%.
2. Which companies are prominent players in the Chemical & Biological Indicators for Sterilization?
Key companies in the market include 3M Company, Andersen Products Inc., Mesa Laboratories Inc., Cantel Medical Corp., Clinichem Oy Ltd., E.C.S. S.R.L., Etigam Bv, Getinge Group, Hu-Friedy Mfg. Co. LLC, Indilab Inc., Matachana Group, STERIS, Nigk Corporation, Parasure Limited, PMS Healthcare Technologies, Propper Manufacturing Co. Inc., Scican Inc., Terragene S.A..
3. What are the main segments of the Chemical & Biological Indicators for Sterilization?
The market segments include Application, Types.
4. Can you provide details about the market size?
The market size is estimated to be USD 435.7 million as of 2022.
5. What are some drivers contributing to market growth?
N/A
6. What are the notable trends driving market growth?
N/A
7. Are there any restraints impacting market growth?
N/A
8. Can you provide examples of recent developments in the market?
N/A
9. What pricing options are available for accessing the report?
Pricing options include single-user, multi-user, and enterprise licenses priced at USD 2900.00, USD 4350.00, and USD 5800.00 respectively.
10. Is the market size provided in terms of value or volume?
The market size is provided in terms of value, measured in million.
11. Are there any specific market keywords associated with the report?
Yes, the market keyword associated with the report is "Chemical & Biological Indicators for Sterilization," which aids in identifying and referencing the specific market segment covered.
12. How do I determine which pricing option suits my needs best?
The pricing options vary based on user requirements and access needs. Individual users may opt for single-user licenses, while businesses requiring broader access may choose multi-user or enterprise licenses for cost-effective access to the report.
13. Are there any additional resources or data provided in the Chemical & Biological Indicators for Sterilization report?
While the report offers comprehensive insights, it's advisable to review the specific contents or supplementary materials provided to ascertain if additional resources or data are available.
14. How can I stay updated on further developments or reports in the Chemical & Biological Indicators for Sterilization?
To stay informed about further developments, trends, and reports in the Chemical & Biological Indicators for Sterilization, consider subscribing to industry newsletters, following relevant companies and organizations, or regularly checking reputable industry news sources and publications.
Methodology
Step 1 - Identification of Relevant Samples Size from Population Database


Step 2 - Approaches for Defining Global Market Size (Value, Volume* & Price*)

Note*: In applicable scenarios
Step 3 - Data Sources
Primary Research
- Web Analytics
- Survey Reports
- Research Institute
- Latest Research Reports
- Opinion Leaders
Secondary Research
- Annual Reports
- White Paper
- Latest Press Release
- Industry Association
- Paid Database
- Investor Presentations

Step 4 - Data Triangulation
Involves using different sources of information in order to increase the validity of a study
These sources are likely to be stakeholders in a program - participants, other researchers, program staff, other community members, and so on.
Then we put all data in single framework & apply various statistical tools to find out the dynamic on the market.
During the analysis stage, feedback from the stakeholder groups would be compared to determine areas of agreement as well as areas of divergence