

Key Insights
The global activated charcoal market, valued at $73.15 million in the base year of 2025, is projected for substantial expansion, forecasting a compound annual growth rate (CAGR) of 4.12% from 2025 to 2033. This growth is propelled by heightened consumer awareness of activated charcoal's health benefits, notably its detoxification and digestive support properties, driving demand for oral supplements like capsules and tablets. The rising adoption of natural and holistic health remedies further bolsters market ascendancy. Accessible through online retail, pharmacies, and supermarkets, the market offers diverse consumer touchpoints. While regulatory standards and potential side effects present challenges, the overall trajectory remains positive. The capsule segment is anticipated to lead, owing to convenience and portability, followed by tablets. North America and Europe currently command significant market share, driven by high disposable incomes and wellness product awareness. However, the Asia-Pacific region is poised for remarkable growth, attributed to escalating health consciousness and increasing purchasing power in developing economies. The competitive landscape features established entities and emerging brands, signifying a dynamic market environment.
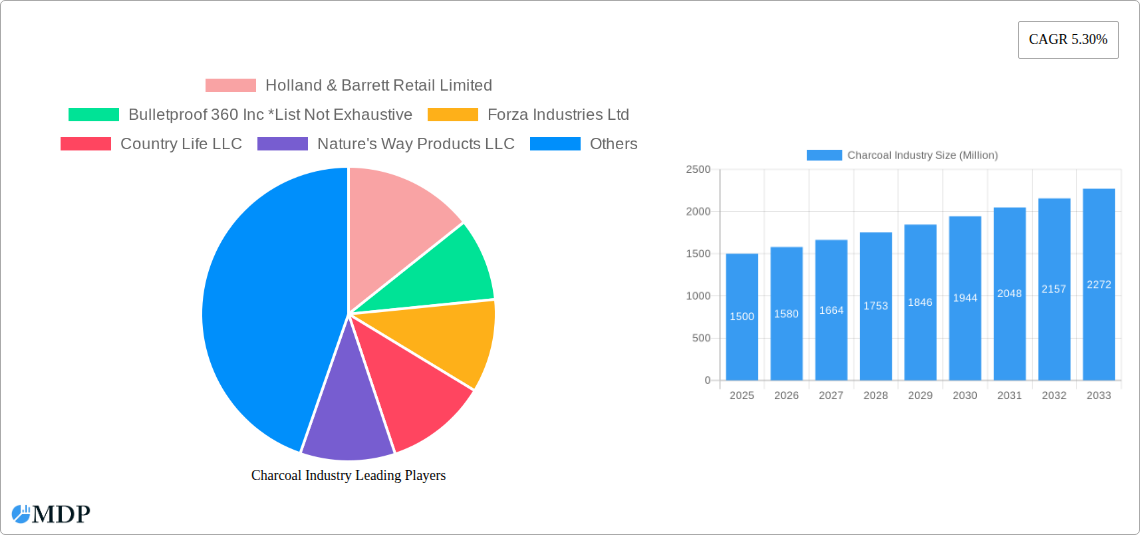
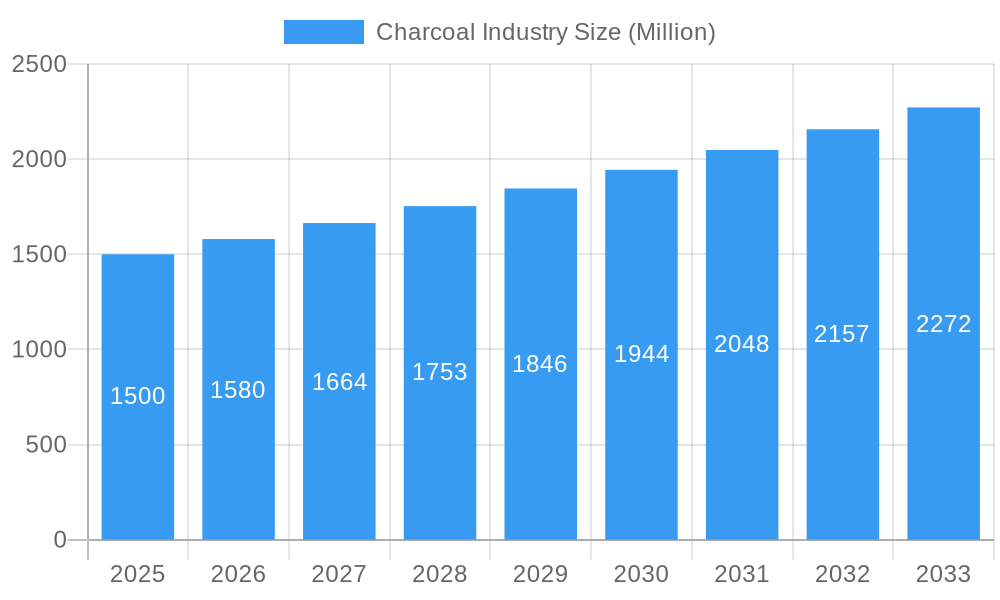
Charcoal Industry Market Size (In Million)
The projected market value for 2033 will reflect the sustained CAGR of 4.12%, indicating significant expansion across all market segments and geographies. Market evolution will be shaped by innovative product development, strategic marketing emphasizing health benefits, and persistent consumer interest in natural health solutions. Success will hinge on navigating regulatory frameworks, ensuring product safety and efficacy, and effectively capturing demand from health-conscious consumers globally. Detailed segmentation by application, such as water filtration and beauty products, will offer deeper market insights.
Charcoal Industry Company Market Share
Unlock the Potential of the Charcoal Industry: A Comprehensive Market Report (2019-2033)
This in-depth report provides a comprehensive analysis of the Charcoal Industry, offering invaluable insights for stakeholders seeking to navigate this dynamic market. With a study period spanning 2019-2033, a base year of 2025, and a forecast period of 2025-2033, this report leverages robust data and expert analysis to deliver actionable intelligence. The market is projected to reach a value of $XX Million by 2033, exhibiting a CAGR of XX% during the forecast period. This report is essential reading for businesses, investors, and researchers seeking to understand the current landscape and future trajectory of the Charcoal Industry.
Charcoal Industry Market Dynamics & Concentration
The global Charcoal Industry, valued at $XX Million in 2024, is characterized by a moderately concentrated market structure. While a few large players dominate specific segments, a significant number of smaller companies compete based on product differentiation, niche markets, and regional presence. Market share analysis reveals that top players account for approximately XX% of the global market, leaving ample space for emerging players.
Key Market Dynamics:
- Innovation Drivers: Ongoing research into new applications for charcoal, particularly in health and wellness, is a key innovation driver. This includes advancements in extraction and processing techniques, leading to improved purity and efficacy.
- Regulatory Frameworks: Government regulations concerning the sourcing and processing of charcoal, particularly related to sustainability and environmental impact, are constantly evolving, shaping industry practices.
- Product Substitutes: Competition arises from alternative products offering similar functionalities, requiring charcoal producers to highlight their unique value proposition, such as sustainability or purity.
- End-User Trends: Increasing health consciousness and consumer interest in natural and organic products drive demand for high-quality charcoal products.
- M&A Activities: The industry has witnessed XX M&A deals in the past five years, indicating consolidation and strategic expansion efforts by key players. These acquisitions focus on enhancing product portfolios and expanding market reach.
Charcoal Industry Industry Trends & Analysis
The Charcoal Industry is experiencing robust growth driven by several converging trends. The increasing awareness of charcoal's diverse applications, coupled with the rising popularity of natural and organic products, fuels market expansion. Technological advancements in processing and purification methods further enhance the quality and efficacy of charcoal, making it more appealing to a wider range of consumers. This coupled with a growing demand for sustainable and ethically sourced products is reshaping the industry landscape. The market is witnessing a substantial shift towards online distribution channels, driven by the convenience and accessibility they offer.
The CAGR for the Charcoal Industry during the historical period (2019-2024) was XX%, and market penetration is estimated to be XX% in 2025, with significant growth projected for the forecast period. Competitive dynamics are marked by both fierce competition among established players and the emergence of innovative startups focused on specialized products and applications.
Leading Markets & Segments in Charcoal Industry
The North American region currently dominates the global Charcoal Industry, accounting for approximately XX% of the total market value. This is driven by high consumer demand for natural health products and the robust presence of established players in the region. Within the industry, the Capsules segment holds the largest market share, followed closely by Tablets. Online retailers and Pharmacies & Drug Stores are the leading distribution channels due to their extensive reach and established customer base.
Key Drivers of Regional and Segment Dominance:
- North America: Strong consumer spending power, high awareness of health benefits associated with charcoal, and a well-established distribution network.
- Capsules Segment: Convenient and easy to consume, preferred dosage form for many consumers.
- Tablets Segment: Cost-effective and widely available, making it a popular choice.
- Pharmacies & Drug Stores: High consumer trust and established presence.
- Online Retailers: Convenience, accessibility, and extensive reach contribute to increasing market share.
Charcoal Industry Product Developments
Recent product innovations include enhanced purification techniques resulting in higher-quality charcoal with fewer impurities. This is complemented by the introduction of specialized charcoal products tailored to specific health and wellness applications, such as detoxifying supplements and skincare products. These developments have expanded the market appeal of charcoal by providing targeted solutions and enhancing consumer trust in the product’s effectiveness. Furthermore, the industry is focusing on sustainable sourcing practices to meet the growing demand for eco-friendly and ethically produced charcoal.
Key Drivers of Charcoal Industry Growth
Several factors contribute to the growth of the Charcoal Industry. Technological advancements enhance production efficiency and product quality. Favorable economic conditions, particularly in developed nations, increase consumer spending on health and wellness products. Furthermore, the increasing regulatory focus on sustainability promotes the adoption of eco-friendly practices, which also enhances consumer confidence. The rising awareness of charcoal's various health benefits and its diverse applications in several industries adds further impetus to market expansion.
Challenges in the Charcoal Industry Market
The Charcoal Industry faces challenges such as fluctuating raw material prices, impacting profitability and production costs. Stringent regulations regarding sourcing and processing can increase compliance costs. Intense competition from alternative products and established players poses a significant hurdle. These challenges necessitate strategic management and innovative solutions to maintain market competitiveness and profitability. The estimated impact of these challenges on the market growth is a reduction of XX% by 2033.
Emerging Opportunities in Charcoal Industry
The Charcoal Industry presents significant opportunities for growth. Technological advancements in nanotechnology offer potential for developing new and improved charcoal-based products. Strategic partnerships between charcoal producers and health and wellness brands can expand market reach and consumer awareness. Moreover, exploring new and emerging markets with increasing consumer interest in natural products offers untapped potential for significant market expansion. These emerging trends could result in a significant boost in market growth of approximately XX% in the coming years.
Leading Players in the Charcoal Industry Sector
- Holland & Barrett Retail Limited
- Bulletproof 360 Inc
- Forza Industries Ltd
- Country Life LLC
- Nature's Way Products LLC
- Swanson
- Schizandu Organics
- Sona
Key Milestones in Charcoal Industry Industry
- 2020: Launch of a new line of sustainably sourced charcoal products by a major industry player.
- 2022: Acquisition of a smaller charcoal producer by a large multinational company to expand market share.
- 2023: Introduction of innovative charcoal-based skincare products receiving positive consumer response.
Strategic Outlook for Charcoal Industry Market
The future of the Charcoal Industry is promising, driven by the sustained demand for natural health products and technological advancements. Strategic opportunities lie in exploring innovative applications for charcoal in diverse sectors, such as food and beverage, and expanding into emerging markets. The focus on sustainability and ethical sourcing will further shape the industry landscape, demanding responsible business practices. This will contribute to a long-term sustainable growth trajectory for the Charcoal Industry.
Charcoal Industry Segmentation
-
1. Form
- 1.1. Capsules
- 1.2. Tablets
-
2. Distribution Channel
- 2.1. Pharmacies & Drug Stores
- 2.2. Supermarket/Hypermarket
- 2.3. Online Retailers
- 2.4. Other Distribution Channels
Charcoal Industry Segmentation By Geography
-
1. North America
- 1.1. United States
- 1.2. Canada
- 1.3. Mexico
- 1.4. Rest of North America
-
2. Europe
- 2.1. Spain
- 2.2. United Kingdom
- 2.3. Germany
- 2.4. France
- 2.5. Italy
- 2.6. Russia
- 2.7. Rest of Europe
-
3. Asia Pacific
- 3.1. China
- 3.2. Japan
- 3.3. India
- 3.4. Australia
- 3.5. Rest of Asia Pacific
-
4. South America
- 4.1. Brazil
- 4.2. Argentina
- 4.3. Rest of South America
-
5. Middle East and Africa
- 5.1. South Africa
- 5.2. Saudi Arabia
- 5.3. Rest of Middle East and Africa
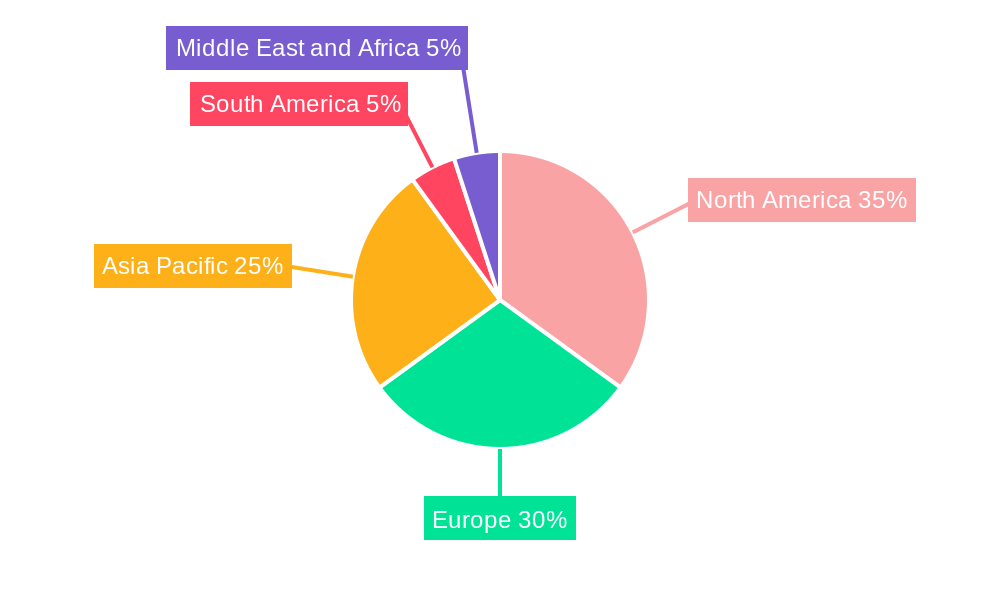
Charcoal Industry Regional Market Share
Geographic Coverage of Charcoal Industry
Charcoal Industry REPORT HIGHLIGHTS
| Aspects | Details |
|---|---|
| Study Period | 2020-2034 |
| Base Year | 2025 |
| Estimated Year | 2026 |
| Forecast Period | 2026-2034 |
| Historical Period | 2020-2025 |
| Growth Rate | CAGR of 4.12% from 2020-2034 |
| Segmentation |
|
Table of Contents
- 1. Introduction
- 1.1. Research Scope
- 1.2. Market Segmentation
- 1.3. Research Objective
- 1.4. Definitions and Assumptions
- 2. Executive Summary
- 2.1. Market Snapshot
- 3. Market Dynamics
- 3.1. Market Drivers
- 3.2. Market Restrains
- 3.3. Market Trends
- 3.4. Market Opportunities
- 4. Market Factor Analysis
- 4.1. Porters Five Forces
- 4.1.1. Bargaining Power of Suppliers
- 4.1.2. Bargaining Power of Buyers
- 4.1.3. Threat of New Entrants
- 4.1.4. Threat of Substitutes
- 4.1.5. Competitive Rivalry
- 4.2. PESTEL analysis
- 4.3. BCG Analysis
- 4.3.1. Stars (High Growth, High Market Share)
- 4.3.2. Cash Cows (Low Growth, High Market Share)
- 4.3.3. Question Mark (High Growth, Low Market Share)
- 4.3.4. Dogs (Low Growth, Low Market Share)
- 4.4. Ansoff Matrix Analysis
- 4.5. Supply Chain Analysis
- 4.6. Regulatory Landscape
- 4.7. Current Market Potential and Opportunity Assessment (TAM–SAM–SOM Framework)
- 4.8. MDP Analyst Note
- 4.1. Porters Five Forces
- 5. Market Analysis, Insights and Forecast 2021-2033
- 5.1. Market Analysis, Insights and Forecast - by Form
- 5.1.1. Capsules
- 5.1.2. Tablets
- 5.2. Market Analysis, Insights and Forecast - by Distribution Channel
- 5.2.1. Pharmacies & Drug Stores
- 5.2.2. Supermarket/Hypermarket
- 5.2.3. Online Retailers
- 5.2.4. Other Distribution Channels
- 5.3. Market Analysis, Insights and Forecast - by Region
- 5.3.1. North America
- 5.3.2. Europe
- 5.3.3. Asia Pacific
- 5.3.4. South America
- 5.3.5. Middle East and Africa
- 5.1. Market Analysis, Insights and Forecast - by Form
- 6. Global Charcoal Industry Analysis, Insights and Forecast, 2021-2033
- 6.1. Market Analysis, Insights and Forecast - by Form
- 6.1.1. Capsules
- 6.1.2. Tablets
- 6.2. Market Analysis, Insights and Forecast - by Distribution Channel
- 6.2.1. Pharmacies & Drug Stores
- 6.2.2. Supermarket/Hypermarket
- 6.2.3. Online Retailers
- 6.2.4. Other Distribution Channels
- 6.1. Market Analysis, Insights and Forecast - by Form
- 7. North America Charcoal Industry Analysis, Insights and Forecast, 2020-2032
- 7.1. Market Analysis, Insights and Forecast - by Form
- 7.1.1. Capsules
- 7.1.2. Tablets
- 7.2. Market Analysis, Insights and Forecast - by Distribution Channel
- 7.2.1. Pharmacies & Drug Stores
- 7.2.2. Supermarket/Hypermarket
- 7.2.3. Online Retailers
- 7.2.4. Other Distribution Channels
- 7.1. Market Analysis, Insights and Forecast - by Form
- 8. Europe Charcoal Industry Analysis, Insights and Forecast, 2020-2032
- 8.1. Market Analysis, Insights and Forecast - by Form
- 8.1.1. Capsules
- 8.1.2. Tablets
- 8.2. Market Analysis, Insights and Forecast - by Distribution Channel
- 8.2.1. Pharmacies & Drug Stores
- 8.2.2. Supermarket/Hypermarket
- 8.2.3. Online Retailers
- 8.2.4. Other Distribution Channels
- 8.1. Market Analysis, Insights and Forecast - by Form
- 9. Asia Pacific Charcoal Industry Analysis, Insights and Forecast, 2020-2032
- 9.1. Market Analysis, Insights and Forecast - by Form
- 9.1.1. Capsules
- 9.1.2. Tablets
- 9.2. Market Analysis, Insights and Forecast - by Distribution Channel
- 9.2.1. Pharmacies & Drug Stores
- 9.2.2. Supermarket/Hypermarket
- 9.2.3. Online Retailers
- 9.2.4. Other Distribution Channels
- 9.1. Market Analysis, Insights and Forecast - by Form
- 10. South America Charcoal Industry Analysis, Insights and Forecast, 2020-2032
- 10.1. Market Analysis, Insights and Forecast - by Form
- 10.1.1. Capsules
- 10.1.2. Tablets
- 10.2. Market Analysis, Insights and Forecast - by Distribution Channel
- 10.2.1. Pharmacies & Drug Stores
- 10.2.2. Supermarket/Hypermarket
- 10.2.3. Online Retailers
- 10.2.4. Other Distribution Channels
- 10.1. Market Analysis, Insights and Forecast - by Form
- 11. Middle East and Africa Charcoal Industry Analysis, Insights and Forecast, 2020-2032
- 11.1. Market Analysis, Insights and Forecast - by Form
- 11.1.1. Capsules
- 11.1.2. Tablets
- 11.2. Market Analysis, Insights and Forecast - by Distribution Channel
- 11.2.1. Pharmacies & Drug Stores
- 11.2.2. Supermarket/Hypermarket
- 11.2.3. Online Retailers
- 11.2.4. Other Distribution Channels
- 11.1. Market Analysis, Insights and Forecast - by Form
- 12. Competitive Analysis
- 12.1. Company Profiles
- 12.1.1 Holland & Barrett Retail Limited
- 12.1.1.1. Company Overview
- 12.1.1.2. Products
- 12.1.1.3. Company Financials
- 12.1.1.4. SWOT Analysis
- 12.1.2 Bulletproof 360 Inc *List Not Exhaustive
- 12.1.2.1. Company Overview
- 12.1.2.2. Products
- 12.1.2.3. Company Financials
- 12.1.2.4. SWOT Analysis
- 12.1.3 Forza Industries Ltd
- 12.1.3.1. Company Overview
- 12.1.3.2. Products
- 12.1.3.3. Company Financials
- 12.1.3.4. SWOT Analysis
- 12.1.4 Country Life LLC
- 12.1.4.1. Company Overview
- 12.1.4.2. Products
- 12.1.4.3. Company Financials
- 12.1.4.4. SWOT Analysis
- 12.1.5 Nature's Way Products LLC
- 12.1.5.1. Company Overview
- 12.1.5.2. Products
- 12.1.5.3. Company Financials
- 12.1.5.4. SWOT Analysis
- 12.1.6 Swanson
- 12.1.6.1. Company Overview
- 12.1.6.2. Products
- 12.1.6.3. Company Financials
- 12.1.6.4. SWOT Analysis
- 12.1.7 Schizandu Organics
- 12.1.7.1. Company Overview
- 12.1.7.2. Products
- 12.1.7.3. Company Financials
- 12.1.7.4. SWOT Analysis
- 12.1.8 Sona
- 12.1.8.1. Company Overview
- 12.1.8.2. Products
- 12.1.8.3. Company Financials
- 12.1.8.4. SWOT Analysis
- 12.1.1 Holland & Barrett Retail Limited
- 12.2. Market Entropy
- 12.2.1 Company's Key Areas Served
- 12.2.2 Recent Developments
- 12.3. Company Market Share Analysis 2025
- 12.3.1 Top 5 Companies Market Share Analysis
- 12.3.2 Top 3 Companies Market Share Analysis
- 12.4. List of Potential Customers
- 13. Research Methodology
List of Figures
- Figure 1: Global Charcoal Industry Revenue Breakdown (million, %) by Region 2025 & 2033
- Figure 2: North America Charcoal Industry Revenue (million), by Form 2025 & 2033
- Figure 3: North America Charcoal Industry Revenue Share (%), by Form 2025 & 2033
- Figure 4: North America Charcoal Industry Revenue (million), by Distribution Channel 2025 & 2033
- Figure 5: North America Charcoal Industry Revenue Share (%), by Distribution Channel 2025 & 2033
- Figure 6: North America Charcoal Industry Revenue (million), by Country 2025 & 2033
- Figure 7: North America Charcoal Industry Revenue Share (%), by Country 2025 & 2033
- Figure 8: Europe Charcoal Industry Revenue (million), by Form 2025 & 2033
- Figure 9: Europe Charcoal Industry Revenue Share (%), by Form 2025 & 2033
- Figure 10: Europe Charcoal Industry Revenue (million), by Distribution Channel 2025 & 2033
- Figure 11: Europe Charcoal Industry Revenue Share (%), by Distribution Channel 2025 & 2033
- Figure 12: Europe Charcoal Industry Revenue (million), by Country 2025 & 2033
- Figure 13: Europe Charcoal Industry Revenue Share (%), by Country 2025 & 2033
- Figure 14: Asia Pacific Charcoal Industry Revenue (million), by Form 2025 & 2033
- Figure 15: Asia Pacific Charcoal Industry Revenue Share (%), by Form 2025 & 2033
- Figure 16: Asia Pacific Charcoal Industry Revenue (million), by Distribution Channel 2025 & 2033
- Figure 17: Asia Pacific Charcoal Industry Revenue Share (%), by Distribution Channel 2025 & 2033
- Figure 18: Asia Pacific Charcoal Industry Revenue (million), by Country 2025 & 2033
- Figure 19: Asia Pacific Charcoal Industry Revenue Share (%), by Country 2025 & 2033
- Figure 20: South America Charcoal Industry Revenue (million), by Form 2025 & 2033
- Figure 21: South America Charcoal Industry Revenue Share (%), by Form 2025 & 2033
- Figure 22: South America Charcoal Industry Revenue (million), by Distribution Channel 2025 & 2033
- Figure 23: South America Charcoal Industry Revenue Share (%), by Distribution Channel 2025 & 2033
- Figure 24: South America Charcoal Industry Revenue (million), by Country 2025 & 2033
- Figure 25: South America Charcoal Industry Revenue Share (%), by Country 2025 & 2033
- Figure 26: Middle East and Africa Charcoal Industry Revenue (million), by Form 2025 & 2033
- Figure 27: Middle East and Africa Charcoal Industry Revenue Share (%), by Form 2025 & 2033
- Figure 28: Middle East and Africa Charcoal Industry Revenue (million), by Distribution Channel 2025 & 2033
- Figure 29: Middle East and Africa Charcoal Industry Revenue Share (%), by Distribution Channel 2025 & 2033
- Figure 30: Middle East and Africa Charcoal Industry Revenue (million), by Country 2025 & 2033
- Figure 31: Middle East and Africa Charcoal Industry Revenue Share (%), by Country 2025 & 2033
List of Tables
- Table 1: Global Charcoal Industry Revenue million Forecast, by Form 2020 & 2033
- Table 2: Global Charcoal Industry Revenue million Forecast, by Distribution Channel 2020 & 2033
- Table 3: Global Charcoal Industry Revenue million Forecast, by Region 2020 & 2033
- Table 4: Global Charcoal Industry Revenue million Forecast, by Form 2020 & 2033
- Table 5: Global Charcoal Industry Revenue million Forecast, by Distribution Channel 2020 & 2033
- Table 6: Global Charcoal Industry Revenue million Forecast, by Country 2020 & 2033
- Table 7: United States Charcoal Industry Revenue (million) Forecast, by Application 2020 & 2033
- Table 8: Canada Charcoal Industry Revenue (million) Forecast, by Application 2020 & 2033
- Table 9: Mexico Charcoal Industry Revenue (million) Forecast, by Application 2020 & 2033
- Table 10: Rest of North America Charcoal Industry Revenue (million) Forecast, by Application 2020 & 2033
- Table 11: Global Charcoal Industry Revenue million Forecast, by Form 2020 & 2033
- Table 12: Global Charcoal Industry Revenue million Forecast, by Distribution Channel 2020 & 2033
- Table 13: Global Charcoal Industry Revenue million Forecast, by Country 2020 & 2033
- Table 14: Spain Charcoal Industry Revenue (million) Forecast, by Application 2020 & 2033
- Table 15: United Kingdom Charcoal Industry Revenue (million) Forecast, by Application 2020 & 2033
- Table 16: Germany Charcoal Industry Revenue (million) Forecast, by Application 2020 & 2033
- Table 17: France Charcoal Industry Revenue (million) Forecast, by Application 2020 & 2033
- Table 18: Italy Charcoal Industry Revenue (million) Forecast, by Application 2020 & 2033
- Table 19: Russia Charcoal Industry Revenue (million) Forecast, by Application 2020 & 2033
- Table 20: Rest of Europe Charcoal Industry Revenue (million) Forecast, by Application 2020 & 2033
- Table 21: Global Charcoal Industry Revenue million Forecast, by Form 2020 & 2033
- Table 22: Global Charcoal Industry Revenue million Forecast, by Distribution Channel 2020 & 2033
- Table 23: Global Charcoal Industry Revenue million Forecast, by Country 2020 & 2033
- Table 24: China Charcoal Industry Revenue (million) Forecast, by Application 2020 & 2033
- Table 25: Japan Charcoal Industry Revenue (million) Forecast, by Application 2020 & 2033
- Table 26: India Charcoal Industry Revenue (million) Forecast, by Application 2020 & 2033
- Table 27: Australia Charcoal Industry Revenue (million) Forecast, by Application 2020 & 2033
- Table 28: Rest of Asia Pacific Charcoal Industry Revenue (million) Forecast, by Application 2020 & 2033
- Table 29: Global Charcoal Industry Revenue million Forecast, by Form 2020 & 2033
- Table 30: Global Charcoal Industry Revenue million Forecast, by Distribution Channel 2020 & 2033
- Table 31: Global Charcoal Industry Revenue million Forecast, by Country 2020 & 2033
- Table 32: Brazil Charcoal Industry Revenue (million) Forecast, by Application 2020 & 2033
- Table 33: Argentina Charcoal Industry Revenue (million) Forecast, by Application 2020 & 2033
- Table 34: Rest of South America Charcoal Industry Revenue (million) Forecast, by Application 2020 & 2033
- Table 35: Global Charcoal Industry Revenue million Forecast, by Form 2020 & 2033
- Table 36: Global Charcoal Industry Revenue million Forecast, by Distribution Channel 2020 & 2033
- Table 37: Global Charcoal Industry Revenue million Forecast, by Country 2020 & 2033
- Table 38: South Africa Charcoal Industry Revenue (million) Forecast, by Application 2020 & 2033
- Table 39: Saudi Arabia Charcoal Industry Revenue (million) Forecast, by Application 2020 & 2033
- Table 40: Rest of Middle East and Africa Charcoal Industry Revenue (million) Forecast, by Application 2020 & 2033
Frequently Asked Questions
1. What is the projected Compound Annual Growth Rate (CAGR) of the Charcoal Industry?
The projected CAGR is approximately 4.12%.
2. Which companies are prominent players in the Charcoal Industry?
Key companies in the market include Holland & Barrett Retail Limited, Bulletproof 360 Inc *List Not Exhaustive, Forza Industries Ltd, Country Life LLC, Nature's Way Products LLC, Swanson, Schizandu Organics, Sona.
3. What are the main segments of the Charcoal Industry?
The market segments include Form, Distribution Channel.
4. Can you provide details about the market size?
The market size is estimated to be USD 73.15 million as of 2022.
5. What are some drivers contributing to market growth?
Health Benefits Promoting Apple Cider Vinegar Demand; Unfiltered Apple Cider Vinegar Being Popular.
6. What are the notable trends driving market growth?
Rising Demand For Detoxifying Substances.
7. Are there any restraints impacting market growth?
Rising Demand for Other Vinegar Types.
8. Can you provide examples of recent developments in the market?
N/A
9. What pricing options are available for accessing the report?
Pricing options include single-user, multi-user, and enterprise licenses priced at USD 4750, USD 5250, and USD 8750 respectively.
10. Is the market size provided in terms of value or volume?
The market size is provided in terms of value, measured in million.
11. Are there any specific market keywords associated with the report?
Yes, the market keyword associated with the report is "Charcoal Industry," which aids in identifying and referencing the specific market segment covered.
12. How do I determine which pricing option suits my needs best?
The pricing options vary based on user requirements and access needs. Individual users may opt for single-user licenses, while businesses requiring broader access may choose multi-user or enterprise licenses for cost-effective access to the report.
13. Are there any additional resources or data provided in the Charcoal Industry report?
While the report offers comprehensive insights, it's advisable to review the specific contents or supplementary materials provided to ascertain if additional resources or data are available.
14. How can I stay updated on further developments or reports in the Charcoal Industry?
To stay informed about further developments, trends, and reports in the Charcoal Industry, consider subscribing to industry newsletters, following relevant companies and organizations, or regularly checking reputable industry news sources and publications.
Methodology
Step 1 - Identification of Relevant Samples Size from Population Database


Step 2 - Approaches for Defining Global Market Size (Value, Volume* & Price*)

Note*: In applicable scenarios
Step 3 - Data Sources
Primary Research
- Web Analytics
- Survey Reports
- Research Institute
- Latest Research Reports
- Opinion Leaders
Secondary Research
- Annual Reports
- White Paper
- Latest Press Release
- Industry Association
- Paid Database
- Investor Presentations

Step 4 - Data Triangulation
Involves using different sources of information in order to increase the validity of a study
These sources are likely to be stakeholders in a program - participants, other researchers, program staff, other community members, and so on.
Then we put all data in single framework & apply various statistical tools to find out the dynamic on the market.
During the analysis stage, feedback from the stakeholder groups would be compared to determine areas of agreement as well as areas of divergence