

Key Insights
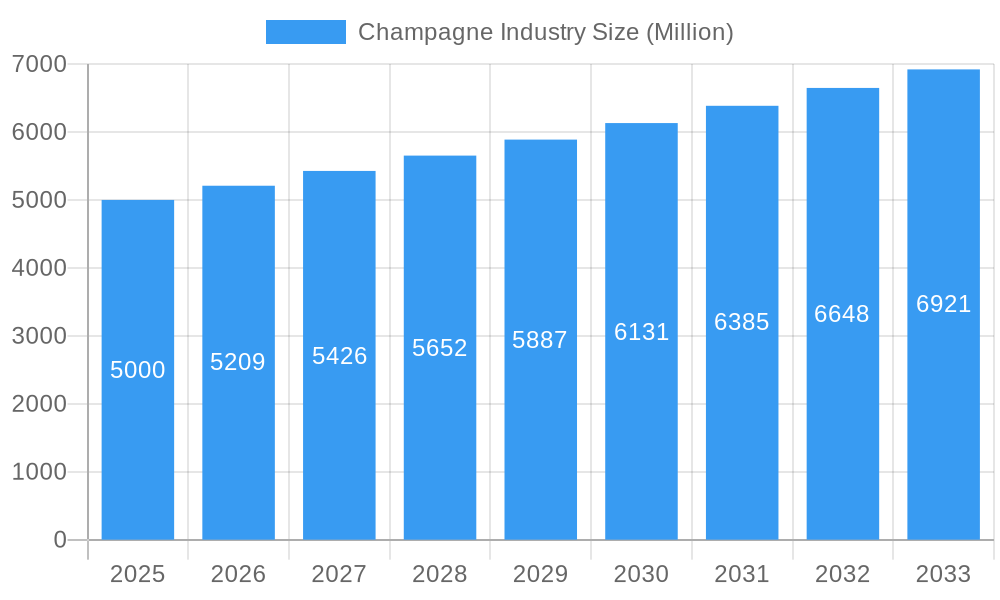
The global Champagne market, valued at approximately $6.43 billion in 2025, is projected for substantial expansion, forecasting a Compound Annual Growth Rate (CAGR) of 2.3% from 2025 to 2033. This growth is propelled by several key factors. Rising disposable incomes in emerging economies, particularly in Asia-Pacific, are increasing demand for luxury goods such as Champagne. The growing association of Champagne with celebrations and special occasions, amplified by effective marketing and branding by leading producers, enhances its market appeal. A trend towards premiumization, with consumers increasingly opting for high-value Prestige Cuvées, is also contributing to upward market valuation. The availability of diverse Champagne varieties, including Brut, Rosé, Blanc de Blancs, and Blanc de Noirs, caters to evolving consumer preferences, broadening the market's reach and driving segment-specific expansion. However, the market faces challenges such as variable grape yields influenced by climate change and potential economic downturns impacting luxury beverage spending. Distribution channels, encompassing both on-trade (hospitality venues) and off-trade (retail), are crucial for market growth, though the on-trade sector may be more sensitive to economic shifts.
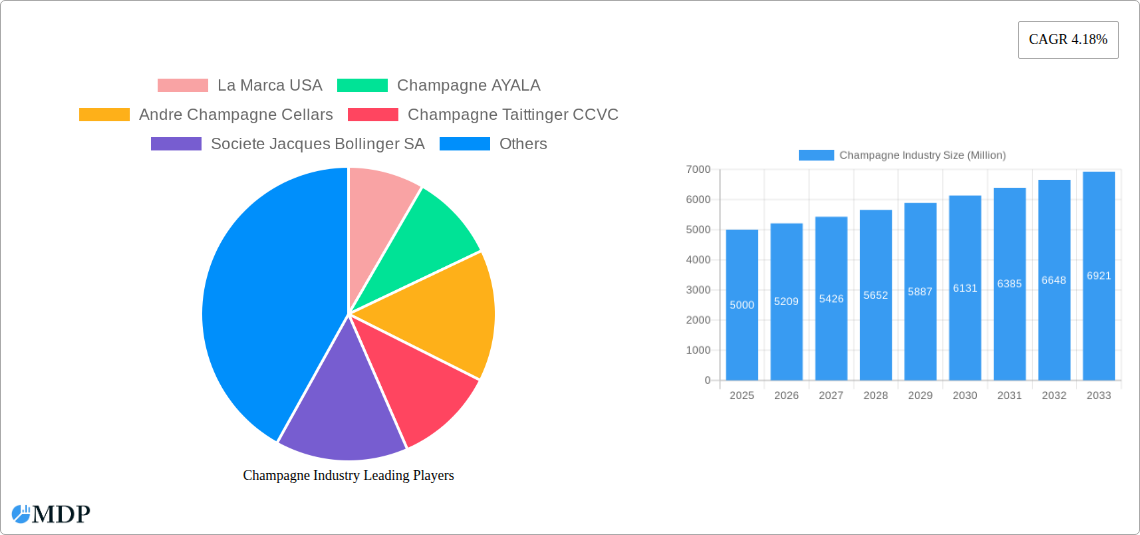
Champagne Industry Market Size (In Billion)
Competition in the Champagne market is fierce, with major players such as LVMH Moët Hennessy, Laurent-Perrier Group, and Bollinger contending with smaller, specialized producers. Geographically, Europe, led by France, remains the dominant region. Nevertheless, North America and Asia-Pacific offer significant growth prospects, driven by increasing consumption and product awareness. Market leaders are investing in product innovation and diversified distribution to leverage these opportunities. Strategic alliances, acquisitions, and branding initiatives are also reshaping the competitive landscape as companies aim to secure market share and attract new customers. Furthermore, a growing consumer focus on sustainable and ethical sourcing is becoming a critical differentiator. Consequently, businesses effectively integrating luxury appeal with sustainable practices are poised for long-term competitive advantage.
Champagne Industry Company Market Share
Champagne Industry Market Report: 2019-2033
Unlocking the Fizz: A Comprehensive Analysis of the Global Champagne Market
This comprehensive report provides an in-depth analysis of the global champagne industry, projecting market dynamics from 2019 to 2033. Valued at xx Million in 2025 (estimated), the market is poised for significant growth, driven by evolving consumer preferences and innovative product development. This report is an essential resource for industry stakeholders, including producers, distributors, investors, and market analysts seeking to navigate the complexities and capitalize on the opportunities within this prestigious sector. The report covers key market segments (Brut, Rosé, Blanc de Blancs, Blanc de Noirs, Demi-Sec, Prestige Cuvée), distribution channels (on-trade, off-trade), and leading players like LVMH Moët Hennessy, Laurent-Perrier Group, and more. Benefit from detailed market sizing, growth forecasts (CAGR), and actionable insights to inform strategic decision-making. Download now to gain a competitive edge!
Champagne Industry Market Dynamics & Concentration
The global champagne market, estimated at xx Million in 2025, exhibits a moderately concentrated structure, with a handful of major players holding significant market share. Market concentration is influenced by factors such as brand recognition, established distribution networks, and control over key vineyard resources. Innovation, particularly in packaging and flavor profiles, remains a key driver, pushing the boundaries of traditional champagne production. Stringent regulatory frameworks, including appellation d'origine contrôlée (AOC) regulations, impact market entry and production practices. Product substitutes, such as sparkling wines from other regions, pose a competitive threat, particularly in price-sensitive segments. End-user trends, such as increasing demand for organic and sustainable champagnes, are shaping the market landscape. Mergers and acquisitions (M&A) activity, while not consistently high, can significantly alter market share dynamics.
- Market Share (2025 Est.): LVMH Moët Hennessy (xx%), Laurent-Perrier Group (xx%), other players (xx%).
- M&A Deal Count (2019-2024): xx deals.
Champagne Industry Industry Trends & Analysis
The champagne industry is experiencing robust growth, projected at a CAGR of xx% from 2025 to 2033, fueled by several key factors. Rising disposable incomes in key markets, coupled with increasing consumer preference for premium alcoholic beverages, are driving demand. Technological advancements in viticulture and winemaking are improving efficiency and product quality. Consumer preferences are shifting towards more diverse champagne styles beyond traditional Brut, with Rosé and Blanc de Blancs gaining popularity. The competitive landscape remains intense, with established players investing heavily in brand building and product innovation to maintain market share. Market penetration within emerging markets remains a significant growth opportunity.
Leading Markets & Segments in Champagne Industry
The leading market for champagne remains France, driven by strong domestic demand and its historical association with the region. However, key export markets, including the US, UK, and Asia, contribute significantly to overall consumption. The Brut Champagne segment dominates market share due to its broad appeal and versatility.
- Key Drivers for France: Strong domestic consumption, established vineyards, well-developed infrastructure, favorable government policies.
- Key Drivers for Export Markets (US, UK, Asia): Growing affluence, rising demand for luxury goods, increasing awareness of champagne brands.
Within champagne types, Brut retains the largest market share, followed by Rosé and Prestige Cuvée. The On-Trade channel (restaurants, bars, hotels) continues to hold a significant share, although the Off-Trade channel (retail stores, supermarkets) is witnessing robust growth due to the increasing convenience of online shopping.
Champagne Industry Product Developments
Recent years have witnessed significant innovation in champagne production, focusing on sustainability, organic practices, and unique flavor profiles. This includes the introduction of limited-edition champagnes, new vintages, and experiments with non-traditional grape varieties or aging techniques. Technological advances, such as precision viticulture and improved fermentation processes, play a key role in maintaining product consistency and improving yield. This focus on niche offerings and enhanced experiences caters to the evolving preferences of discerning consumers.
Key Drivers of Champagne Industry Growth
The champagne industry's growth trajectory is propelled by several intertwined factors. Technological advancements in vineyard management and winemaking optimize production, leading to higher yields and consistent quality. Economic growth in key export markets boosts consumer spending on premium beverages. Favorable government regulations and trade policies in key markets ease market access. Finally, the enduring allure of champagne as a symbol of luxury and celebration continues to fuel demand.
Challenges in the Champagne Industry Market
The champagne industry faces several challenges that could impede growth. Strict regulations associated with appellation contrôlée can restrict expansion. Supply chain disruptions, including climate change impacts on grape yields, can affect product availability. Intense competition from other premium sparkling wines necessitates continuous innovation and brand differentiation. Furthermore, economic downturns could curb demand for luxury goods, impacting sales volumes.
Emerging Opportunities in Champagne Industry
The champagne industry is poised for sustained growth, driven by several emerging opportunities. Technological advancements are improving efficiency and creating opportunities for eco-friendly production practices. Strategic partnerships with luxury brands and celebrity endorsements are enhancing brand visibility. Expansion into new and emerging markets offers untapped potential for revenue growth.
Leading Players in the Champagne Industry Sector
- La Marca USA
- Champagne AYALA
- Andre Champagne Cellars
- Champagne Taittinger CCVC
- Societe Jacques Bollinger SA
- LVMH Moet Hennessy
- Laurent-Perrier Group
- Diageo plc
- F Korbel & Bros
- Cook's Champagne Cellars
Key Milestones in Champagne Industry Industry
- February 2022: Champagne Louis Roederer launched its 2014 vintage "Cristal" champagne.
- April 2022: Champagne Krug (LVMH) launched two new "Grande Cuvées" editions (white and rosé).
- October 2022: Societe Jacques Bollinger SA released a limited-edition "Special Cuvée, The Bollinger Style" champagne celebrating its partnership with James Bond.
Strategic Outlook for Champagne Industry Market
The champagne industry's future remains bright, promising continued growth driven by innovation, strategic partnerships, and targeted expansion into new markets. A focus on sustainability, premiumization, and personalized consumer experiences will shape its trajectory. The market's potential lies in leveraging technology, strengthening brand identities, and meeting the evolving demands of a discerning global clientele.
Champagne Industry Segmentation
-
1. Type
- 1.1. Brut Champagne
- 1.2. Rose Champagne
- 1.3. Blanc De Blancs
- 1.4. Blanc De Noirs
- 1.5. Demi-Sec
- 1.6. Prestige Cuvee
-
2. Distribution Channel
- 2.1. On-Trade
-
2.2. Off-Trade
- 2.2.1. Online Retail Stores
- 2.2.2. Offline Retail Stores
Champagne Industry Segmentation By Geography
-
1. North America
- 1.1. United States
- 1.2. Canada
- 1.3. Mexico
- 1.4. Rest of North America
-
2. Europe
- 2.1. United Kingdom
- 2.2. Germany
- 2.3. Spain
- 2.4. France
- 2.5. Italy
- 2.6. Russia
- 2.7. Rest of Europe
-
3. Asia Pacific
- 3.1. China
- 3.2. Japan
- 3.3. India
- 3.4. Australia
- 3.5. Rest of Asia Pacific
-
4. South America
- 4.1. Brazil
- 4.2. Argentina
- 4.3. Rest of South America
-
5. Middle East and Africa
- 5.1. South Africa
- 5.2. Saudi Arabia
- 5.3. Rest of Middle East and Africa
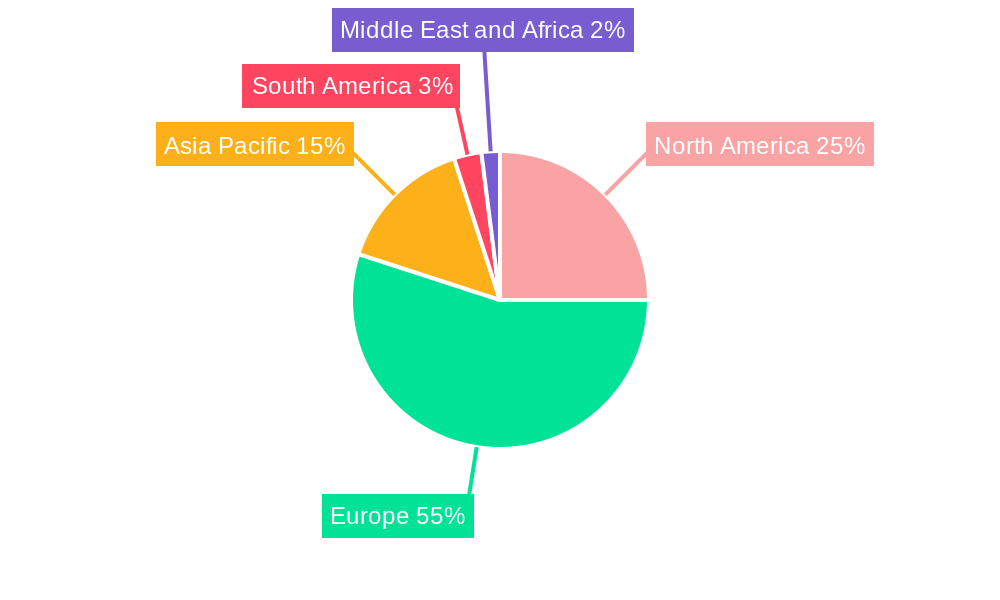
Champagne Industry Regional Market Share
Geographic Coverage of Champagne Industry
Champagne Industry REPORT HIGHLIGHTS
| Aspects | Details |
|---|---|
| Study Period | 2020-2034 |
| Base Year | 2025 |
| Estimated Year | 2026 |
| Forecast Period | 2026-2034 |
| Historical Period | 2020-2025 |
| Growth Rate | CAGR of 2.3% from 2020-2034 |
| Segmentation |
|
Table of Contents
- 1. Introduction
- 1.1. Research Scope
- 1.2. Market Segmentation
- 1.3. Research Objective
- 1.4. Definitions and Assumptions
- 2. Executive Summary
- 2.1. Market Snapshot
- 3. Market Dynamics
- 3.1. Market Drivers
- 3.2. Market Restrains
- 3.3. Market Trends
- 3.4. Market Opportunities
- 4. Market Factor Analysis
- 4.1. Porters Five Forces
- 4.1.1. Bargaining Power of Suppliers
- 4.1.2. Bargaining Power of Buyers
- 4.1.3. Threat of New Entrants
- 4.1.4. Threat of Substitutes
- 4.1.5. Competitive Rivalry
- 4.2. PESTEL analysis
- 4.3. BCG Analysis
- 4.3.1. Stars (High Growth, High Market Share)
- 4.3.2. Cash Cows (Low Growth, High Market Share)
- 4.3.3. Question Mark (High Growth, Low Market Share)
- 4.3.4. Dogs (Low Growth, Low Market Share)
- 4.4. Ansoff Matrix Analysis
- 4.5. Supply Chain Analysis
- 4.6. Regulatory Landscape
- 4.7. Current Market Potential and Opportunity Assessment (TAM–SAM–SOM Framework)
- 4.8. MDP Analyst Note
- 4.1. Porters Five Forces
- 5. Market Analysis, Insights and Forecast 2021-2033
- 5.1. Market Analysis, Insights and Forecast - by Type
- 5.1.1. Brut Champagne
- 5.1.2. Rose Champagne
- 5.1.3. Blanc De Blancs
- 5.1.4. Blanc De Noirs
- 5.1.5. Demi-Sec
- 5.1.6. Prestige Cuvee
- 5.2. Market Analysis, Insights and Forecast - by Distribution Channel
- 5.2.1. On-Trade
- 5.2.2. Off-Trade
- 5.2.2.1. Online Retail Stores
- 5.2.2.2. Offline Retail Stores
- 5.3. Market Analysis, Insights and Forecast - by Region
- 5.3.1. North America
- 5.3.2. Europe
- 5.3.3. Asia Pacific
- 5.3.4. South America
- 5.3.5. Middle East and Africa
- 5.1. Market Analysis, Insights and Forecast - by Type
- 6. Global Champagne Industry Analysis, Insights and Forecast, 2021-2033
- 6.1. Market Analysis, Insights and Forecast - by Type
- 6.1.1. Brut Champagne
- 6.1.2. Rose Champagne
- 6.1.3. Blanc De Blancs
- 6.1.4. Blanc De Noirs
- 6.1.5. Demi-Sec
- 6.1.6. Prestige Cuvee
- 6.2. Market Analysis, Insights and Forecast - by Distribution Channel
- 6.2.1. On-Trade
- 6.2.2. Off-Trade
- 6.2.2.1. Online Retail Stores
- 6.2.2.2. Offline Retail Stores
- 6.1. Market Analysis, Insights and Forecast - by Type
- 7. North America Champagne Industry Analysis, Insights and Forecast, 2020-2032
- 7.1. Market Analysis, Insights and Forecast - by Type
- 7.1.1. Brut Champagne
- 7.1.2. Rose Champagne
- 7.1.3. Blanc De Blancs
- 7.1.4. Blanc De Noirs
- 7.1.5. Demi-Sec
- 7.1.6. Prestige Cuvee
- 7.2. Market Analysis, Insights and Forecast - by Distribution Channel
- 7.2.1. On-Trade
- 7.2.2. Off-Trade
- 7.2.2.1. Online Retail Stores
- 7.2.2.2. Offline Retail Stores
- 7.1. Market Analysis, Insights and Forecast - by Type
- 8. Europe Champagne Industry Analysis, Insights and Forecast, 2020-2032
- 8.1. Market Analysis, Insights and Forecast - by Type
- 8.1.1. Brut Champagne
- 8.1.2. Rose Champagne
- 8.1.3. Blanc De Blancs
- 8.1.4. Blanc De Noirs
- 8.1.5. Demi-Sec
- 8.1.6. Prestige Cuvee
- 8.2. Market Analysis, Insights and Forecast - by Distribution Channel
- 8.2.1. On-Trade
- 8.2.2. Off-Trade
- 8.2.2.1. Online Retail Stores
- 8.2.2.2. Offline Retail Stores
- 8.1. Market Analysis, Insights and Forecast - by Type
- 9. Asia Pacific Champagne Industry Analysis, Insights and Forecast, 2020-2032
- 9.1. Market Analysis, Insights and Forecast - by Type
- 9.1.1. Brut Champagne
- 9.1.2. Rose Champagne
- 9.1.3. Blanc De Blancs
- 9.1.4. Blanc De Noirs
- 9.1.5. Demi-Sec
- 9.1.6. Prestige Cuvee
- 9.2. Market Analysis, Insights and Forecast - by Distribution Channel
- 9.2.1. On-Trade
- 9.2.2. Off-Trade
- 9.2.2.1. Online Retail Stores
- 9.2.2.2. Offline Retail Stores
- 9.1. Market Analysis, Insights and Forecast - by Type
- 10. South America Champagne Industry Analysis, Insights and Forecast, 2020-2032
- 10.1. Market Analysis, Insights and Forecast - by Type
- 10.1.1. Brut Champagne
- 10.1.2. Rose Champagne
- 10.1.3. Blanc De Blancs
- 10.1.4. Blanc De Noirs
- 10.1.5. Demi-Sec
- 10.1.6. Prestige Cuvee
- 10.2. Market Analysis, Insights and Forecast - by Distribution Channel
- 10.2.1. On-Trade
- 10.2.2. Off-Trade
- 10.2.2.1. Online Retail Stores
- 10.2.2.2. Offline Retail Stores
- 10.1. Market Analysis, Insights and Forecast - by Type
- 11. Middle East and Africa Champagne Industry Analysis, Insights and Forecast, 2020-2032
- 11.1. Market Analysis, Insights and Forecast - by Type
- 11.1.1. Brut Champagne
- 11.1.2. Rose Champagne
- 11.1.3. Blanc De Blancs
- 11.1.4. Blanc De Noirs
- 11.1.5. Demi-Sec
- 11.1.6. Prestige Cuvee
- 11.2. Market Analysis, Insights and Forecast - by Distribution Channel
- 11.2.1. On-Trade
- 11.2.2. Off-Trade
- 11.2.2.1. Online Retail Stores
- 11.2.2.2. Offline Retail Stores
- 11.1. Market Analysis, Insights and Forecast - by Type
- 12. Competitive Analysis
- 12.1. Company Profiles
- 12.1.1 La Marca USA
- 12.1.1.1. Company Overview
- 12.1.1.2. Products
- 12.1.1.3. Company Financials
- 12.1.1.4. SWOT Analysis
- 12.1.2 Champagne AYALA
- 12.1.2.1. Company Overview
- 12.1.2.2. Products
- 12.1.2.3. Company Financials
- 12.1.2.4. SWOT Analysis
- 12.1.3 Andre Champagne Cellars
- 12.1.3.1. Company Overview
- 12.1.3.2. Products
- 12.1.3.3. Company Financials
- 12.1.3.4. SWOT Analysis
- 12.1.4 Champagne Taittinger CCVC
- 12.1.4.1. Company Overview
- 12.1.4.2. Products
- 12.1.4.3. Company Financials
- 12.1.4.4. SWOT Analysis
- 12.1.5 Societe Jacques Bollinger SA
- 12.1.5.1. Company Overview
- 12.1.5.2. Products
- 12.1.5.3. Company Financials
- 12.1.5.4. SWOT Analysis
- 12.1.6 LVMH Moet Hennessy*List Not Exhaustive
- 12.1.6.1. Company Overview
- 12.1.6.2. Products
- 12.1.6.3. Company Financials
- 12.1.6.4. SWOT Analysis
- 12.1.7 Laurent-Perrier Group
- 12.1.7.1. Company Overview
- 12.1.7.2. Products
- 12.1.7.3. Company Financials
- 12.1.7.4. SWOT Analysis
- 12.1.8 Diageo plc
- 12.1.8.1. Company Overview
- 12.1.8.2. Products
- 12.1.8.3. Company Financials
- 12.1.8.4. SWOT Analysis
- 12.1.9 F Korbel & Bros
- 12.1.9.1. Company Overview
- 12.1.9.2. Products
- 12.1.9.3. Company Financials
- 12.1.9.4. SWOT Analysis
- 12.1.10 Cook's Champagne Cellars
- 12.1.10.1. Company Overview
- 12.1.10.2. Products
- 12.1.10.3. Company Financials
- 12.1.10.4. SWOT Analysis
- 12.1.1 La Marca USA
- 12.2. Market Entropy
- 12.2.1 Company's Key Areas Served
- 12.2.2 Recent Developments
- 12.3. Company Market Share Analysis 2025
- 12.3.1 Top 5 Companies Market Share Analysis
- 12.3.2 Top 3 Companies Market Share Analysis
- 12.4. List of Potential Customers
- 13. Research Methodology
List of Figures
- Figure 1: Global Champagne Industry Revenue Breakdown (billion, %) by Region 2025 & 2033
- Figure 2: Global Champagne Industry Volume Breakdown (Million, %) by Region 2025 & 2033
- Figure 3: North America Champagne Industry Revenue (billion), by Type 2025 & 2033
- Figure 4: North America Champagne Industry Volume (Million), by Type 2025 & 2033
- Figure 5: North America Champagne Industry Revenue Share (%), by Type 2025 & 2033
- Figure 6: North America Champagne Industry Volume Share (%), by Type 2025 & 2033
- Figure 7: North America Champagne Industry Revenue (billion), by Distribution Channel 2025 & 2033
- Figure 8: North America Champagne Industry Volume (Million), by Distribution Channel 2025 & 2033
- Figure 9: North America Champagne Industry Revenue Share (%), by Distribution Channel 2025 & 2033
- Figure 10: North America Champagne Industry Volume Share (%), by Distribution Channel 2025 & 2033
- Figure 11: North America Champagne Industry Revenue (billion), by Country 2025 & 2033
- Figure 12: North America Champagne Industry Volume (Million), by Country 2025 & 2033
- Figure 13: North America Champagne Industry Revenue Share (%), by Country 2025 & 2033
- Figure 14: North America Champagne Industry Volume Share (%), by Country 2025 & 2033
- Figure 15: Europe Champagne Industry Revenue (billion), by Type 2025 & 2033
- Figure 16: Europe Champagne Industry Volume (Million), by Type 2025 & 2033
- Figure 17: Europe Champagne Industry Revenue Share (%), by Type 2025 & 2033
- Figure 18: Europe Champagne Industry Volume Share (%), by Type 2025 & 2033
- Figure 19: Europe Champagne Industry Revenue (billion), by Distribution Channel 2025 & 2033
- Figure 20: Europe Champagne Industry Volume (Million), by Distribution Channel 2025 & 2033
- Figure 21: Europe Champagne Industry Revenue Share (%), by Distribution Channel 2025 & 2033
- Figure 22: Europe Champagne Industry Volume Share (%), by Distribution Channel 2025 & 2033
- Figure 23: Europe Champagne Industry Revenue (billion), by Country 2025 & 2033
- Figure 24: Europe Champagne Industry Volume (Million), by Country 2025 & 2033
- Figure 25: Europe Champagne Industry Revenue Share (%), by Country 2025 & 2033
- Figure 26: Europe Champagne Industry Volume Share (%), by Country 2025 & 2033
- Figure 27: Asia Pacific Champagne Industry Revenue (billion), by Type 2025 & 2033
- Figure 28: Asia Pacific Champagne Industry Volume (Million), by Type 2025 & 2033
- Figure 29: Asia Pacific Champagne Industry Revenue Share (%), by Type 2025 & 2033
- Figure 30: Asia Pacific Champagne Industry Volume Share (%), by Type 2025 & 2033
- Figure 31: Asia Pacific Champagne Industry Revenue (billion), by Distribution Channel 2025 & 2033
- Figure 32: Asia Pacific Champagne Industry Volume (Million), by Distribution Channel 2025 & 2033
- Figure 33: Asia Pacific Champagne Industry Revenue Share (%), by Distribution Channel 2025 & 2033
- Figure 34: Asia Pacific Champagne Industry Volume Share (%), by Distribution Channel 2025 & 2033
- Figure 35: Asia Pacific Champagne Industry Revenue (billion), by Country 2025 & 2033
- Figure 36: Asia Pacific Champagne Industry Volume (Million), by Country 2025 & 2033
- Figure 37: Asia Pacific Champagne Industry Revenue Share (%), by Country 2025 & 2033
- Figure 38: Asia Pacific Champagne Industry Volume Share (%), by Country 2025 & 2033
- Figure 39: South America Champagne Industry Revenue (billion), by Type 2025 & 2033
- Figure 40: South America Champagne Industry Volume (Million), by Type 2025 & 2033
- Figure 41: South America Champagne Industry Revenue Share (%), by Type 2025 & 2033
- Figure 42: South America Champagne Industry Volume Share (%), by Type 2025 & 2033
- Figure 43: South America Champagne Industry Revenue (billion), by Distribution Channel 2025 & 2033
- Figure 44: South America Champagne Industry Volume (Million), by Distribution Channel 2025 & 2033
- Figure 45: South America Champagne Industry Revenue Share (%), by Distribution Channel 2025 & 2033
- Figure 46: South America Champagne Industry Volume Share (%), by Distribution Channel 2025 & 2033
- Figure 47: South America Champagne Industry Revenue (billion), by Country 2025 & 2033
- Figure 48: South America Champagne Industry Volume (Million), by Country 2025 & 2033
- Figure 49: South America Champagne Industry Revenue Share (%), by Country 2025 & 2033
- Figure 50: South America Champagne Industry Volume Share (%), by Country 2025 & 2033
- Figure 51: Middle East and Africa Champagne Industry Revenue (billion), by Type 2025 & 2033
- Figure 52: Middle East and Africa Champagne Industry Volume (Million), by Type 2025 & 2033
- Figure 53: Middle East and Africa Champagne Industry Revenue Share (%), by Type 2025 & 2033
- Figure 54: Middle East and Africa Champagne Industry Volume Share (%), by Type 2025 & 2033
- Figure 55: Middle East and Africa Champagne Industry Revenue (billion), by Distribution Channel 2025 & 2033
- Figure 56: Middle East and Africa Champagne Industry Volume (Million), by Distribution Channel 2025 & 2033
- Figure 57: Middle East and Africa Champagne Industry Revenue Share (%), by Distribution Channel 2025 & 2033
- Figure 58: Middle East and Africa Champagne Industry Volume Share (%), by Distribution Channel 2025 & 2033
- Figure 59: Middle East and Africa Champagne Industry Revenue (billion), by Country 2025 & 2033
- Figure 60: Middle East and Africa Champagne Industry Volume (Million), by Country 2025 & 2033
- Figure 61: Middle East and Africa Champagne Industry Revenue Share (%), by Country 2025 & 2033
- Figure 62: Middle East and Africa Champagne Industry Volume Share (%), by Country 2025 & 2033
List of Tables
- Table 1: Global Champagne Industry Revenue billion Forecast, by Type 2020 & 2033
- Table 2: Global Champagne Industry Volume Million Forecast, by Type 2020 & 2033
- Table 3: Global Champagne Industry Revenue billion Forecast, by Distribution Channel 2020 & 2033
- Table 4: Global Champagne Industry Volume Million Forecast, by Distribution Channel 2020 & 2033
- Table 5: Global Champagne Industry Revenue billion Forecast, by Region 2020 & 2033
- Table 6: Global Champagne Industry Volume Million Forecast, by Region 2020 & 2033
- Table 7: Global Champagne Industry Revenue billion Forecast, by Type 2020 & 2033
- Table 8: Global Champagne Industry Volume Million Forecast, by Type 2020 & 2033
- Table 9: Global Champagne Industry Revenue billion Forecast, by Distribution Channel 2020 & 2033
- Table 10: Global Champagne Industry Volume Million Forecast, by Distribution Channel 2020 & 2033
- Table 11: Global Champagne Industry Revenue billion Forecast, by Country 2020 & 2033
- Table 12: Global Champagne Industry Volume Million Forecast, by Country 2020 & 2033
- Table 13: United States Champagne Industry Revenue (billion) Forecast, by Application 2020 & 2033
- Table 14: United States Champagne Industry Volume (Million) Forecast, by Application 2020 & 2033
- Table 15: Canada Champagne Industry Revenue (billion) Forecast, by Application 2020 & 2033
- Table 16: Canada Champagne Industry Volume (Million) Forecast, by Application 2020 & 2033
- Table 17: Mexico Champagne Industry Revenue (billion) Forecast, by Application 2020 & 2033
- Table 18: Mexico Champagne Industry Volume (Million) Forecast, by Application 2020 & 2033
- Table 19: Rest of North America Champagne Industry Revenue (billion) Forecast, by Application 2020 & 2033
- Table 20: Rest of North America Champagne Industry Volume (Million) Forecast, by Application 2020 & 2033
- Table 21: Global Champagne Industry Revenue billion Forecast, by Type 2020 & 2033
- Table 22: Global Champagne Industry Volume Million Forecast, by Type 2020 & 2033
- Table 23: Global Champagne Industry Revenue billion Forecast, by Distribution Channel 2020 & 2033
- Table 24: Global Champagne Industry Volume Million Forecast, by Distribution Channel 2020 & 2033
- Table 25: Global Champagne Industry Revenue billion Forecast, by Country 2020 & 2033
- Table 26: Global Champagne Industry Volume Million Forecast, by Country 2020 & 2033
- Table 27: United Kingdom Champagne Industry Revenue (billion) Forecast, by Application 2020 & 2033
- Table 28: United Kingdom Champagne Industry Volume (Million) Forecast, by Application 2020 & 2033
- Table 29: Germany Champagne Industry Revenue (billion) Forecast, by Application 2020 & 2033
- Table 30: Germany Champagne Industry Volume (Million) Forecast, by Application 2020 & 2033
- Table 31: Spain Champagne Industry Revenue (billion) Forecast, by Application 2020 & 2033
- Table 32: Spain Champagne Industry Volume (Million) Forecast, by Application 2020 & 2033
- Table 33: France Champagne Industry Revenue (billion) Forecast, by Application 2020 & 2033
- Table 34: France Champagne Industry Volume (Million) Forecast, by Application 2020 & 2033
- Table 35: Italy Champagne Industry Revenue (billion) Forecast, by Application 2020 & 2033
- Table 36: Italy Champagne Industry Volume (Million) Forecast, by Application 2020 & 2033
- Table 37: Russia Champagne Industry Revenue (billion) Forecast, by Application 2020 & 2033
- Table 38: Russia Champagne Industry Volume (Million) Forecast, by Application 2020 & 2033
- Table 39: Rest of Europe Champagne Industry Revenue (billion) Forecast, by Application 2020 & 2033
- Table 40: Rest of Europe Champagne Industry Volume (Million) Forecast, by Application 2020 & 2033
- Table 41: Global Champagne Industry Revenue billion Forecast, by Type 2020 & 2033
- Table 42: Global Champagne Industry Volume Million Forecast, by Type 2020 & 2033
- Table 43: Global Champagne Industry Revenue billion Forecast, by Distribution Channel 2020 & 2033
- Table 44: Global Champagne Industry Volume Million Forecast, by Distribution Channel 2020 & 2033
- Table 45: Global Champagne Industry Revenue billion Forecast, by Country 2020 & 2033
- Table 46: Global Champagne Industry Volume Million Forecast, by Country 2020 & 2033
- Table 47: China Champagne Industry Revenue (billion) Forecast, by Application 2020 & 2033
- Table 48: China Champagne Industry Volume (Million) Forecast, by Application 2020 & 2033
- Table 49: Japan Champagne Industry Revenue (billion) Forecast, by Application 2020 & 2033
- Table 50: Japan Champagne Industry Volume (Million) Forecast, by Application 2020 & 2033
- Table 51: India Champagne Industry Revenue (billion) Forecast, by Application 2020 & 2033
- Table 52: India Champagne Industry Volume (Million) Forecast, by Application 2020 & 2033
- Table 53: Australia Champagne Industry Revenue (billion) Forecast, by Application 2020 & 2033
- Table 54: Australia Champagne Industry Volume (Million) Forecast, by Application 2020 & 2033
- Table 55: Rest of Asia Pacific Champagne Industry Revenue (billion) Forecast, by Application 2020 & 2033
- Table 56: Rest of Asia Pacific Champagne Industry Volume (Million) Forecast, by Application 2020 & 2033
- Table 57: Global Champagne Industry Revenue billion Forecast, by Type 2020 & 2033
- Table 58: Global Champagne Industry Volume Million Forecast, by Type 2020 & 2033
- Table 59: Global Champagne Industry Revenue billion Forecast, by Distribution Channel 2020 & 2033
- Table 60: Global Champagne Industry Volume Million Forecast, by Distribution Channel 2020 & 2033
- Table 61: Global Champagne Industry Revenue billion Forecast, by Country 2020 & 2033
- Table 62: Global Champagne Industry Volume Million Forecast, by Country 2020 & 2033
- Table 63: Brazil Champagne Industry Revenue (billion) Forecast, by Application 2020 & 2033
- Table 64: Brazil Champagne Industry Volume (Million) Forecast, by Application 2020 & 2033
- Table 65: Argentina Champagne Industry Revenue (billion) Forecast, by Application 2020 & 2033
- Table 66: Argentina Champagne Industry Volume (Million) Forecast, by Application 2020 & 2033
- Table 67: Rest of South America Champagne Industry Revenue (billion) Forecast, by Application 2020 & 2033
- Table 68: Rest of South America Champagne Industry Volume (Million) Forecast, by Application 2020 & 2033
- Table 69: Global Champagne Industry Revenue billion Forecast, by Type 2020 & 2033
- Table 70: Global Champagne Industry Volume Million Forecast, by Type 2020 & 2033
- Table 71: Global Champagne Industry Revenue billion Forecast, by Distribution Channel 2020 & 2033
- Table 72: Global Champagne Industry Volume Million Forecast, by Distribution Channel 2020 & 2033
- Table 73: Global Champagne Industry Revenue billion Forecast, by Country 2020 & 2033
- Table 74: Global Champagne Industry Volume Million Forecast, by Country 2020 & 2033
- Table 75: South Africa Champagne Industry Revenue (billion) Forecast, by Application 2020 & 2033
- Table 76: South Africa Champagne Industry Volume (Million) Forecast, by Application 2020 & 2033
- Table 77: Saudi Arabia Champagne Industry Revenue (billion) Forecast, by Application 2020 & 2033
- Table 78: Saudi Arabia Champagne Industry Volume (Million) Forecast, by Application 2020 & 2033
- Table 79: Rest of Middle East and Africa Champagne Industry Revenue (billion) Forecast, by Application 2020 & 2033
- Table 80: Rest of Middle East and Africa Champagne Industry Volume (Million) Forecast, by Application 2020 & 2033
Frequently Asked Questions
1. What is the projected Compound Annual Growth Rate (CAGR) of the Champagne Industry?
The projected CAGR is approximately 2.3%.
2. Which companies are prominent players in the Champagne Industry?
Key companies in the market include La Marca USA, Champagne AYALA, Andre Champagne Cellars, Champagne Taittinger CCVC, Societe Jacques Bollinger SA, LVMH Moet Hennessy*List Not Exhaustive, Laurent-Perrier Group, Diageo plc, F Korbel & Bros, Cook's Champagne Cellars.
3. What are the main segments of the Champagne Industry?
The market segments include Type, Distribution Channel.
4. Can you provide details about the market size?
The market size is estimated to be USD 6.43 billion as of 2022.
5. What are some drivers contributing to market growth?
Demand for Premium and Super Premium Vodka; Effective Branding and Marketing by Players.
6. What are the notable trends driving market growth?
Online Platform to Increase the Market Growth.
7. Are there any restraints impacting market growth?
Stringent Regulations Pertaining to Vodka; Popularity of Non-alcoholic Beverages.
8. Can you provide examples of recent developments in the market?
October 2022: Societe Jacques Bollinger SA introduced a new limited edition champagne, "Special Cuvee, The Bollinger Style," to celebrate 40 years of partnership with 007. The limited edition gift box features the silhouette of James Bond alongside his Aston Martin DB5.
9. What pricing options are available for accessing the report?
Pricing options include single-user, multi-user, and enterprise licenses priced at USD 4750, USD 5250, and USD 8750 respectively.
10. Is the market size provided in terms of value or volume?
The market size is provided in terms of value, measured in billion and volume, measured in Million.
11. Are there any specific market keywords associated with the report?
Yes, the market keyword associated with the report is "Champagne Industry," which aids in identifying and referencing the specific market segment covered.
12. How do I determine which pricing option suits my needs best?
The pricing options vary based on user requirements and access needs. Individual users may opt for single-user licenses, while businesses requiring broader access may choose multi-user or enterprise licenses for cost-effective access to the report.
13. Are there any additional resources or data provided in the Champagne Industry report?
While the report offers comprehensive insights, it's advisable to review the specific contents or supplementary materials provided to ascertain if additional resources or data are available.
14. How can I stay updated on further developments or reports in the Champagne Industry?
To stay informed about further developments, trends, and reports in the Champagne Industry, consider subscribing to industry newsletters, following relevant companies and organizations, or regularly checking reputable industry news sources and publications.
Methodology
Step 1 - Identification of Relevant Samples Size from Population Database


Step 2 - Approaches for Defining Global Market Size (Value, Volume* & Price*)

Note*: In applicable scenarios
Step 3 - Data Sources
Primary Research
- Web Analytics
- Survey Reports
- Research Institute
- Latest Research Reports
- Opinion Leaders
Secondary Research
- Annual Reports
- White Paper
- Latest Press Release
- Industry Association
- Paid Database
- Investor Presentations

Step 4 - Data Triangulation
Involves using different sources of information in order to increase the validity of a study
These sources are likely to be stakeholders in a program - participants, other researchers, program staff, other community members, and so on.
Then we put all data in single framework & apply various statistical tools to find out the dynamic on the market.
During the analysis stage, feedback from the stakeholder groups would be compared to determine areas of agreement as well as areas of divergence