

Key Insights
The global cell line development market is experiencing robust growth, driven by the burgeoning biopharmaceutical industry's demand for efficient and cost-effective cell line generation for therapeutic protein production, vaccine development, and drug discovery. The market's 10.60% CAGR indicates a significant expansion from 2019 to 2033, fueled by advancements in technologies such as CRISPR-Cas9 gene editing, which enables precise modifications to cell lines, enhancing their productivity and therapeutic potential. Increased investments in research and development, particularly in personalized medicine and cell-based therapies, further contribute to market expansion. The market is segmented by end-user (biotech and pharmaceutical companies leading the demand), product type (reagents and media holding a significant share due to their consistent use in cell culture), cell source (mammalian cell lines dominating due to their physiological relevance), and application (recombinant protein expression and vaccine production being major drivers). The North American market currently holds a substantial share, attributed to the presence of major players and robust regulatory frameworks. However, Asia-Pacific is projected to exhibit the highest growth rate during the forecast period, driven by increasing government support for biotechnology and growing investments from pharmaceutical companies in this region.
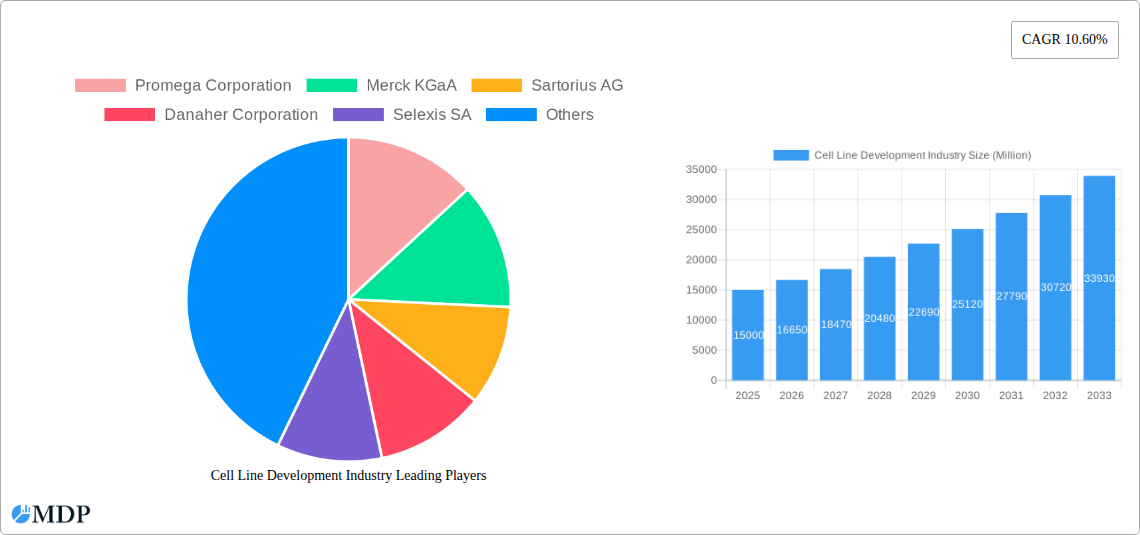
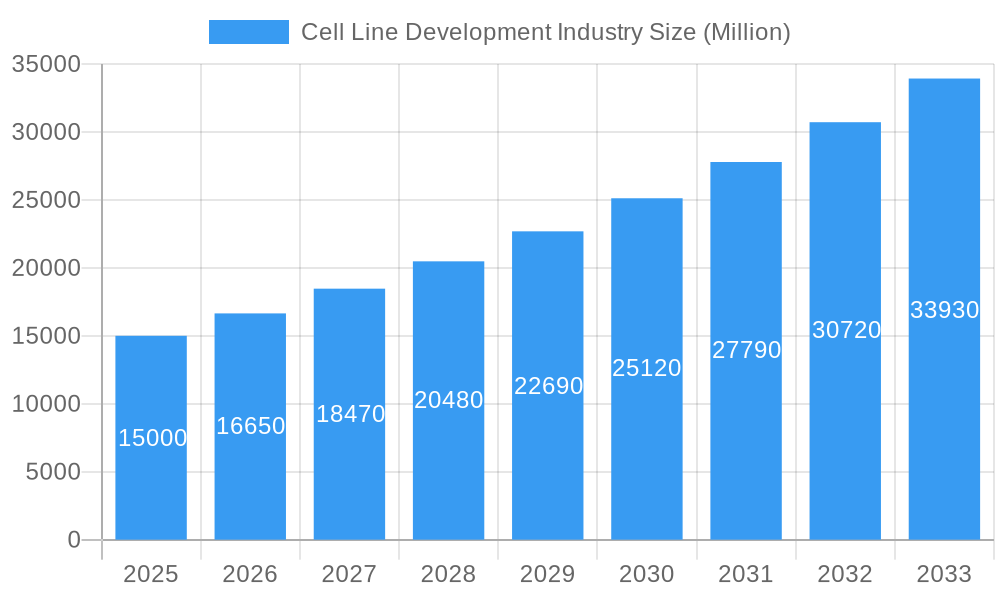
Cell Line Development Industry Market Size (In Billion)
Competition in the cell line development market is intense, with established players like Thermo Fisher Scientific, Merck KGaA, and Sartorius AG vying for market share alongside emerging companies specializing in innovative cell line engineering technologies. The market faces challenges such as stringent regulatory approvals and the high cost associated with developing and validating novel cell lines. Nonetheless, the growing demand for biologics, the increasing adoption of advanced technologies, and the continuous expansion of contract research organizations (CROs) are expected to offset these restraints and ensure sustained market growth throughout the forecast period. The focus is shifting toward developing robust, high-producing cell lines with improved characteristics for enhanced downstream processing, reducing production costs and time to market.
Cell Line Development Industry Company Market Share
Cell Line Development Industry: Market Report 2019-2033
This comprehensive report provides an in-depth analysis of the Cell Line Development industry, projecting a market value of $XX Million by 2033. It covers market dynamics, leading players, technological advancements, and future growth opportunities, offering actionable insights for stakeholders across the biotech, pharmaceutical, and research sectors. The report utilizes data from 2019-2024 (Historical Period), with 2025 as the base and estimated year, and forecasts extending to 2033 (Forecast Period).
Cell Line Development Industry Market Dynamics & Concentration
The Cell Line Development market, valued at $XX Million in 2025, exhibits a moderately concentrated landscape with key players holding significant market share. While precise figures are proprietary to the full report, Promega Corporation, Merck KGaA, Sartorius AG, Danaher Corporation, Selexis SA, Fujifilm Corporation (Fujifilm Diosynth Biotechnologies), American Type Culture Collection (ATCC), WuXi Biologics, Thermo Fisher Scientific, and Corning Incorporated are among the leading companies driving innovation and expansion.
Market concentration is influenced by factors such as:
- Stringent Regulatory Frameworks: Compliance requirements necessitate significant investments in infrastructure and quality control, creating barriers to entry for smaller players.
- Technological Innovation: Continuous advancements in cell line engineering, particularly in gene editing and automation, are shaping the competitive landscape.
- Mergers and Acquisitions (M&A): The industry has witnessed several notable M&A activities, leading to consolidation and increased market share for larger players. The full report provides a detailed analysis of M&A deal counts and their impact on market share during the study period (2019-2024), with projected numbers for the forecast period. For example, the xx M&A deals in 2024 contributed to a xx% increase in market concentration.
- Product Substitutes: While limited, the emergence of alternative technologies for biopharmaceutical production, such as cell-free protein synthesis, presents potential challenges.
- End-User Trends: Growing demand for personalized medicine and advanced therapies fuels market growth, particularly within the biotech and pharmaceutical segments.
Cell Line Development Industry Industry Trends & Analysis
The Cell Line Development industry demonstrates robust growth, projected to achieve a CAGR of xx% during the forecast period (2025-2033). Key factors driving this growth include:
- Increased Demand for Biopharmaceuticals: The rising prevalence of chronic diseases globally is driving significant investment in biopharmaceutical development, fueling the demand for efficient and high-yielding cell lines.
- Technological Advancements: Innovations in gene editing technologies (like CRISPR-Cas9), high-throughput screening, and automation are significantly improving cell line development efficiency and reducing costs. Market penetration of these technologies is rapidly increasing, with adoption rates projected to reach xx% by 2033.
- Growing Adoption of Contract Development and Manufacturing Organizations (CDMOs): Biotech companies are increasingly outsourcing cell line development activities to CDMOs, accelerating product development timelines. The investment of USD 1.6 billion by FUJIFILM Corporation in June 2022 exemplifies this trend.
- Shift Towards Mammalian Cell Lines: Mammalian cell lines are increasingly favored due to their ability to produce complex proteins with post-translational modifications essential for therapeutic efficacy.
- Competitive Dynamics: Intense competition among established players and emerging companies fosters innovation, improving product offerings and driving down costs.
Leading Markets & Segments in Cell Line Development Industry
The North American region dominates the Cell Line Development market, driven by robust funding for biotech and pharmaceutical research, coupled with a well-established regulatory framework. However, the Asia-Pacific region is experiencing rapid growth, fueled by increasing investments in life sciences infrastructure and a growing pool of skilled researchers.
Key Drivers by Segment:
End User:
- Biotech and Pharmaceutical Companies: This segment accounts for the largest market share, driven by the need for efficient cell line development for drug discovery and production.
- Academics and Research Institutes: Growing research activities in areas such as regenerative medicine and personalized medicine contribute to this segment's growth.
- Other End Users: This segment includes contract research organizations (CROs) and other service providers.
Product:
- Reagent and Media: This segment is experiencing high demand driven by increased cell culture activities.
- Equipment: Automation and high-throughput technologies are major drivers of market growth in this segment.
- Finished Cells: Ready-to-use cell lines are witnessing increased demand for their convenience and time-saving benefits.
- Other Products: This category includes software and related services.
Source:
- Mammalian Cell Lines: The dominant segment due to superior protein production capabilities.
- Non-mammalian Cell Lines: This segment is experiencing growth due to its cost-effectiveness in specific applications.
Application:
- Recombinant Protein Expression: The largest application segment, fueled by the demand for therapeutic proteins and biosimilars.
- Hybridomas Technology: This segment contributes significantly to monoclonal antibody production.
- Vaccine Production: High demand for vaccines drives market growth in this segment.
- Drug Discovery: Extensive use of cell lines in drug screening and development supports this segment's expansion.
- Other Applications: This includes research and diagnostic applications.
Cell Line Development Industry Product Developments
Recent advancements in cell line engineering focus on improving cell line productivity, stability, and scalability. Innovations include the application of gene editing tools like CRISPR-Cas9 for precise genetic modifications and the development of novel cell culture media formulations that enhance cell growth and protein production. These improvements directly translate into reduced production costs and faster development cycles, meeting the growing demands of the biopharmaceutical industry.
Key Drivers of Cell Line Development Industry Growth
The Cell Line Development industry's growth is primarily propelled by:
- Technological advancements: Gene editing technologies, automation, and improved cell culture techniques are accelerating efficiency and reducing costs.
- Rising demand for biopharmaceuticals: The increasing prevalence of chronic diseases globally fuels demand for innovative therapies.
- Favorable regulatory environment: Government initiatives promoting biopharmaceutical research and development incentivize industry growth.
Challenges in the Cell Line Development Industry Market
The industry faces several challenges:
- Stringent regulatory hurdles: Meeting stringent regulatory requirements for cell line development and manufacturing adds to production costs and timelines.
- Supply chain disruptions: Fluctuations in raw material prices and supply chain disruptions can significantly impact production costs and availability.
- Intense competition: The presence of numerous established and emerging players creates intense competition, putting pressure on pricing and margins.
Emerging Opportunities in Cell Line Development Industry
Several factors present significant growth opportunities:
- Advancements in gene editing technologies: Further improvements in gene editing tools promise even greater precision and efficiency in cell line development.
- Strategic partnerships and collaborations: Collaboration between biotech companies, CDMOs, and research institutions can accelerate innovation and access to resources.
- Expansion into emerging markets: Developing economies are presenting significant untapped opportunities for cell line development services.
Leading Players in the Cell Line Development Industry Sector
- Promega Corporation
- Merck KGaA
- Sartorius AG
- Danaher Corporation
- Selexis SA
- Fujifilm Corporation (Fujifilm Diosynth Biotechnologies)
- American Type Culture Collection (ATCC)
- WuXi Biologics
- Thermo Fisher Scientific
- Corning Incorporated
Key Milestones in Cell Line Development Industry Industry
- July 2022: ProBioGen and Granite Bio collaborate to provide GMP manufacturing and cell line development services, highlighting advancements in the treatment of autoimmune and specific cancer indications using the DirectedLuck transposase.
- June 2022: FUJIFILM Corporation invests USD 1.6 Billion to expand cell culture manufacturing services, signifying significant investment and growth in the CDMO sector.
Strategic Outlook for Cell Line Development Industry Market
The Cell Line Development industry is poised for significant growth, driven by continuous technological advancements, increased demand for biopharmaceuticals, and strategic partnerships. The focus on personalized medicine and advanced therapies will further propel market expansion, creating attractive opportunities for established players and new entrants alike. The report provides a detailed strategic roadmap for companies seeking to capitalize on this promising market.
Cell Line Development Industry Segmentation
-
1. Product
- 1.1. Reagent and Media
- 1.2. Equipment
- 1.3. Finished Cells
- 1.4. Other Products
-
2. Source
- 2.1. Mammalian Cell Line
- 2.2. Non-mammalian Cell Line
-
3. Application
- 3.1. Recombinant Protein Expression
- 3.2. Hybridomas Technology
- 3.3. Vaccine Production
- 3.4. Drug Discovery
- 3.5. Other Applications
-
4. End User
- 4.1. Biotech and Pharmaceutical Companies
- 4.2. Academics and Research Institutes
- 4.3. Other End Users
Cell Line Development Industry Segmentation By Geography
-
1. North America
- 1.1. United States
- 1.2. Canada
- 1.3. Mexico
-
2. Europe
- 2.1. Germany
- 2.2. United Kingdom
- 2.3. France
- 2.4. Italy
- 2.5. Spain
- 2.6. Rest of Europe
-
3. Asia Pacific
- 3.1. China
- 3.2. Japan
- 3.3. India
- 3.4. Australia
- 3.5. South Korea
- 3.6. Rest of Asia Pacific
-
4. Middle East and Africa
- 4.1. GCC
- 4.2. South Africa
- 4.3. Rest of Middle East and Africa
-
5. South America
- 5.1. Brazil
- 5.2. Argentina
- 5.3. Rest of South America
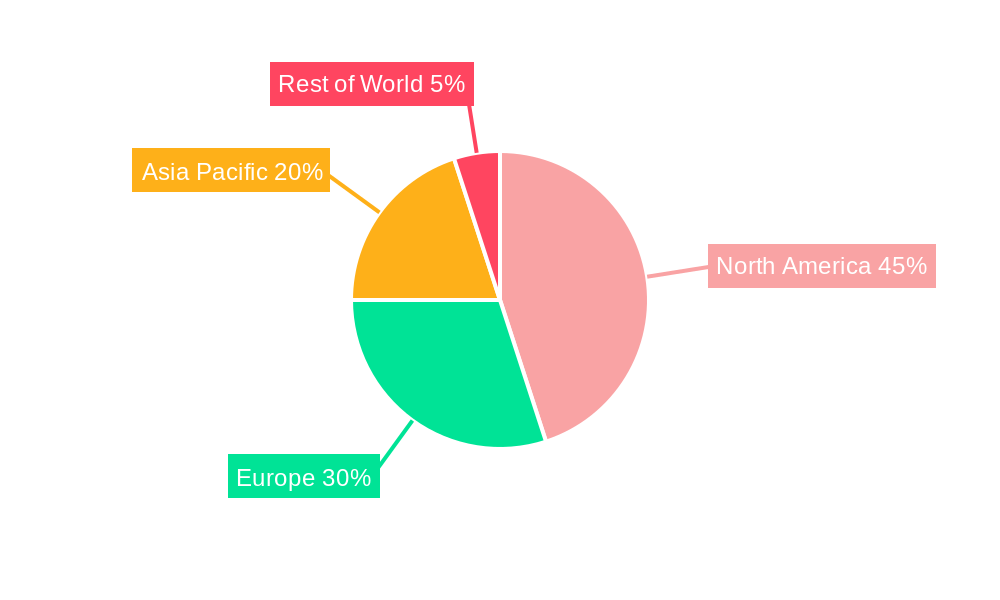
Cell Line Development Industry Regional Market Share
Geographic Coverage of Cell Line Development Industry
Cell Line Development Industry REPORT HIGHLIGHTS
| Aspects | Details |
|---|---|
| Study Period | 2020-2034 |
| Base Year | 2025 |
| Estimated Year | 2026 |
| Forecast Period | 2026-2034 |
| Historical Period | 2020-2025 |
| Growth Rate | CAGR of 6.4% from 2020-2034 |
| Segmentation |
|
Table of Contents
- 1. Introduction
- 1.1. Research Scope
- 1.2. Market Segmentation
- 1.3. Research Objective
- 1.4. Definitions and Assumptions
- 2. Executive Summary
- 2.1. Market Snapshot
- 3. Market Dynamics
- 3.1. Market Drivers
- 3.2. Market Restrains
- 3.3. Market Trends
- 3.4. Market Opportunities
- 4. Market Factor Analysis
- 4.1. Porters Five Forces
- 4.1.1. Bargaining Power of Suppliers
- 4.1.2. Bargaining Power of Buyers
- 4.1.3. Threat of New Entrants
- 4.1.4. Threat of Substitutes
- 4.1.5. Competitive Rivalry
- 4.2. PESTEL analysis
- 4.3. BCG Analysis
- 4.3.1. Stars (High Growth, High Market Share)
- 4.3.2. Cash Cows (Low Growth, High Market Share)
- 4.3.3. Question Mark (High Growth, Low Market Share)
- 4.3.4. Dogs (Low Growth, Low Market Share)
- 4.4. Ansoff Matrix Analysis
- 4.5. Supply Chain Analysis
- 4.6. Regulatory Landscape
- 4.7. Current Market Potential and Opportunity Assessment (TAM–SAM–SOM Framework)
- 4.8. MDP Analyst Note
- 4.1. Porters Five Forces
- 5. Market Analysis, Insights and Forecast 2021-2033
- 5.1. Market Analysis, Insights and Forecast - by Product
- 5.1.1. Reagent and Media
- 5.1.2. Equipment
- 5.1.3. Finished Cells
- 5.1.4. Other Products
- 5.2. Market Analysis, Insights and Forecast - by Source
- 5.2.1. Mammalian Cell Line
- 5.2.2. Non-mammalian Cell Line
- 5.3. Market Analysis, Insights and Forecast - by Application
- 5.3.1. Recombinant Protein Expression
- 5.3.2. Hybridomas Technology
- 5.3.3. Vaccine Production
- 5.3.4. Drug Discovery
- 5.3.5. Other Applications
- 5.4. Market Analysis, Insights and Forecast - by End User
- 5.4.1. Biotech and Pharmaceutical Companies
- 5.4.2. Academics and Research Institutes
- 5.4.3. Other End Users
- 5.5. Market Analysis, Insights and Forecast - by Region
- 5.5.1. North America
- 5.5.2. Europe
- 5.5.3. Asia Pacific
- 5.5.4. Middle East and Africa
- 5.5.5. South America
- 5.1. Market Analysis, Insights and Forecast - by Product
- 6. Global Cell Line Development Industry Analysis, Insights and Forecast, 2021-2033
- 6.1. Market Analysis, Insights and Forecast - by Product
- 6.1.1. Reagent and Media
- 6.1.2. Equipment
- 6.1.3. Finished Cells
- 6.1.4. Other Products
- 6.2. Market Analysis, Insights and Forecast - by Source
- 6.2.1. Mammalian Cell Line
- 6.2.2. Non-mammalian Cell Line
- 6.3. Market Analysis, Insights and Forecast - by Application
- 6.3.1. Recombinant Protein Expression
- 6.3.2. Hybridomas Technology
- 6.3.3. Vaccine Production
- 6.3.4. Drug Discovery
- 6.3.5. Other Applications
- 6.4. Market Analysis, Insights and Forecast - by End User
- 6.4.1. Biotech and Pharmaceutical Companies
- 6.4.2. Academics and Research Institutes
- 6.4.3. Other End Users
- 6.1. Market Analysis, Insights and Forecast - by Product
- 7. North America Cell Line Development Industry Analysis, Insights and Forecast, 2020-2032
- 7.1. Market Analysis, Insights and Forecast - by Product
- 7.1.1. Reagent and Media
- 7.1.2. Equipment
- 7.1.3. Finished Cells
- 7.1.4. Other Products
- 7.2. Market Analysis, Insights and Forecast - by Source
- 7.2.1. Mammalian Cell Line
- 7.2.2. Non-mammalian Cell Line
- 7.3. Market Analysis, Insights and Forecast - by Application
- 7.3.1. Recombinant Protein Expression
- 7.3.2. Hybridomas Technology
- 7.3.3. Vaccine Production
- 7.3.4. Drug Discovery
- 7.3.5. Other Applications
- 7.4. Market Analysis, Insights and Forecast - by End User
- 7.4.1. Biotech and Pharmaceutical Companies
- 7.4.2. Academics and Research Institutes
- 7.4.3. Other End Users
- 7.1. Market Analysis, Insights and Forecast - by Product
- 8. Europe Cell Line Development Industry Analysis, Insights and Forecast, 2020-2032
- 8.1. Market Analysis, Insights and Forecast - by Product
- 8.1.1. Reagent and Media
- 8.1.2. Equipment
- 8.1.3. Finished Cells
- 8.1.4. Other Products
- 8.2. Market Analysis, Insights and Forecast - by Source
- 8.2.1. Mammalian Cell Line
- 8.2.2. Non-mammalian Cell Line
- 8.3. Market Analysis, Insights and Forecast - by Application
- 8.3.1. Recombinant Protein Expression
- 8.3.2. Hybridomas Technology
- 8.3.3. Vaccine Production
- 8.3.4. Drug Discovery
- 8.3.5. Other Applications
- 8.4. Market Analysis, Insights and Forecast - by End User
- 8.4.1. Biotech and Pharmaceutical Companies
- 8.4.2. Academics and Research Institutes
- 8.4.3. Other End Users
- 8.1. Market Analysis, Insights and Forecast - by Product
- 9. Asia Pacific Cell Line Development Industry Analysis, Insights and Forecast, 2020-2032
- 9.1. Market Analysis, Insights and Forecast - by Product
- 9.1.1. Reagent and Media
- 9.1.2. Equipment
- 9.1.3. Finished Cells
- 9.1.4. Other Products
- 9.2. Market Analysis, Insights and Forecast - by Source
- 9.2.1. Mammalian Cell Line
- 9.2.2. Non-mammalian Cell Line
- 9.3. Market Analysis, Insights and Forecast - by Application
- 9.3.1. Recombinant Protein Expression
- 9.3.2. Hybridomas Technology
- 9.3.3. Vaccine Production
- 9.3.4. Drug Discovery
- 9.3.5. Other Applications
- 9.4. Market Analysis, Insights and Forecast - by End User
- 9.4.1. Biotech and Pharmaceutical Companies
- 9.4.2. Academics and Research Institutes
- 9.4.3. Other End Users
- 9.1. Market Analysis, Insights and Forecast - by Product
- 10. Middle East and Africa Cell Line Development Industry Analysis, Insights and Forecast, 2020-2032
- 10.1. Market Analysis, Insights and Forecast - by Product
- 10.1.1. Reagent and Media
- 10.1.2. Equipment
- 10.1.3. Finished Cells
- 10.1.4. Other Products
- 10.2. Market Analysis, Insights and Forecast - by Source
- 10.2.1. Mammalian Cell Line
- 10.2.2. Non-mammalian Cell Line
- 10.3. Market Analysis, Insights and Forecast - by Application
- 10.3.1. Recombinant Protein Expression
- 10.3.2. Hybridomas Technology
- 10.3.3. Vaccine Production
- 10.3.4. Drug Discovery
- 10.3.5. Other Applications
- 10.4. Market Analysis, Insights and Forecast - by End User
- 10.4.1. Biotech and Pharmaceutical Companies
- 10.4.2. Academics and Research Institutes
- 10.4.3. Other End Users
- 10.1. Market Analysis, Insights and Forecast - by Product
- 11. South America Cell Line Development Industry Analysis, Insights and Forecast, 2020-2032
- 11.1. Market Analysis, Insights and Forecast - by Product
- 11.1.1. Reagent and Media
- 11.1.2. Equipment
- 11.1.3. Finished Cells
- 11.1.4. Other Products
- 11.2. Market Analysis, Insights and Forecast - by Source
- 11.2.1. Mammalian Cell Line
- 11.2.2. Non-mammalian Cell Line
- 11.3. Market Analysis, Insights and Forecast - by Application
- 11.3.1. Recombinant Protein Expression
- 11.3.2. Hybridomas Technology
- 11.3.3. Vaccine Production
- 11.3.4. Drug Discovery
- 11.3.5. Other Applications
- 11.4. Market Analysis, Insights and Forecast - by End User
- 11.4.1. Biotech and Pharmaceutical Companies
- 11.4.2. Academics and Research Institutes
- 11.4.3. Other End Users
- 11.1. Market Analysis, Insights and Forecast - by Product
- 12. Competitive Analysis
- 12.1. Company Profiles
- 12.1.1 Promega Corporation
- 12.1.1.1. Company Overview
- 12.1.1.2. Products
- 12.1.1.3. Company Financials
- 12.1.1.4. SWOT Analysis
- 12.1.2 Merck KGaA
- 12.1.2.1. Company Overview
- 12.1.2.2. Products
- 12.1.2.3. Company Financials
- 12.1.2.4. SWOT Analysis
- 12.1.3 Sartorius AG
- 12.1.3.1. Company Overview
- 12.1.3.2. Products
- 12.1.3.3. Company Financials
- 12.1.3.4. SWOT Analysis
- 12.1.4 Danaher Corporation
- 12.1.4.1. Company Overview
- 12.1.4.2. Products
- 12.1.4.3. Company Financials
- 12.1.4.4. SWOT Analysis
- 12.1.5 Selexis SA
- 12.1.5.1. Company Overview
- 12.1.5.2. Products
- 12.1.5.3. Company Financials
- 12.1.5.4. SWOT Analysis
- 12.1.6 Fujifilm Corporation (Fujifilm Diosynth Biotechnologies)
- 12.1.6.1. Company Overview
- 12.1.6.2. Products
- 12.1.6.3. Company Financials
- 12.1.6.4. SWOT Analysis
- 12.1.7 American Type Culture Collection (ATCC)
- 12.1.7.1. Company Overview
- 12.1.7.2. Products
- 12.1.7.3. Company Financials
- 12.1.7.4. SWOT Analysis
- 12.1.8 WuXi Biologics
- 12.1.8.1. Company Overview
- 12.1.8.2. Products
- 12.1.8.3. Company Financials
- 12.1.8.4. SWOT Analysis
- 12.1.9 Thermo Fisher Scientific
- 12.1.9.1. Company Overview
- 12.1.9.2. Products
- 12.1.9.3. Company Financials
- 12.1.9.4. SWOT Analysis
- 12.1.10 Corning Incorporated
- 12.1.10.1. Company Overview
- 12.1.10.2. Products
- 12.1.10.3. Company Financials
- 12.1.10.4. SWOT Analysis
- 12.1.1 Promega Corporation
- 12.2. Market Entropy
- 12.2.1 Company's Key Areas Served
- 12.2.2 Recent Developments
- 12.3. Company Market Share Analysis 2025
- 12.3.1 Top 5 Companies Market Share Analysis
- 12.3.2 Top 3 Companies Market Share Analysis
- 12.4. List of Potential Customers
- 13. Research Methodology
List of Figures
- Figure 1: Global Cell Line Development Industry Revenue Breakdown (billion, %) by Region 2025 & 2033
- Figure 2: Global Cell Line Development Industry Volume Breakdown (K Unit, %) by Region 2025 & 2033
- Figure 3: North America Cell Line Development Industry Revenue (billion), by Product 2025 & 2033
- Figure 4: North America Cell Line Development Industry Volume (K Unit), by Product 2025 & 2033
- Figure 5: North America Cell Line Development Industry Revenue Share (%), by Product 2025 & 2033
- Figure 6: North America Cell Line Development Industry Volume Share (%), by Product 2025 & 2033
- Figure 7: North America Cell Line Development Industry Revenue (billion), by Source 2025 & 2033
- Figure 8: North America Cell Line Development Industry Volume (K Unit), by Source 2025 & 2033
- Figure 9: North America Cell Line Development Industry Revenue Share (%), by Source 2025 & 2033
- Figure 10: North America Cell Line Development Industry Volume Share (%), by Source 2025 & 2033
- Figure 11: North America Cell Line Development Industry Revenue (billion), by Application 2025 & 2033
- Figure 12: North America Cell Line Development Industry Volume (K Unit), by Application 2025 & 2033
- Figure 13: North America Cell Line Development Industry Revenue Share (%), by Application 2025 & 2033
- Figure 14: North America Cell Line Development Industry Volume Share (%), by Application 2025 & 2033
- Figure 15: North America Cell Line Development Industry Revenue (billion), by End User 2025 & 2033
- Figure 16: North America Cell Line Development Industry Volume (K Unit), by End User 2025 & 2033
- Figure 17: North America Cell Line Development Industry Revenue Share (%), by End User 2025 & 2033
- Figure 18: North America Cell Line Development Industry Volume Share (%), by End User 2025 & 2033
- Figure 19: North America Cell Line Development Industry Revenue (billion), by Country 2025 & 2033
- Figure 20: North America Cell Line Development Industry Volume (K Unit), by Country 2025 & 2033
- Figure 21: North America Cell Line Development Industry Revenue Share (%), by Country 2025 & 2033
- Figure 22: North America Cell Line Development Industry Volume Share (%), by Country 2025 & 2033
- Figure 23: Europe Cell Line Development Industry Revenue (billion), by Product 2025 & 2033
- Figure 24: Europe Cell Line Development Industry Volume (K Unit), by Product 2025 & 2033
- Figure 25: Europe Cell Line Development Industry Revenue Share (%), by Product 2025 & 2033
- Figure 26: Europe Cell Line Development Industry Volume Share (%), by Product 2025 & 2033
- Figure 27: Europe Cell Line Development Industry Revenue (billion), by Source 2025 & 2033
- Figure 28: Europe Cell Line Development Industry Volume (K Unit), by Source 2025 & 2033
- Figure 29: Europe Cell Line Development Industry Revenue Share (%), by Source 2025 & 2033
- Figure 30: Europe Cell Line Development Industry Volume Share (%), by Source 2025 & 2033
- Figure 31: Europe Cell Line Development Industry Revenue (billion), by Application 2025 & 2033
- Figure 32: Europe Cell Line Development Industry Volume (K Unit), by Application 2025 & 2033
- Figure 33: Europe Cell Line Development Industry Revenue Share (%), by Application 2025 & 2033
- Figure 34: Europe Cell Line Development Industry Volume Share (%), by Application 2025 & 2033
- Figure 35: Europe Cell Line Development Industry Revenue (billion), by End User 2025 & 2033
- Figure 36: Europe Cell Line Development Industry Volume (K Unit), by End User 2025 & 2033
- Figure 37: Europe Cell Line Development Industry Revenue Share (%), by End User 2025 & 2033
- Figure 38: Europe Cell Line Development Industry Volume Share (%), by End User 2025 & 2033
- Figure 39: Europe Cell Line Development Industry Revenue (billion), by Country 2025 & 2033
- Figure 40: Europe Cell Line Development Industry Volume (K Unit), by Country 2025 & 2033
- Figure 41: Europe Cell Line Development Industry Revenue Share (%), by Country 2025 & 2033
- Figure 42: Europe Cell Line Development Industry Volume Share (%), by Country 2025 & 2033
- Figure 43: Asia Pacific Cell Line Development Industry Revenue (billion), by Product 2025 & 2033
- Figure 44: Asia Pacific Cell Line Development Industry Volume (K Unit), by Product 2025 & 2033
- Figure 45: Asia Pacific Cell Line Development Industry Revenue Share (%), by Product 2025 & 2033
- Figure 46: Asia Pacific Cell Line Development Industry Volume Share (%), by Product 2025 & 2033
- Figure 47: Asia Pacific Cell Line Development Industry Revenue (billion), by Source 2025 & 2033
- Figure 48: Asia Pacific Cell Line Development Industry Volume (K Unit), by Source 2025 & 2033
- Figure 49: Asia Pacific Cell Line Development Industry Revenue Share (%), by Source 2025 & 2033
- Figure 50: Asia Pacific Cell Line Development Industry Volume Share (%), by Source 2025 & 2033
- Figure 51: Asia Pacific Cell Line Development Industry Revenue (billion), by Application 2025 & 2033
- Figure 52: Asia Pacific Cell Line Development Industry Volume (K Unit), by Application 2025 & 2033
- Figure 53: Asia Pacific Cell Line Development Industry Revenue Share (%), by Application 2025 & 2033
- Figure 54: Asia Pacific Cell Line Development Industry Volume Share (%), by Application 2025 & 2033
- Figure 55: Asia Pacific Cell Line Development Industry Revenue (billion), by End User 2025 & 2033
- Figure 56: Asia Pacific Cell Line Development Industry Volume (K Unit), by End User 2025 & 2033
- Figure 57: Asia Pacific Cell Line Development Industry Revenue Share (%), by End User 2025 & 2033
- Figure 58: Asia Pacific Cell Line Development Industry Volume Share (%), by End User 2025 & 2033
- Figure 59: Asia Pacific Cell Line Development Industry Revenue (billion), by Country 2025 & 2033
- Figure 60: Asia Pacific Cell Line Development Industry Volume (K Unit), by Country 2025 & 2033
- Figure 61: Asia Pacific Cell Line Development Industry Revenue Share (%), by Country 2025 & 2033
- Figure 62: Asia Pacific Cell Line Development Industry Volume Share (%), by Country 2025 & 2033
- Figure 63: Middle East and Africa Cell Line Development Industry Revenue (billion), by Product 2025 & 2033
- Figure 64: Middle East and Africa Cell Line Development Industry Volume (K Unit), by Product 2025 & 2033
- Figure 65: Middle East and Africa Cell Line Development Industry Revenue Share (%), by Product 2025 & 2033
- Figure 66: Middle East and Africa Cell Line Development Industry Volume Share (%), by Product 2025 & 2033
- Figure 67: Middle East and Africa Cell Line Development Industry Revenue (billion), by Source 2025 & 2033
- Figure 68: Middle East and Africa Cell Line Development Industry Volume (K Unit), by Source 2025 & 2033
- Figure 69: Middle East and Africa Cell Line Development Industry Revenue Share (%), by Source 2025 & 2033
- Figure 70: Middle East and Africa Cell Line Development Industry Volume Share (%), by Source 2025 & 2033
- Figure 71: Middle East and Africa Cell Line Development Industry Revenue (billion), by Application 2025 & 2033
- Figure 72: Middle East and Africa Cell Line Development Industry Volume (K Unit), by Application 2025 & 2033
- Figure 73: Middle East and Africa Cell Line Development Industry Revenue Share (%), by Application 2025 & 2033
- Figure 74: Middle East and Africa Cell Line Development Industry Volume Share (%), by Application 2025 & 2033
- Figure 75: Middle East and Africa Cell Line Development Industry Revenue (billion), by End User 2025 & 2033
- Figure 76: Middle East and Africa Cell Line Development Industry Volume (K Unit), by End User 2025 & 2033
- Figure 77: Middle East and Africa Cell Line Development Industry Revenue Share (%), by End User 2025 & 2033
- Figure 78: Middle East and Africa Cell Line Development Industry Volume Share (%), by End User 2025 & 2033
- Figure 79: Middle East and Africa Cell Line Development Industry Revenue (billion), by Country 2025 & 2033
- Figure 80: Middle East and Africa Cell Line Development Industry Volume (K Unit), by Country 2025 & 2033
- Figure 81: Middle East and Africa Cell Line Development Industry Revenue Share (%), by Country 2025 & 2033
- Figure 82: Middle East and Africa Cell Line Development Industry Volume Share (%), by Country 2025 & 2033
- Figure 83: South America Cell Line Development Industry Revenue (billion), by Product 2025 & 2033
- Figure 84: South America Cell Line Development Industry Volume (K Unit), by Product 2025 & 2033
- Figure 85: South America Cell Line Development Industry Revenue Share (%), by Product 2025 & 2033
- Figure 86: South America Cell Line Development Industry Volume Share (%), by Product 2025 & 2033
- Figure 87: South America Cell Line Development Industry Revenue (billion), by Source 2025 & 2033
- Figure 88: South America Cell Line Development Industry Volume (K Unit), by Source 2025 & 2033
- Figure 89: South America Cell Line Development Industry Revenue Share (%), by Source 2025 & 2033
- Figure 90: South America Cell Line Development Industry Volume Share (%), by Source 2025 & 2033
- Figure 91: South America Cell Line Development Industry Revenue (billion), by Application 2025 & 2033
- Figure 92: South America Cell Line Development Industry Volume (K Unit), by Application 2025 & 2033
- Figure 93: South America Cell Line Development Industry Revenue Share (%), by Application 2025 & 2033
- Figure 94: South America Cell Line Development Industry Volume Share (%), by Application 2025 & 2033
- Figure 95: South America Cell Line Development Industry Revenue (billion), by End User 2025 & 2033
- Figure 96: South America Cell Line Development Industry Volume (K Unit), by End User 2025 & 2033
- Figure 97: South America Cell Line Development Industry Revenue Share (%), by End User 2025 & 2033
- Figure 98: South America Cell Line Development Industry Volume Share (%), by End User 2025 & 2033
- Figure 99: South America Cell Line Development Industry Revenue (billion), by Country 2025 & 2033
- Figure 100: South America Cell Line Development Industry Volume (K Unit), by Country 2025 & 2033
- Figure 101: South America Cell Line Development Industry Revenue Share (%), by Country 2025 & 2033
- Figure 102: South America Cell Line Development Industry Volume Share (%), by Country 2025 & 2033
List of Tables
- Table 1: Global Cell Line Development Industry Revenue billion Forecast, by Product 2020 & 2033
- Table 2: Global Cell Line Development Industry Volume K Unit Forecast, by Product 2020 & 2033
- Table 3: Global Cell Line Development Industry Revenue billion Forecast, by Source 2020 & 2033
- Table 4: Global Cell Line Development Industry Volume K Unit Forecast, by Source 2020 & 2033
- Table 5: Global Cell Line Development Industry Revenue billion Forecast, by Application 2020 & 2033
- Table 6: Global Cell Line Development Industry Volume K Unit Forecast, by Application 2020 & 2033
- Table 7: Global Cell Line Development Industry Revenue billion Forecast, by End User 2020 & 2033
- Table 8: Global Cell Line Development Industry Volume K Unit Forecast, by End User 2020 & 2033
- Table 9: Global Cell Line Development Industry Revenue billion Forecast, by Region 2020 & 2033
- Table 10: Global Cell Line Development Industry Volume K Unit Forecast, by Region 2020 & 2033
- Table 11: Global Cell Line Development Industry Revenue billion Forecast, by Product 2020 & 2033
- Table 12: Global Cell Line Development Industry Volume K Unit Forecast, by Product 2020 & 2033
- Table 13: Global Cell Line Development Industry Revenue billion Forecast, by Source 2020 & 2033
- Table 14: Global Cell Line Development Industry Volume K Unit Forecast, by Source 2020 & 2033
- Table 15: Global Cell Line Development Industry Revenue billion Forecast, by Application 2020 & 2033
- Table 16: Global Cell Line Development Industry Volume K Unit Forecast, by Application 2020 & 2033
- Table 17: Global Cell Line Development Industry Revenue billion Forecast, by End User 2020 & 2033
- Table 18: Global Cell Line Development Industry Volume K Unit Forecast, by End User 2020 & 2033
- Table 19: Global Cell Line Development Industry Revenue billion Forecast, by Country 2020 & 2033
- Table 20: Global Cell Line Development Industry Volume K Unit Forecast, by Country 2020 & 2033
- Table 21: United States Cell Line Development Industry Revenue (billion) Forecast, by Application 2020 & 2033
- Table 22: United States Cell Line Development Industry Volume (K Unit) Forecast, by Application 2020 & 2033
- Table 23: Canada Cell Line Development Industry Revenue (billion) Forecast, by Application 2020 & 2033
- Table 24: Canada Cell Line Development Industry Volume (K Unit) Forecast, by Application 2020 & 2033
- Table 25: Mexico Cell Line Development Industry Revenue (billion) Forecast, by Application 2020 & 2033
- Table 26: Mexico Cell Line Development Industry Volume (K Unit) Forecast, by Application 2020 & 2033
- Table 27: Global Cell Line Development Industry Revenue billion Forecast, by Product 2020 & 2033
- Table 28: Global Cell Line Development Industry Volume K Unit Forecast, by Product 2020 & 2033
- Table 29: Global Cell Line Development Industry Revenue billion Forecast, by Source 2020 & 2033
- Table 30: Global Cell Line Development Industry Volume K Unit Forecast, by Source 2020 & 2033
- Table 31: Global Cell Line Development Industry Revenue billion Forecast, by Application 2020 & 2033
- Table 32: Global Cell Line Development Industry Volume K Unit Forecast, by Application 2020 & 2033
- Table 33: Global Cell Line Development Industry Revenue billion Forecast, by End User 2020 & 2033
- Table 34: Global Cell Line Development Industry Volume K Unit Forecast, by End User 2020 & 2033
- Table 35: Global Cell Line Development Industry Revenue billion Forecast, by Country 2020 & 2033
- Table 36: Global Cell Line Development Industry Volume K Unit Forecast, by Country 2020 & 2033
- Table 37: Germany Cell Line Development Industry Revenue (billion) Forecast, by Application 2020 & 2033
- Table 38: Germany Cell Line Development Industry Volume (K Unit) Forecast, by Application 2020 & 2033
- Table 39: United Kingdom Cell Line Development Industry Revenue (billion) Forecast, by Application 2020 & 2033
- Table 40: United Kingdom Cell Line Development Industry Volume (K Unit) Forecast, by Application 2020 & 2033
- Table 41: France Cell Line Development Industry Revenue (billion) Forecast, by Application 2020 & 2033
- Table 42: France Cell Line Development Industry Volume (K Unit) Forecast, by Application 2020 & 2033
- Table 43: Italy Cell Line Development Industry Revenue (billion) Forecast, by Application 2020 & 2033
- Table 44: Italy Cell Line Development Industry Volume (K Unit) Forecast, by Application 2020 & 2033
- Table 45: Spain Cell Line Development Industry Revenue (billion) Forecast, by Application 2020 & 2033
- Table 46: Spain Cell Line Development Industry Volume (K Unit) Forecast, by Application 2020 & 2033
- Table 47: Rest of Europe Cell Line Development Industry Revenue (billion) Forecast, by Application 2020 & 2033
- Table 48: Rest of Europe Cell Line Development Industry Volume (K Unit) Forecast, by Application 2020 & 2033
- Table 49: Global Cell Line Development Industry Revenue billion Forecast, by Product 2020 & 2033
- Table 50: Global Cell Line Development Industry Volume K Unit Forecast, by Product 2020 & 2033
- Table 51: Global Cell Line Development Industry Revenue billion Forecast, by Source 2020 & 2033
- Table 52: Global Cell Line Development Industry Volume K Unit Forecast, by Source 2020 & 2033
- Table 53: Global Cell Line Development Industry Revenue billion Forecast, by Application 2020 & 2033
- Table 54: Global Cell Line Development Industry Volume K Unit Forecast, by Application 2020 & 2033
- Table 55: Global Cell Line Development Industry Revenue billion Forecast, by End User 2020 & 2033
- Table 56: Global Cell Line Development Industry Volume K Unit Forecast, by End User 2020 & 2033
- Table 57: Global Cell Line Development Industry Revenue billion Forecast, by Country 2020 & 2033
- Table 58: Global Cell Line Development Industry Volume K Unit Forecast, by Country 2020 & 2033
- Table 59: China Cell Line Development Industry Revenue (billion) Forecast, by Application 2020 & 2033
- Table 60: China Cell Line Development Industry Volume (K Unit) Forecast, by Application 2020 & 2033
- Table 61: Japan Cell Line Development Industry Revenue (billion) Forecast, by Application 2020 & 2033
- Table 62: Japan Cell Line Development Industry Volume (K Unit) Forecast, by Application 2020 & 2033
- Table 63: India Cell Line Development Industry Revenue (billion) Forecast, by Application 2020 & 2033
- Table 64: India Cell Line Development Industry Volume (K Unit) Forecast, by Application 2020 & 2033
- Table 65: Australia Cell Line Development Industry Revenue (billion) Forecast, by Application 2020 & 2033
- Table 66: Australia Cell Line Development Industry Volume (K Unit) Forecast, by Application 2020 & 2033
- Table 67: South Korea Cell Line Development Industry Revenue (billion) Forecast, by Application 2020 & 2033
- Table 68: South Korea Cell Line Development Industry Volume (K Unit) Forecast, by Application 2020 & 2033
- Table 69: Rest of Asia Pacific Cell Line Development Industry Revenue (billion) Forecast, by Application 2020 & 2033
- Table 70: Rest of Asia Pacific Cell Line Development Industry Volume (K Unit) Forecast, by Application 2020 & 2033
- Table 71: Global Cell Line Development Industry Revenue billion Forecast, by Product 2020 & 2033
- Table 72: Global Cell Line Development Industry Volume K Unit Forecast, by Product 2020 & 2033
- Table 73: Global Cell Line Development Industry Revenue billion Forecast, by Source 2020 & 2033
- Table 74: Global Cell Line Development Industry Volume K Unit Forecast, by Source 2020 & 2033
- Table 75: Global Cell Line Development Industry Revenue billion Forecast, by Application 2020 & 2033
- Table 76: Global Cell Line Development Industry Volume K Unit Forecast, by Application 2020 & 2033
- Table 77: Global Cell Line Development Industry Revenue billion Forecast, by End User 2020 & 2033
- Table 78: Global Cell Line Development Industry Volume K Unit Forecast, by End User 2020 & 2033
- Table 79: Global Cell Line Development Industry Revenue billion Forecast, by Country 2020 & 2033
- Table 80: Global Cell Line Development Industry Volume K Unit Forecast, by Country 2020 & 2033
- Table 81: GCC Cell Line Development Industry Revenue (billion) Forecast, by Application 2020 & 2033
- Table 82: GCC Cell Line Development Industry Volume (K Unit) Forecast, by Application 2020 & 2033
- Table 83: South Africa Cell Line Development Industry Revenue (billion) Forecast, by Application 2020 & 2033
- Table 84: South Africa Cell Line Development Industry Volume (K Unit) Forecast, by Application 2020 & 2033
- Table 85: Rest of Middle East and Africa Cell Line Development Industry Revenue (billion) Forecast, by Application 2020 & 2033
- Table 86: Rest of Middle East and Africa Cell Line Development Industry Volume (K Unit) Forecast, by Application 2020 & 2033
- Table 87: Global Cell Line Development Industry Revenue billion Forecast, by Product 2020 & 2033
- Table 88: Global Cell Line Development Industry Volume K Unit Forecast, by Product 2020 & 2033
- Table 89: Global Cell Line Development Industry Revenue billion Forecast, by Source 2020 & 2033
- Table 90: Global Cell Line Development Industry Volume K Unit Forecast, by Source 2020 & 2033
- Table 91: Global Cell Line Development Industry Revenue billion Forecast, by Application 2020 & 2033
- Table 92: Global Cell Line Development Industry Volume K Unit Forecast, by Application 2020 & 2033
- Table 93: Global Cell Line Development Industry Revenue billion Forecast, by End User 2020 & 2033
- Table 94: Global Cell Line Development Industry Volume K Unit Forecast, by End User 2020 & 2033
- Table 95: Global Cell Line Development Industry Revenue billion Forecast, by Country 2020 & 2033
- Table 96: Global Cell Line Development Industry Volume K Unit Forecast, by Country 2020 & 2033
- Table 97: Brazil Cell Line Development Industry Revenue (billion) Forecast, by Application 2020 & 2033
- Table 98: Brazil Cell Line Development Industry Volume (K Unit) Forecast, by Application 2020 & 2033
- Table 99: Argentina Cell Line Development Industry Revenue (billion) Forecast, by Application 2020 & 2033
- Table 100: Argentina Cell Line Development Industry Volume (K Unit) Forecast, by Application 2020 & 2033
- Table 101: Rest of South America Cell Line Development Industry Revenue (billion) Forecast, by Application 2020 & 2033
- Table 102: Rest of South America Cell Line Development Industry Volume (K Unit) Forecast, by Application 2020 & 2033
Frequently Asked Questions
1. What is the projected Compound Annual Growth Rate (CAGR) of the Cell Line Development Industry?
The projected CAGR is approximately 6.4%.
2. Which companies are prominent players in the Cell Line Development Industry?
Key companies in the market include Promega Corporation, Merck KGaA, Sartorius AG, Danaher Corporation, Selexis SA, Fujifilm Corporation (Fujifilm Diosynth Biotechnologies), American Type Culture Collection (ATCC), WuXi Biologics, Thermo Fisher Scientific, Corning Incorporated.
3. What are the main segments of the Cell Line Development Industry?
The market segments include Product, Source, Application, End User.
4. Can you provide details about the market size?
The market size is estimated to be USD 4.2 billion as of 2022.
5. What are some drivers contributing to market growth?
Growing Biopharmaceutical Industry; Rising Demand for Monoclonal Antibodies and Cancer Therapeutics; Growing Production of Biosimilars Due to the Patent Expiry of Branded Therapeutics.
6. What are the notable trends driving market growth?
Mammalian Cell Line Development is Expected to Register Rapid Growth Over the Forecast Period.
7. Are there any restraints impacting market growth?
Strict Regulations; Time Taking Process.
8. Can you provide examples of recent developments in the market?
In July 2022, ProBioGen and Granite Bio Collaborate to Provide GMP Manufacturing and Cell Line Development Services. A novel monoclonal antibody developed by Granite Bio is the company's top contender for the treatment of autoimmune and specific cancer indications. By using the DirectedLuck transposase.
9. What pricing options are available for accessing the report?
Pricing options include single-user, multi-user, and enterprise licenses priced at USD 4750, USD 5250, and USD 8750 respectively.
10. Is the market size provided in terms of value or volume?
The market size is provided in terms of value, measured in billion and volume, measured in K Unit.
11. Are there any specific market keywords associated with the report?
Yes, the market keyword associated with the report is "Cell Line Development Industry," which aids in identifying and referencing the specific market segment covered.
12. How do I determine which pricing option suits my needs best?
The pricing options vary based on user requirements and access needs. Individual users may opt for single-user licenses, while businesses requiring broader access may choose multi-user or enterprise licenses for cost-effective access to the report.
13. Are there any additional resources or data provided in the Cell Line Development Industry report?
While the report offers comprehensive insights, it's advisable to review the specific contents or supplementary materials provided to ascertain if additional resources or data are available.
14. How can I stay updated on further developments or reports in the Cell Line Development Industry?
To stay informed about further developments, trends, and reports in the Cell Line Development Industry, consider subscribing to industry newsletters, following relevant companies and organizations, or regularly checking reputable industry news sources and publications.
Methodology
Step 1 - Identification of Relevant Samples Size from Population Database


Step 2 - Approaches for Defining Global Market Size (Value, Volume* & Price*)

Note*: In applicable scenarios
Step 3 - Data Sources
Primary Research
- Web Analytics
- Survey Reports
- Research Institute
- Latest Research Reports
- Opinion Leaders
Secondary Research
- Annual Reports
- White Paper
- Latest Press Release
- Industry Association
- Paid Database
- Investor Presentations

Step 4 - Data Triangulation
Involves using different sources of information in order to increase the validity of a study
These sources are likely to be stakeholders in a program - participants, other researchers, program staff, other community members, and so on.
Then we put all data in single framework & apply various statistical tools to find out the dynamic on the market.
During the analysis stage, feedback from the stakeholder groups would be compared to determine areas of agreement as well as areas of divergence