

Key Insights
The global cancer sequencing market is poised for significant expansion, driven by escalating cancer incidence, groundbreaking advancements in sequencing technologies, and the growing imperative for personalized medicine. The market is projected to achieve a Compound Annual Growth Rate (CAGR) of 17.3%. This robust growth is propelled by the widespread adoption of Next-Generation Sequencing (NGS) technologies, offering superior speed, accuracy, and cost-effectiveness over traditional methods. Continuous technological innovation is reducing sequencing costs, enhancing accessibility for applications in cancer diagnosis, prognosis, treatment selection, and patient monitoring. Global increases in cancer prevalence, coupled with rising healthcare expenditures, are further bolstering market expansion.
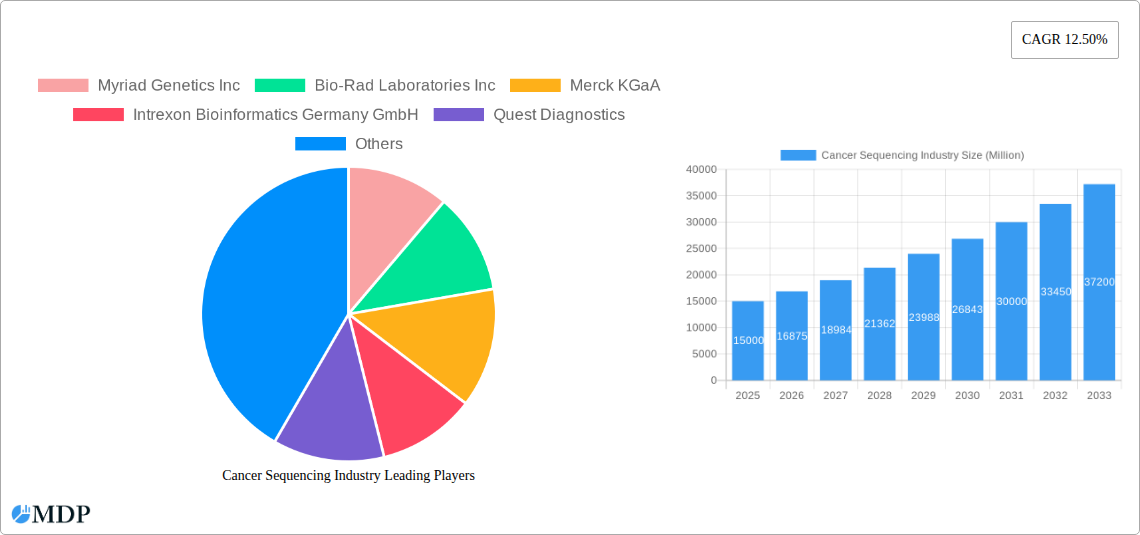
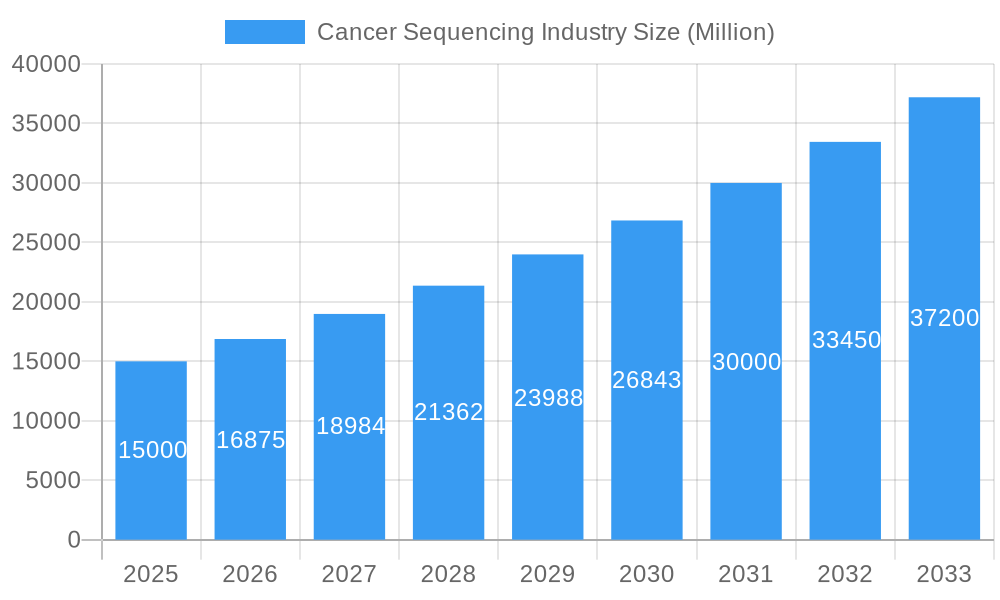
Cancer Sequencing Industry Market Size (In Million)
The market is segmented by technology (e.g., genome sequencing), product type (instruments, consumables, services), and geography. North America currently leads the market, attributed to its advanced healthcare infrastructure and high adoption rates of cutting-edge technologies. However, the Asia-Pacific region is expected to witness rapid growth, supported by increasing disposable incomes, heightened awareness of cancer screening and treatment, and supportive government initiatives.
Cancer Sequencing Industry Company Market Share
Key growth restraints include the high costs associated with sequencing and data analysis, stringent regulatory approvals, and ethical considerations regarding data privacy.
Despite these challenges, the long-term outlook for the cancer sequencing market remains exceptionally positive. The development of more efficient and affordable sequencing technologies, alongside the increasing integration of genomic data into clinical workflows, will sustain market expansion. The growing emphasis on personalized oncology, tailoring treatments to individual genetic profiles, is a major catalyst, promising more effective therapies and improved patient outcomes. The emergence of liquid biopsies and minimally invasive sampling techniques is also anticipated to boost market growth by simplifying testing and broadening accessibility.
Global Cancer Sequencing Market Report: Size, Trends, and Forecast (2025-2033)
This comprehensive report offers an in-depth analysis of the global cancer sequencing industry. It covers the period from 2019 to 2033, with a specific focus on the forecast period (2025-2033), utilizing 2025 as the base year. The report meticulously examines market dynamics, technological advancements, key players, and future growth opportunities within this dynamic sector. The current market size is estimated at 744.4 million.
Cancer Sequencing Industry Market Dynamics & Concentration
The cancer sequencing market is characterized by a dynamic interplay of factors influencing its growth and concentration. The market is moderately concentrated, with a few major players holding significant market share, while numerous smaller companies contribute to innovation and niche applications. The estimated market size in 2025 is valued at xx Million. The top five companies—Illumina Inc., ThermoFisher Scientific Inc., Roche, Qiagen NV, and Agilent Technologies Inc.—collectively hold an estimated xx% market share, indicating a degree of consolidation. However, continuous innovation and the entry of new players prevent complete market dominance by a few giants.
Several factors drive innovation within the market. These include:
- Technological advancements: Next-generation sequencing (NGS) technologies are constantly evolving, leading to increased speed, accuracy, and affordability of cancer sequencing.
- Regulatory landscape: Stringent regulatory frameworks and approvals influence market access and product development. Changes in these frameworks can significantly impact market growth.
- Product substitution: The emergence of new technologies and alternative diagnostic methods creates competitive pressures and necessitates continuous innovation to maintain market relevance.
- End-user trends: Growing awareness of cancer genetics and personalized medicine drives demand for cancer sequencing services. The preference for non-invasive testing also affects market trends.
- Mergers and acquisitions (M&A): The number of M&A activities in the cancer sequencing industry has been relatively high in recent years (xx deals in the past five years), indicative of consolidation and expansion strategies by leading players. This consolidation contributes to the concentration levels observed.
Cancer Sequencing Industry Industry Trends & Analysis
The cancer sequencing market exhibits strong growth potential, driven by several key factors. The global market is projected to reach xx Million by 2033, registering a CAGR of xx% during the forecast period. This growth is fueled by increasing cancer incidence globally, rising demand for personalized medicine, advancements in sequencing technologies, and increasing accessibility of genetic testing. Technological disruptions, such as the development of more cost-effective and faster sequencing platforms, are further accelerating market expansion. Consumer preferences are increasingly shifting towards non-invasive methods and faster turnaround times for results, driving innovation in sample preparation and data analysis. The competitive landscape is characterized by both intense competition and strategic collaborations, as companies strive to enhance their product offerings and expand market reach. Market penetration is rapidly increasing in developed regions, while emerging markets present significant growth opportunities. Specific trends influencing growth include:
- Increased adoption of NGS: NGS technologies are rapidly replacing traditional methods due to their higher throughput and lower cost.
- Growth of companion diagnostics: These tests help select patients most likely to benefit from specific cancer therapies.
- Expansion of liquid biopsies: Liquid biopsies offer minimally invasive alternatives to tissue biopsies for cancer detection and monitoring.
Leading Markets & Segments in Cancer Sequencing Industry
North America currently dominates the cancer sequencing market, driven by robust healthcare infrastructure, high awareness of advanced diagnostics, and extensive research activities. However, the Asia-Pacific region is experiencing rapid growth, fueled by increasing healthcare expenditure and growing adoption of advanced medical technologies. Within the technology segments, genome sequencing holds the largest market share, followed by microarray and PCR technologies. In terms of product type, the services segment is expanding rapidly due to the increasing demand for comprehensive cancer genomics services, including bioinformatics analysis and interpretation.
Key Drivers:
- North America: Robust healthcare infrastructure, high research funding, and early adoption of new technologies.
- Asia-Pacific: Rapidly growing healthcare sector, rising disposable income, and increased government initiatives to improve healthcare access.
- Europe: Growing investment in personalized medicine and advanced diagnostics, along with a strong regulatory framework.
Dominance Analysis:
Genome sequencing's dominance is due to its comprehensive nature and ability to identify a wider range of genomic alterations compared to other technologies. The services segment's strong growth reflects the increasing complexity of data analysis required for accurate diagnosis and treatment planning.
Cancer Sequencing Industry Product Developments
Recent product innovations focus on improving the speed, accuracy, and affordability of sequencing technologies. New instruments and consumables are being developed to enhance workflow efficiency and reduce turnaround times. The integration of artificial intelligence (AI) and machine learning (ML) algorithms into data analysis platforms enables faster and more accurate interpretation of genomic data. These advancements are improving the clinical utility of cancer sequencing, making it a more valuable tool for cancer diagnosis, prognosis, and treatment selection. The market is witnessing the development of portable and point-of-care sequencing devices, aiming to expand accessibility to underserved areas.
Key Drivers of Cancer Sequencing Industry Growth
Several key factors are driving the growth of the cancer sequencing industry:
- Technological advancements: Continuous improvements in sequencing technology are making it faster, cheaper, and more accurate.
- Rising cancer prevalence: The global burden of cancer continues to increase, driving demand for advanced diagnostic tools.
- Growing adoption of personalized medicine: Cancer sequencing is crucial for tailoring cancer treatment to individual patient needs.
- Increased healthcare spending: Higher investments in healthcare infrastructure and research are boosting the adoption of cancer sequencing technologies.
Challenges in the Cancer Sequencing Industry Market
The cancer sequencing industry faces several challenges:
- High cost of sequencing: The initial investment in equipment and consumables can be substantial, limiting accessibility.
- Complex data analysis: Interpreting genomic data requires sophisticated bioinformatics expertise and powerful computational resources.
- Regulatory hurdles: Obtaining regulatory approvals for new sequencing technologies and related diagnostic tests can be lengthy and complex.
- Data privacy and security concerns: Protecting the privacy and security of patient genomic data is crucial.
Emerging Opportunities in Cancer Sequencing Industry
Several emerging opportunities are poised to drive long-term growth:
- Advancements in liquid biopsy technologies: Non-invasive approaches offer significant advantages over tissue biopsies.
- Expansion into emerging markets: Untapped markets in developing countries represent significant growth potential.
- Integration with other "omics" technologies: Combining genomic data with proteomic and metabolomic data provides a more holistic view of cancer.
- Development of novel therapeutic targets: Cancer sequencing facilitates the identification of new drug targets for more effective cancer therapies.
Leading Players in the Cancer Sequencing Industry Sector
- Myriad Genetics Inc
- Bio-Rad Laboratories Inc
- Merck KGaA
- Intrexon Bioinformatics Germany GmbH
- Quest Diagnostics
- F Hoffmann-La Roche AG
- Agilent Technologies Inc
- Cancer Genetics Inc
- Luminex Corporation
- Qiagen NV
- Illumina Inc
- Pacific Biosciences of California Inc
- GE Healthcare (GE Company)
- Perkin Elmer
- ThermoFisher Scientific Inc
Key Milestones in Cancer Sequencing Industry Industry
- February 2023: Oxford Nanopore Technologies announced the extension of its collaboration with UPS Healthcare to accelerate the delivery of Oxford Nanopore DNA/RNA sequencing products and consumables across the Asia Pacific region. This significantly impacts market access and distribution in a rapidly growing market.
- August 2022: A research team from ACTREC developed the TMC-SNPdb2.0 genome toolkit, providing a valuable resource for analyzing cancer-specific gene mutations in the Indian population. This addresses a critical data gap and facilitates more accurate personalized medicine approaches within this large population.
Strategic Outlook for Cancer Sequencing Industry Market
The cancer sequencing market is poised for sustained growth, driven by continuous technological advancements, increasing adoption of personalized medicine, and the expansion of cancer screening programs. Strategic partnerships, acquisitions, and investments in research and development will play a crucial role in shaping the future of this dynamic industry. Companies focusing on innovation, cost-effectiveness, and improved data analysis capabilities are likely to gain a competitive edge. The growing focus on early cancer detection and liquid biopsy technologies will further fuel market expansion in the coming years.
Cancer Sequencing Industry Segmentation
-
1. Product Type
- 1.1. Instruments
- 1.2. Consumables
- 1.3. Services
-
2. Technology
- 2.1. PCR
- 2.2. MicroArrays
- 2.3. Genome Sequencing
Cancer Sequencing Industry Segmentation By Geography
-
1. North America
- 1.1. United States
- 1.2. Canada
- 1.3. Mexico
-
2. Europe
- 2.1. Germany
- 2.2. United Kingdom
- 2.3. France
- 2.4. Italy
- 2.5. Spain
- 2.6. Rest of Europe
-
3. Asia Pacific
- 3.1. China
- 3.2. Japan
- 3.3. India
- 3.4. Australia
- 3.5. South Korea
- 3.6. Rest of Asia Pacific
-
4. Middle East and Africa
- 4.1. GCC
- 4.2. South Africa
- 4.3. Rest of Middle East and Africa
-
5. South America
- 5.1. Brazil
- 5.2. Argentina
- 5.3. Rest of South America
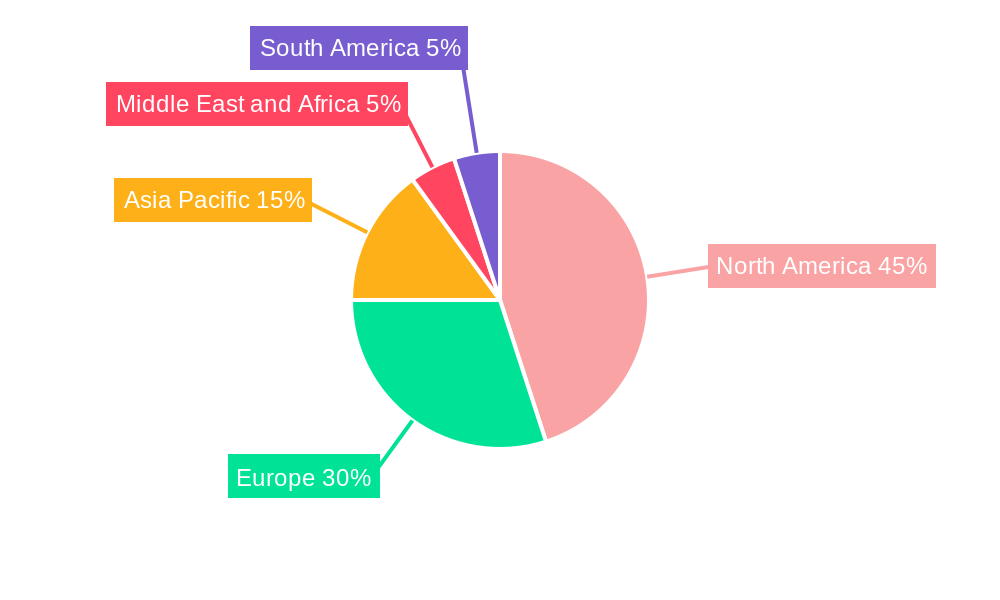
Cancer Sequencing Industry Regional Market Share
Geographic Coverage of Cancer Sequencing Industry
Cancer Sequencing Industry REPORT HIGHLIGHTS
| Aspects | Details |
|---|---|
| Study Period | 2020-2034 |
| Base Year | 2025 |
| Estimated Year | 2026 |
| Forecast Period | 2026-2034 |
| Historical Period | 2020-2025 |
| Growth Rate | CAGR of 17.3% from 2020-2034 |
| Segmentation |
|
Table of Contents
- 1. Introduction
- 1.1. Research Scope
- 1.2. Market Segmentation
- 1.3. Research Objective
- 1.4. Definitions and Assumptions
- 2. Executive Summary
- 2.1. Market Snapshot
- 3. Market Dynamics
- 3.1. Market Drivers
- 3.2. Market Restrains
- 3.3. Market Trends
- 3.4. Market Opportunities
- 4. Market Factor Analysis
- 4.1. Porters Five Forces
- 4.1.1. Bargaining Power of Suppliers
- 4.1.2. Bargaining Power of Buyers
- 4.1.3. Threat of New Entrants
- 4.1.4. Threat of Substitutes
- 4.1.5. Competitive Rivalry
- 4.2. PESTEL analysis
- 4.3. BCG Analysis
- 4.3.1. Stars (High Growth, High Market Share)
- 4.3.2. Cash Cows (Low Growth, High Market Share)
- 4.3.3. Question Mark (High Growth, Low Market Share)
- 4.3.4. Dogs (Low Growth, Low Market Share)
- 4.4. Ansoff Matrix Analysis
- 4.5. Supply Chain Analysis
- 4.6. Regulatory Landscape
- 4.7. Current Market Potential and Opportunity Assessment (TAM–SAM–SOM Framework)
- 4.8. MDP Analyst Note
- 4.1. Porters Five Forces
- 5. Market Analysis, Insights and Forecast 2021-2033
- 5.1. Market Analysis, Insights and Forecast - by Product Type
- 5.1.1. Instruments
- 5.1.2. Consumables
- 5.1.3. Services
- 5.2. Market Analysis, Insights and Forecast - by Technology
- 5.2.1. PCR
- 5.2.2. MicroArrays
- 5.2.3. Genome Sequencing
- 5.3. Market Analysis, Insights and Forecast - by Region
- 5.3.1. North America
- 5.3.2. Europe
- 5.3.3. Asia Pacific
- 5.3.4. Middle East and Africa
- 5.3.5. South America
- 5.1. Market Analysis, Insights and Forecast - by Product Type
- 6. Global Cancer Sequencing Industry Analysis, Insights and Forecast, 2021-2033
- 6.1. Market Analysis, Insights and Forecast - by Product Type
- 6.1.1. Instruments
- 6.1.2. Consumables
- 6.1.3. Services
- 6.2. Market Analysis, Insights and Forecast - by Technology
- 6.2.1. PCR
- 6.2.2. MicroArrays
- 6.2.3. Genome Sequencing
- 6.1. Market Analysis, Insights and Forecast - by Product Type
- 7. North America Cancer Sequencing Industry Analysis, Insights and Forecast, 2020-2032
- 7.1. Market Analysis, Insights and Forecast - by Product Type
- 7.1.1. Instruments
- 7.1.2. Consumables
- 7.1.3. Services
- 7.2. Market Analysis, Insights and Forecast - by Technology
- 7.2.1. PCR
- 7.2.2. MicroArrays
- 7.2.3. Genome Sequencing
- 7.1. Market Analysis, Insights and Forecast - by Product Type
- 8. Europe Cancer Sequencing Industry Analysis, Insights and Forecast, 2020-2032
- 8.1. Market Analysis, Insights and Forecast - by Product Type
- 8.1.1. Instruments
- 8.1.2. Consumables
- 8.1.3. Services
- 8.2. Market Analysis, Insights and Forecast - by Technology
- 8.2.1. PCR
- 8.2.2. MicroArrays
- 8.2.3. Genome Sequencing
- 8.1. Market Analysis, Insights and Forecast - by Product Type
- 9. Asia Pacific Cancer Sequencing Industry Analysis, Insights and Forecast, 2020-2032
- 9.1. Market Analysis, Insights and Forecast - by Product Type
- 9.1.1. Instruments
- 9.1.2. Consumables
- 9.1.3. Services
- 9.2. Market Analysis, Insights and Forecast - by Technology
- 9.2.1. PCR
- 9.2.2. MicroArrays
- 9.2.3. Genome Sequencing
- 9.1. Market Analysis, Insights and Forecast - by Product Type
- 10. Middle East and Africa Cancer Sequencing Industry Analysis, Insights and Forecast, 2020-2032
- 10.1. Market Analysis, Insights and Forecast - by Product Type
- 10.1.1. Instruments
- 10.1.2. Consumables
- 10.1.3. Services
- 10.2. Market Analysis, Insights and Forecast - by Technology
- 10.2.1. PCR
- 10.2.2. MicroArrays
- 10.2.3. Genome Sequencing
- 10.1. Market Analysis, Insights and Forecast - by Product Type
- 11. South America Cancer Sequencing Industry Analysis, Insights and Forecast, 2020-2032
- 11.1. Market Analysis, Insights and Forecast - by Product Type
- 11.1.1. Instruments
- 11.1.2. Consumables
- 11.1.3. Services
- 11.2. Market Analysis, Insights and Forecast - by Technology
- 11.2.1. PCR
- 11.2.2. MicroArrays
- 11.2.3. Genome Sequencing
- 11.1. Market Analysis, Insights and Forecast - by Product Type
- 12. Competitive Analysis
- 12.1. Company Profiles
- 12.1.1 Myriad Genetics Inc
- 12.1.1.1. Company Overview
- 12.1.1.2. Products
- 12.1.1.3. Company Financials
- 12.1.1.4. SWOT Analysis
- 12.1.2 Bio-Rad Laboratories Inc
- 12.1.2.1. Company Overview
- 12.1.2.2. Products
- 12.1.2.3. Company Financials
- 12.1.2.4. SWOT Analysis
- 12.1.3 Merck KGaA
- 12.1.3.1. Company Overview
- 12.1.3.2. Products
- 12.1.3.3. Company Financials
- 12.1.3.4. SWOT Analysis
- 12.1.4 Intrexon Bioinformatics Germany GmbH
- 12.1.4.1. Company Overview
- 12.1.4.2. Products
- 12.1.4.3. Company Financials
- 12.1.4.4. SWOT Analysis
- 12.1.5 Quest Diagnostics
- 12.1.5.1. Company Overview
- 12.1.5.2. Products
- 12.1.5.3. Company Financials
- 12.1.5.4. SWOT Analysis
- 12.1.6 F Hoffmann-La Roche AG
- 12.1.6.1. Company Overview
- 12.1.6.2. Products
- 12.1.6.3. Company Financials
- 12.1.6.4. SWOT Analysis
- 12.1.7 Agilent Technologies Inc
- 12.1.7.1. Company Overview
- 12.1.7.2. Products
- 12.1.7.3. Company Financials
- 12.1.7.4. SWOT Analysis
- 12.1.8 Cancer Genetics Inc
- 12.1.8.1. Company Overview
- 12.1.8.2. Products
- 12.1.8.3. Company Financials
- 12.1.8.4. SWOT Analysis
- 12.1.9 Luminex Corporation
- 12.1.9.1. Company Overview
- 12.1.9.2. Products
- 12.1.9.3. Company Financials
- 12.1.9.4. SWOT Analysis
- 12.1.10 Qiagen NV
- 12.1.10.1. Company Overview
- 12.1.10.2. Products
- 12.1.10.3. Company Financials
- 12.1.10.4. SWOT Analysis
- 12.1.11 Illumina Inc
- 12.1.11.1. Company Overview
- 12.1.11.2. Products
- 12.1.11.3. Company Financials
- 12.1.11.4. SWOT Analysis
- 12.1.12 Pacific Biosciences of California Inc
- 12.1.12.1. Company Overview
- 12.1.12.2. Products
- 12.1.12.3. Company Financials
- 12.1.12.4. SWOT Analysis
- 12.1.13 GE Healthcare (GE Company)
- 12.1.13.1. Company Overview
- 12.1.13.2. Products
- 12.1.13.3. Company Financials
- 12.1.13.4. SWOT Analysis
- 12.1.14 Perkin Elmer
- 12.1.14.1. Company Overview
- 12.1.14.2. Products
- 12.1.14.3. Company Financials
- 12.1.14.4. SWOT Analysis
- 12.1.15 ThermoFisher Scientific Inc
- 12.1.15.1. Company Overview
- 12.1.15.2. Products
- 12.1.15.3. Company Financials
- 12.1.15.4. SWOT Analysis
- 12.1.1 Myriad Genetics Inc
- 12.2. Market Entropy
- 12.2.1 Company's Key Areas Served
- 12.2.2 Recent Developments
- 12.3. Company Market Share Analysis 2025
- 12.3.1 Top 5 Companies Market Share Analysis
- 12.3.2 Top 3 Companies Market Share Analysis
- 12.4. List of Potential Customers
- 13. Research Methodology
List of Figures
- Figure 1: Global Cancer Sequencing Industry Revenue Breakdown (million, %) by Region 2025 & 2033
- Figure 2: Global Cancer Sequencing Industry Volume Breakdown (K Unit, %) by Region 2025 & 2033
- Figure 3: North America Cancer Sequencing Industry Revenue (million), by Product Type 2025 & 2033
- Figure 4: North America Cancer Sequencing Industry Volume (K Unit), by Product Type 2025 & 2033
- Figure 5: North America Cancer Sequencing Industry Revenue Share (%), by Product Type 2025 & 2033
- Figure 6: North America Cancer Sequencing Industry Volume Share (%), by Product Type 2025 & 2033
- Figure 7: North America Cancer Sequencing Industry Revenue (million), by Technology 2025 & 2033
- Figure 8: North America Cancer Sequencing Industry Volume (K Unit), by Technology 2025 & 2033
- Figure 9: North America Cancer Sequencing Industry Revenue Share (%), by Technology 2025 & 2033
- Figure 10: North America Cancer Sequencing Industry Volume Share (%), by Technology 2025 & 2033
- Figure 11: North America Cancer Sequencing Industry Revenue (million), by Country 2025 & 2033
- Figure 12: North America Cancer Sequencing Industry Volume (K Unit), by Country 2025 & 2033
- Figure 13: North America Cancer Sequencing Industry Revenue Share (%), by Country 2025 & 2033
- Figure 14: North America Cancer Sequencing Industry Volume Share (%), by Country 2025 & 2033
- Figure 15: Europe Cancer Sequencing Industry Revenue (million), by Product Type 2025 & 2033
- Figure 16: Europe Cancer Sequencing Industry Volume (K Unit), by Product Type 2025 & 2033
- Figure 17: Europe Cancer Sequencing Industry Revenue Share (%), by Product Type 2025 & 2033
- Figure 18: Europe Cancer Sequencing Industry Volume Share (%), by Product Type 2025 & 2033
- Figure 19: Europe Cancer Sequencing Industry Revenue (million), by Technology 2025 & 2033
- Figure 20: Europe Cancer Sequencing Industry Volume (K Unit), by Technology 2025 & 2033
- Figure 21: Europe Cancer Sequencing Industry Revenue Share (%), by Technology 2025 & 2033
- Figure 22: Europe Cancer Sequencing Industry Volume Share (%), by Technology 2025 & 2033
- Figure 23: Europe Cancer Sequencing Industry Revenue (million), by Country 2025 & 2033
- Figure 24: Europe Cancer Sequencing Industry Volume (K Unit), by Country 2025 & 2033
- Figure 25: Europe Cancer Sequencing Industry Revenue Share (%), by Country 2025 & 2033
- Figure 26: Europe Cancer Sequencing Industry Volume Share (%), by Country 2025 & 2033
- Figure 27: Asia Pacific Cancer Sequencing Industry Revenue (million), by Product Type 2025 & 2033
- Figure 28: Asia Pacific Cancer Sequencing Industry Volume (K Unit), by Product Type 2025 & 2033
- Figure 29: Asia Pacific Cancer Sequencing Industry Revenue Share (%), by Product Type 2025 & 2033
- Figure 30: Asia Pacific Cancer Sequencing Industry Volume Share (%), by Product Type 2025 & 2033
- Figure 31: Asia Pacific Cancer Sequencing Industry Revenue (million), by Technology 2025 & 2033
- Figure 32: Asia Pacific Cancer Sequencing Industry Volume (K Unit), by Technology 2025 & 2033
- Figure 33: Asia Pacific Cancer Sequencing Industry Revenue Share (%), by Technology 2025 & 2033
- Figure 34: Asia Pacific Cancer Sequencing Industry Volume Share (%), by Technology 2025 & 2033
- Figure 35: Asia Pacific Cancer Sequencing Industry Revenue (million), by Country 2025 & 2033
- Figure 36: Asia Pacific Cancer Sequencing Industry Volume (K Unit), by Country 2025 & 2033
- Figure 37: Asia Pacific Cancer Sequencing Industry Revenue Share (%), by Country 2025 & 2033
- Figure 38: Asia Pacific Cancer Sequencing Industry Volume Share (%), by Country 2025 & 2033
- Figure 39: Middle East and Africa Cancer Sequencing Industry Revenue (million), by Product Type 2025 & 2033
- Figure 40: Middle East and Africa Cancer Sequencing Industry Volume (K Unit), by Product Type 2025 & 2033
- Figure 41: Middle East and Africa Cancer Sequencing Industry Revenue Share (%), by Product Type 2025 & 2033
- Figure 42: Middle East and Africa Cancer Sequencing Industry Volume Share (%), by Product Type 2025 & 2033
- Figure 43: Middle East and Africa Cancer Sequencing Industry Revenue (million), by Technology 2025 & 2033
- Figure 44: Middle East and Africa Cancer Sequencing Industry Volume (K Unit), by Technology 2025 & 2033
- Figure 45: Middle East and Africa Cancer Sequencing Industry Revenue Share (%), by Technology 2025 & 2033
- Figure 46: Middle East and Africa Cancer Sequencing Industry Volume Share (%), by Technology 2025 & 2033
- Figure 47: Middle East and Africa Cancer Sequencing Industry Revenue (million), by Country 2025 & 2033
- Figure 48: Middle East and Africa Cancer Sequencing Industry Volume (K Unit), by Country 2025 & 2033
- Figure 49: Middle East and Africa Cancer Sequencing Industry Revenue Share (%), by Country 2025 & 2033
- Figure 50: Middle East and Africa Cancer Sequencing Industry Volume Share (%), by Country 2025 & 2033
- Figure 51: South America Cancer Sequencing Industry Revenue (million), by Product Type 2025 & 2033
- Figure 52: South America Cancer Sequencing Industry Volume (K Unit), by Product Type 2025 & 2033
- Figure 53: South America Cancer Sequencing Industry Revenue Share (%), by Product Type 2025 & 2033
- Figure 54: South America Cancer Sequencing Industry Volume Share (%), by Product Type 2025 & 2033
- Figure 55: South America Cancer Sequencing Industry Revenue (million), by Technology 2025 & 2033
- Figure 56: South America Cancer Sequencing Industry Volume (K Unit), by Technology 2025 & 2033
- Figure 57: South America Cancer Sequencing Industry Revenue Share (%), by Technology 2025 & 2033
- Figure 58: South America Cancer Sequencing Industry Volume Share (%), by Technology 2025 & 2033
- Figure 59: South America Cancer Sequencing Industry Revenue (million), by Country 2025 & 2033
- Figure 60: South America Cancer Sequencing Industry Volume (K Unit), by Country 2025 & 2033
- Figure 61: South America Cancer Sequencing Industry Revenue Share (%), by Country 2025 & 2033
- Figure 62: South America Cancer Sequencing Industry Volume Share (%), by Country 2025 & 2033
List of Tables
- Table 1: Global Cancer Sequencing Industry Revenue million Forecast, by Product Type 2020 & 2033
- Table 2: Global Cancer Sequencing Industry Volume K Unit Forecast, by Product Type 2020 & 2033
- Table 3: Global Cancer Sequencing Industry Revenue million Forecast, by Technology 2020 & 2033
- Table 4: Global Cancer Sequencing Industry Volume K Unit Forecast, by Technology 2020 & 2033
- Table 5: Global Cancer Sequencing Industry Revenue million Forecast, by Region 2020 & 2033
- Table 6: Global Cancer Sequencing Industry Volume K Unit Forecast, by Region 2020 & 2033
- Table 7: Global Cancer Sequencing Industry Revenue million Forecast, by Product Type 2020 & 2033
- Table 8: Global Cancer Sequencing Industry Volume K Unit Forecast, by Product Type 2020 & 2033
- Table 9: Global Cancer Sequencing Industry Revenue million Forecast, by Technology 2020 & 2033
- Table 10: Global Cancer Sequencing Industry Volume K Unit Forecast, by Technology 2020 & 2033
- Table 11: Global Cancer Sequencing Industry Revenue million Forecast, by Country 2020 & 2033
- Table 12: Global Cancer Sequencing Industry Volume K Unit Forecast, by Country 2020 & 2033
- Table 13: United States Cancer Sequencing Industry Revenue (million) Forecast, by Application 2020 & 2033
- Table 14: United States Cancer Sequencing Industry Volume (K Unit) Forecast, by Application 2020 & 2033
- Table 15: Canada Cancer Sequencing Industry Revenue (million) Forecast, by Application 2020 & 2033
- Table 16: Canada Cancer Sequencing Industry Volume (K Unit) Forecast, by Application 2020 & 2033
- Table 17: Mexico Cancer Sequencing Industry Revenue (million) Forecast, by Application 2020 & 2033
- Table 18: Mexico Cancer Sequencing Industry Volume (K Unit) Forecast, by Application 2020 & 2033
- Table 19: Global Cancer Sequencing Industry Revenue million Forecast, by Product Type 2020 & 2033
- Table 20: Global Cancer Sequencing Industry Volume K Unit Forecast, by Product Type 2020 & 2033
- Table 21: Global Cancer Sequencing Industry Revenue million Forecast, by Technology 2020 & 2033
- Table 22: Global Cancer Sequencing Industry Volume K Unit Forecast, by Technology 2020 & 2033
- Table 23: Global Cancer Sequencing Industry Revenue million Forecast, by Country 2020 & 2033
- Table 24: Global Cancer Sequencing Industry Volume K Unit Forecast, by Country 2020 & 2033
- Table 25: Germany Cancer Sequencing Industry Revenue (million) Forecast, by Application 2020 & 2033
- Table 26: Germany Cancer Sequencing Industry Volume (K Unit) Forecast, by Application 2020 & 2033
- Table 27: United Kingdom Cancer Sequencing Industry Revenue (million) Forecast, by Application 2020 & 2033
- Table 28: United Kingdom Cancer Sequencing Industry Volume (K Unit) Forecast, by Application 2020 & 2033
- Table 29: France Cancer Sequencing Industry Revenue (million) Forecast, by Application 2020 & 2033
- Table 30: France Cancer Sequencing Industry Volume (K Unit) Forecast, by Application 2020 & 2033
- Table 31: Italy Cancer Sequencing Industry Revenue (million) Forecast, by Application 2020 & 2033
- Table 32: Italy Cancer Sequencing Industry Volume (K Unit) Forecast, by Application 2020 & 2033
- Table 33: Spain Cancer Sequencing Industry Revenue (million) Forecast, by Application 2020 & 2033
- Table 34: Spain Cancer Sequencing Industry Volume (K Unit) Forecast, by Application 2020 & 2033
- Table 35: Rest of Europe Cancer Sequencing Industry Revenue (million) Forecast, by Application 2020 & 2033
- Table 36: Rest of Europe Cancer Sequencing Industry Volume (K Unit) Forecast, by Application 2020 & 2033
- Table 37: Global Cancer Sequencing Industry Revenue million Forecast, by Product Type 2020 & 2033
- Table 38: Global Cancer Sequencing Industry Volume K Unit Forecast, by Product Type 2020 & 2033
- Table 39: Global Cancer Sequencing Industry Revenue million Forecast, by Technology 2020 & 2033
- Table 40: Global Cancer Sequencing Industry Volume K Unit Forecast, by Technology 2020 & 2033
- Table 41: Global Cancer Sequencing Industry Revenue million Forecast, by Country 2020 & 2033
- Table 42: Global Cancer Sequencing Industry Volume K Unit Forecast, by Country 2020 & 2033
- Table 43: China Cancer Sequencing Industry Revenue (million) Forecast, by Application 2020 & 2033
- Table 44: China Cancer Sequencing Industry Volume (K Unit) Forecast, by Application 2020 & 2033
- Table 45: Japan Cancer Sequencing Industry Revenue (million) Forecast, by Application 2020 & 2033
- Table 46: Japan Cancer Sequencing Industry Volume (K Unit) Forecast, by Application 2020 & 2033
- Table 47: India Cancer Sequencing Industry Revenue (million) Forecast, by Application 2020 & 2033
- Table 48: India Cancer Sequencing Industry Volume (K Unit) Forecast, by Application 2020 & 2033
- Table 49: Australia Cancer Sequencing Industry Revenue (million) Forecast, by Application 2020 & 2033
- Table 50: Australia Cancer Sequencing Industry Volume (K Unit) Forecast, by Application 2020 & 2033
- Table 51: South Korea Cancer Sequencing Industry Revenue (million) Forecast, by Application 2020 & 2033
- Table 52: South Korea Cancer Sequencing Industry Volume (K Unit) Forecast, by Application 2020 & 2033
- Table 53: Rest of Asia Pacific Cancer Sequencing Industry Revenue (million) Forecast, by Application 2020 & 2033
- Table 54: Rest of Asia Pacific Cancer Sequencing Industry Volume (K Unit) Forecast, by Application 2020 & 2033
- Table 55: Global Cancer Sequencing Industry Revenue million Forecast, by Product Type 2020 & 2033
- Table 56: Global Cancer Sequencing Industry Volume K Unit Forecast, by Product Type 2020 & 2033
- Table 57: Global Cancer Sequencing Industry Revenue million Forecast, by Technology 2020 & 2033
- Table 58: Global Cancer Sequencing Industry Volume K Unit Forecast, by Technology 2020 & 2033
- Table 59: Global Cancer Sequencing Industry Revenue million Forecast, by Country 2020 & 2033
- Table 60: Global Cancer Sequencing Industry Volume K Unit Forecast, by Country 2020 & 2033
- Table 61: GCC Cancer Sequencing Industry Revenue (million) Forecast, by Application 2020 & 2033
- Table 62: GCC Cancer Sequencing Industry Volume (K Unit) Forecast, by Application 2020 & 2033
- Table 63: South Africa Cancer Sequencing Industry Revenue (million) Forecast, by Application 2020 & 2033
- Table 64: South Africa Cancer Sequencing Industry Volume (K Unit) Forecast, by Application 2020 & 2033
- Table 65: Rest of Middle East and Africa Cancer Sequencing Industry Revenue (million) Forecast, by Application 2020 & 2033
- Table 66: Rest of Middle East and Africa Cancer Sequencing Industry Volume (K Unit) Forecast, by Application 2020 & 2033
- Table 67: Global Cancer Sequencing Industry Revenue million Forecast, by Product Type 2020 & 2033
- Table 68: Global Cancer Sequencing Industry Volume K Unit Forecast, by Product Type 2020 & 2033
- Table 69: Global Cancer Sequencing Industry Revenue million Forecast, by Technology 2020 & 2033
- Table 70: Global Cancer Sequencing Industry Volume K Unit Forecast, by Technology 2020 & 2033
- Table 71: Global Cancer Sequencing Industry Revenue million Forecast, by Country 2020 & 2033
- Table 72: Global Cancer Sequencing Industry Volume K Unit Forecast, by Country 2020 & 2033
- Table 73: Brazil Cancer Sequencing Industry Revenue (million) Forecast, by Application 2020 & 2033
- Table 74: Brazil Cancer Sequencing Industry Volume (K Unit) Forecast, by Application 2020 & 2033
- Table 75: Argentina Cancer Sequencing Industry Revenue (million) Forecast, by Application 2020 & 2033
- Table 76: Argentina Cancer Sequencing Industry Volume (K Unit) Forecast, by Application 2020 & 2033
- Table 77: Rest of South America Cancer Sequencing Industry Revenue (million) Forecast, by Application 2020 & 2033
- Table 78: Rest of South America Cancer Sequencing Industry Volume (K Unit) Forecast, by Application 2020 & 2033
Frequently Asked Questions
1. What is the projected Compound Annual Growth Rate (CAGR) of the Cancer Sequencing Industry?
The projected CAGR is approximately 17.3%.
2. Which companies are prominent players in the Cancer Sequencing Industry?
Key companies in the market include Myriad Genetics Inc, Bio-Rad Laboratories Inc, Merck KGaA, Intrexon Bioinformatics Germany GmbH, Quest Diagnostics, F Hoffmann-La Roche AG, Agilent Technologies Inc, Cancer Genetics Inc, Luminex Corporation, Qiagen NV, Illumina Inc, Pacific Biosciences of California Inc, GE Healthcare (GE Company), Perkin Elmer, ThermoFisher Scientific Inc.
3. What are the main segments of the Cancer Sequencing Industry?
The market segments include Product Type, Technology.
4. Can you provide details about the market size?
The market size is estimated to be USD 744.4 million as of 2022.
5. What are some drivers contributing to market growth?
Growing Burden of Cancer; Initiatives taken by Companies in Product Development; Speed. Accuracy and Potential Replacement for Traditional Technologies to Spur Market Growth.
6. What are the notable trends driving market growth?
Genome Sequencing Segment is Expected to Hold a Major Market Share.
7. Are there any restraints impacting market growth?
Interpretation of Complex Data and Lack of Skilled Professionals; High Cost of Instruments and Procedures.
8. Can you provide examples of recent developments in the market?
February 2023: Oxford Nanopore Technologies announced the extension of its collaboration with UPS Healthcare to accelerate the delivery of Oxford Nanopore DNA/RNA sequencing products and consumables across the Asia Pacific region.
9. What pricing options are available for accessing the report?
Pricing options include single-user, multi-user, and enterprise licenses priced at USD 4750, USD 5250, and USD 8750 respectively.
10. Is the market size provided in terms of value or volume?
The market size is provided in terms of value, measured in million and volume, measured in K Unit.
11. Are there any specific market keywords associated with the report?
Yes, the market keyword associated with the report is "Cancer Sequencing Industry," which aids in identifying and referencing the specific market segment covered.
12. How do I determine which pricing option suits my needs best?
The pricing options vary based on user requirements and access needs. Individual users may opt for single-user licenses, while businesses requiring broader access may choose multi-user or enterprise licenses for cost-effective access to the report.
13. Are there any additional resources or data provided in the Cancer Sequencing Industry report?
While the report offers comprehensive insights, it's advisable to review the specific contents or supplementary materials provided to ascertain if additional resources or data are available.
14. How can I stay updated on further developments or reports in the Cancer Sequencing Industry?
To stay informed about further developments, trends, and reports in the Cancer Sequencing Industry, consider subscribing to industry newsletters, following relevant companies and organizations, or regularly checking reputable industry news sources and publications.
Methodology
Step 1 - Identification of Relevant Samples Size from Population Database


Step 2 - Approaches for Defining Global Market Size (Value, Volume* & Price*)

Note*: In applicable scenarios
Step 3 - Data Sources
Primary Research
- Web Analytics
- Survey Reports
- Research Institute
- Latest Research Reports
- Opinion Leaders
Secondary Research
- Annual Reports
- White Paper
- Latest Press Release
- Industry Association
- Paid Database
- Investor Presentations

Step 4 - Data Triangulation
Involves using different sources of information in order to increase the validity of a study
These sources are likely to be stakeholders in a program - participants, other researchers, program staff, other community members, and so on.
Then we put all data in single framework & apply various statistical tools to find out the dynamic on the market.
During the analysis stage, feedback from the stakeholder groups would be compared to determine areas of agreement as well as areas of divergence