

Key Insights
The global bottled water market, estimated at 353.61 billion in 2025, is projected to grow at a compound annual growth rate (CAGR) of 5.3% from 2025 to 2033. This expansion is driven by increasing consumer health consciousness, favoring healthier hydration options like functional waters. Growing active lifestyles and rising disposable incomes in emerging economies further fuel demand. The convenience of on-the-go consumption and widespread availability across retail channels and online platforms are significant contributors. While challenges such as fluctuating raw material prices and environmental concerns persist, innovative packaging and sustainable sourcing practices are mitigating these. Still water dominates, but functional waters exhibit the fastest growth, indicating a trend towards value-added products. North America and Europe lead, with Asia-Pacific offering substantial growth potential due to its large population and growing middle class. Key players are strategically investing in product diversification, brand building, and distribution expansion.
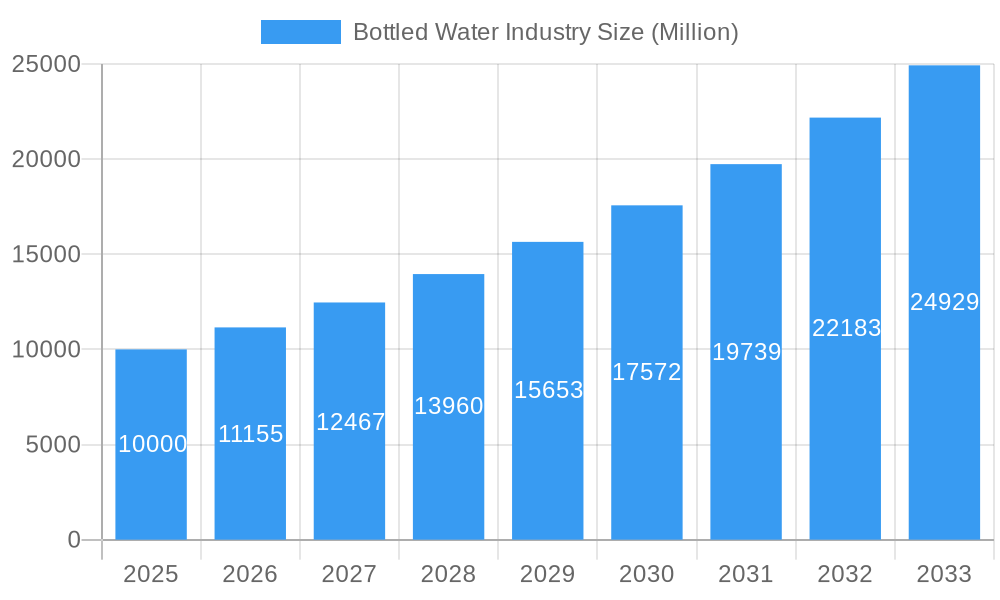
Bottled Water Industry Market Size (In Billion)
The competitive bottled water market features dynamic strategies including acquisitions, mergers, and new product launches. Product innovation, focusing on new flavors, enhanced functional benefits, and sustainable packaging, is critical. Effective marketing campaigns emphasizing health and lifestyle associations are vital for brand building and market penetration. The market is segmented by product type (still, sparkling, functional), distribution channel (supermarkets, convenience stores, online, on-trade), and geography (North America, Europe, Asia-Pacific, South America, Middle East & Africa). Future growth will be shaped by evolving consumer preferences, technological advancements, and regulatory landscapes concerning plastic waste and water sourcing. Sustainable practices and innovative product development are paramount for sustained success in this competitive and evolving market.
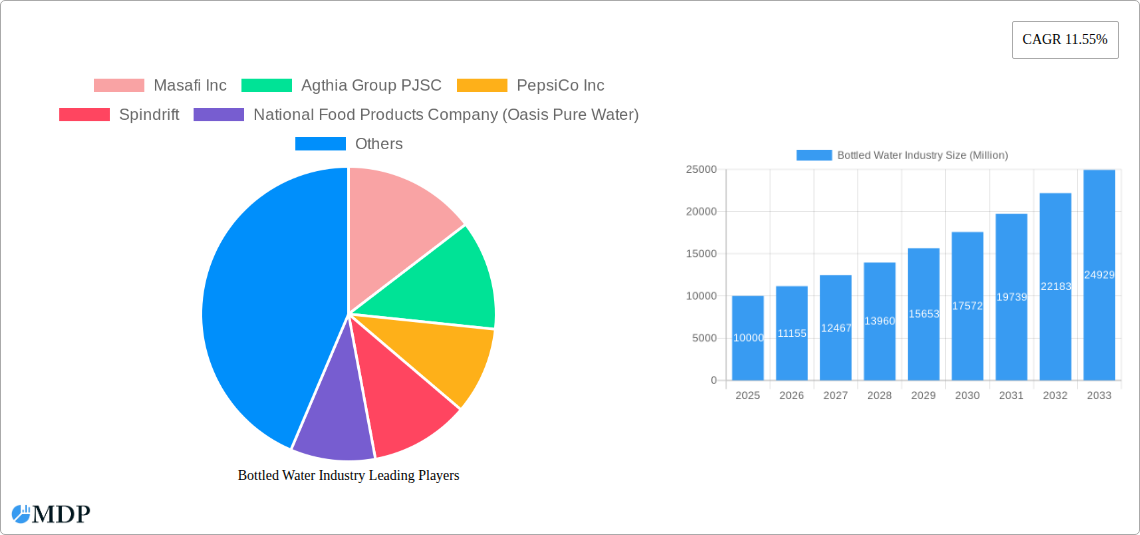
Bottled Water Industry Company Market Share
Bottled Water Industry: Market Report 2019-2033
This comprehensive report provides an in-depth analysis of the bottled water industry, forecasting market trends and opportunities from 2019 to 2033. With a focus on key players like Masafi Inc, Agthia Group PJSC, PepsiCo Inc, and Nestlé S.A., this report is essential for industry stakeholders, investors, and strategic decision-makers. The report analyzes market dynamics, leading segments, and emerging opportunities, providing actionable insights for navigating this dynamic sector. The base year for this report is 2025, with estimations for 2025 and forecasts extending to 2033, covering the historical period of 2019-2024. The market size is projected to reach xx Million by 2033.
Bottled Water Industry Market Dynamics & Concentration
The bottled water market is characterized by a mix of large multinational corporations and regional players. Market concentration is moderate, with the top five players holding an estimated xx% market share in 2025. Innovation is a key driver, with companies constantly introducing new product formats, flavors, and sustainable packaging options. Regulatory frameworks, particularly regarding plastic waste and water sourcing, significantly influence market dynamics. The industry faces competition from substitutes like tap water and other beverages. End-user trends, including health consciousness and preference for functional waters, shape demand. Mergers and acquisitions (M&A) activity has been significant, with xx M&A deals recorded between 2019 and 2024.
- Market Concentration: Top 5 players hold xx% market share (2025 est.)
- Innovation Drivers: Sustainable packaging, functional waters, new flavors.
- Regulatory Framework: Plastic waste regulations, water sourcing standards.
- Product Substitutes: Tap water, other beverages.
- End-User Trends: Health consciousness, demand for functional benefits.
- M&A Activity: xx deals (2019-2024)
Bottled Water Industry Industry Trends & Analysis
The bottled water market is experiencing robust growth, with a Compound Annual Growth Rate (CAGR) of xx% projected from 2025 to 2033. This growth is fueled by several factors: rising disposable incomes, increasing health awareness, urbanization, and changing consumer lifestyles. Technological disruptions, particularly in packaging and production, are enhancing efficiency and sustainability. Consumer preferences are shifting towards healthier options, including functional waters enriched with vitamins and minerals. Competitive dynamics are intense, with companies focusing on brand building, product differentiation, and strategic partnerships. Market penetration for bottled water is estimated at xx% in 2025, projected to reach xx% by 2033.
Leading Markets & Segments in Bottled Water Industry
The Middle East and North Africa (MENA) region is a leading market for bottled water, driven by high temperatures and limited access to safe tap water in some areas. Within the MENA region, the UAE and Saudi Arabia are dominant.
- Dominant Region: Middle East and North Africa (MENA)
- Dominant Countries: UAE, Saudi Arabia
- Leading Segment (Type): Still water maintains the largest market share.
- Leading Segment (Distribution): Supermarkets and hypermarkets dominate distribution channels.
Key Drivers:
- Economic growth: Rising disposable incomes increase purchasing power.
- Climate: High temperatures and limited access to safe tap water.
- Infrastructure: Well-developed retail infrastructure supports distribution.
Bottled Water Industry Product Developments
Recent product innovations focus on sustainability, convenience, and functional benefits. Companies are introducing plant-based bottles, biodegradable packaging, and water infused with electrolytes or vitamins. These innovations aim to appeal to health-conscious consumers and address environmental concerns. The market is seeing a clear trend towards smaller, more convenient packaging sizes.
Key Drivers of Bottled Water Industry Growth
Several factors contribute to the growth of the bottled water industry: rising disposable incomes globally, particularly in developing economies; increased health consciousness and a preference for healthier beverage options; the convenience factor of ready-to-consume bottled water; and expanding retail infrastructure in emerging markets. Government regulations aimed at improving water quality and safety also contribute positively. Technological advancements, like efficient production methods and innovative packaging solutions, play a vital role.
Challenges in the Bottled Water Industry Market
The bottled water industry faces several challenges, including rising raw material costs (plastic resins), fluctuating energy prices, and growing environmental concerns related to plastic waste. Stricter regulations regarding plastic usage and water sourcing impact production costs. Intense competition among established brands and new entrants creates pricing pressure and necessitates continuous innovation. Supply chain disruptions can impact the availability of raw materials and finished products.
Emerging Opportunities in Bottled Water Industry
The bottled water industry presents substantial opportunities for growth. Technological advancements in water purification and packaging offer scope for improved efficiency and sustainability. Strategic partnerships with distributors and retailers can improve market reach. Expansion into new markets, particularly in developing economies with growing middle classes, presents significant potential. Innovations in functional waters, targeting specific health needs, open new avenues for product differentiation.
Leading Players in the Bottled Water Industry Sector
- Masafi Inc
- Agthia Group PJSC
- PepsiCo Inc
- Spindrift
- National Food Products Company (Oasis Pure Water)
- AL Ghadeer Drinking Water LLC
- Hint Inc
- Mai Dubai
- Dubai Crystal Mineral Water & Refreshments L L C Co
- Nestlé S.A
Key Milestones in Bottled Water Industry Industry
- February 2020: Agthia Group PJSC (Al Ain) introduced 100% plant-based water bottles.
- April 2020: National Food Products Company launched the first boxed drinking water in Tetra Pak.
- May 2021: Agthia Group PJSC acquired Nabil Foods, expanding its water portfolio.
- September 2021: Masafi Inc. launched "Source," a sustainable water bottle.
Strategic Outlook for Bottled Water Industry Market
The bottled water market presents significant growth potential driven by increasing health awareness, sustainability concerns, and evolving consumer preferences. Companies that invest in innovative packaging solutions, functional water formulations, and sustainable sourcing practices will be best positioned to capitalize on this potential. Strategic partnerships, effective marketing strategies, and expansion into new markets will further enhance market leadership and profitability.
Bottled Water Industry Segmentation
-
1. Type
- 1.1. Still Water
- 1.2. Sparkling Water
- 1.3. Functional Water
-
2. Distribution Channel
- 2.1. Supermarkets and Hypermarkets
- 2.2. Convenience Stores
- 2.3. Home and Office Delivery
- 2.4. On-trade
- 2.5. Other Distribution Channels
Bottled Water Industry Segmentation By Geography
-
1. North America
- 1.1. United States
- 1.2. Canada
- 1.3. Mexico
-
2. South America
- 2.1. Brazil
- 2.2. Argentina
- 2.3. Rest of South America
-
3. Europe
- 3.1. United Kingdom
- 3.2. Germany
- 3.3. France
- 3.4. Italy
- 3.5. Spain
- 3.6. Russia
- 3.7. Benelux
- 3.8. Nordics
- 3.9. Rest of Europe
-
4. Middle East & Africa
- 4.1. Turkey
- 4.2. Israel
- 4.3. GCC
- 4.4. North Africa
- 4.5. South Africa
- 4.6. Rest of Middle East & Africa
-
5. Asia Pacific
- 5.1. China
- 5.2. India
- 5.3. Japan
- 5.4. South Korea
- 5.5. ASEAN
- 5.6. Oceania
- 5.7. Rest of Asia Pacific
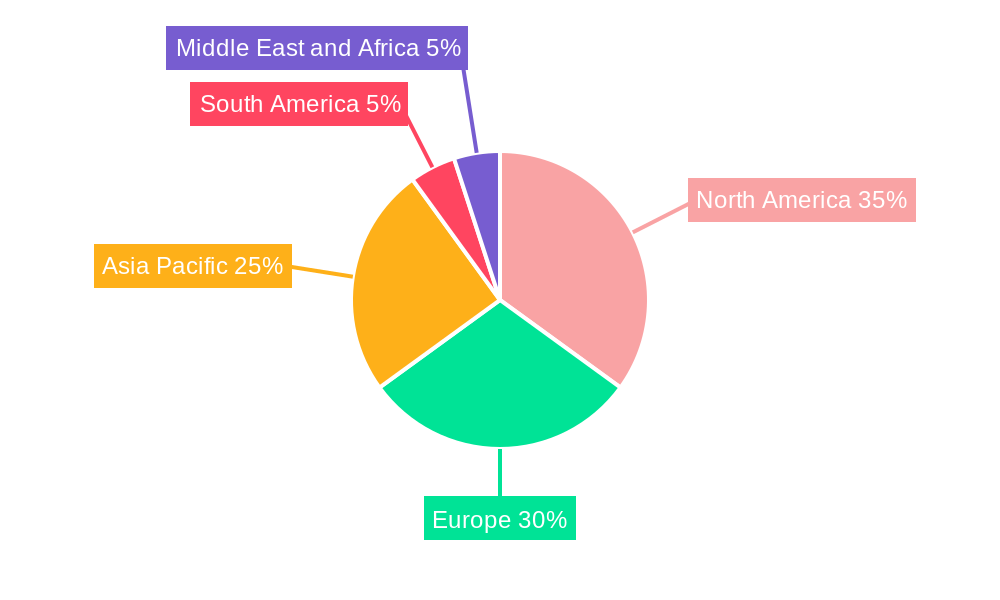
Bottled Water Industry Regional Market Share
Geographic Coverage of Bottled Water Industry
Bottled Water Industry REPORT HIGHLIGHTS
| Aspects | Details |
|---|---|
| Study Period | 2020-2034 |
| Base Year | 2025 |
| Estimated Year | 2026 |
| Forecast Period | 2026-2034 |
| Historical Period | 2020-2025 |
| Growth Rate | CAGR of 5.3% from 2020-2034 |
| Segmentation |
|
Table of Contents
- 1. Introduction
- 1.1. Research Scope
- 1.2. Market Segmentation
- 1.3. Research Objective
- 1.4. Definitions and Assumptions
- 2. Executive Summary
- 2.1. Market Snapshot
- 3. Market Dynamics
- 3.1. Market Drivers
- 3.2. Market Restrains
- 3.3. Market Trends
- 3.4. Market Opportunities
- 4. Market Factor Analysis
- 4.1. Porters Five Forces
- 4.1.1. Bargaining Power of Suppliers
- 4.1.2. Bargaining Power of Buyers
- 4.1.3. Threat of New Entrants
- 4.1.4. Threat of Substitutes
- 4.1.5. Competitive Rivalry
- 4.2. PESTEL analysis
- 4.3. BCG Analysis
- 4.3.1. Stars (High Growth, High Market Share)
- 4.3.2. Cash Cows (Low Growth, High Market Share)
- 4.3.3. Question Mark (High Growth, Low Market Share)
- 4.3.4. Dogs (Low Growth, Low Market Share)
- 4.4. Ansoff Matrix Analysis
- 4.5. Supply Chain Analysis
- 4.6. Regulatory Landscape
- 4.7. Current Market Potential and Opportunity Assessment (TAM–SAM–SOM Framework)
- 4.8. MDP Analyst Note
- 4.1. Porters Five Forces
- 5. Market Analysis, Insights and Forecast 2021-2033
- 5.1. Market Analysis, Insights and Forecast - by Type
- 5.1.1. Still Water
- 5.1.2. Sparkling Water
- 5.1.3. Functional Water
- 5.2. Market Analysis, Insights and Forecast - by Distribution Channel
- 5.2.1. Supermarkets and Hypermarkets
- 5.2.2. Convenience Stores
- 5.2.3. Home and Office Delivery
- 5.2.4. On-trade
- 5.2.5. Other Distribution Channels
- 5.3. Market Analysis, Insights and Forecast - by Region
- 5.3.1. North America
- 5.3.2. South America
- 5.3.3. Europe
- 5.3.4. Middle East & Africa
- 5.3.5. Asia Pacific
- 5.1. Market Analysis, Insights and Forecast - by Type
- 6. Global Bottled Water Industry Analysis, Insights and Forecast, 2021-2033
- 6.1. Market Analysis, Insights and Forecast - by Type
- 6.1.1. Still Water
- 6.1.2. Sparkling Water
- 6.1.3. Functional Water
- 6.2. Market Analysis, Insights and Forecast - by Distribution Channel
- 6.2.1. Supermarkets and Hypermarkets
- 6.2.2. Convenience Stores
- 6.2.3. Home and Office Delivery
- 6.2.4. On-trade
- 6.2.5. Other Distribution Channels
- 6.1. Market Analysis, Insights and Forecast - by Type
- 7. North America Bottled Water Industry Analysis, Insights and Forecast, 2020-2032
- 7.1. Market Analysis, Insights and Forecast - by Type
- 7.1.1. Still Water
- 7.1.2. Sparkling Water
- 7.1.3. Functional Water
- 7.2. Market Analysis, Insights and Forecast - by Distribution Channel
- 7.2.1. Supermarkets and Hypermarkets
- 7.2.2. Convenience Stores
- 7.2.3. Home and Office Delivery
- 7.2.4. On-trade
- 7.2.5. Other Distribution Channels
- 7.1. Market Analysis, Insights and Forecast - by Type
- 8. South America Bottled Water Industry Analysis, Insights and Forecast, 2020-2032
- 8.1. Market Analysis, Insights and Forecast - by Type
- 8.1.1. Still Water
- 8.1.2. Sparkling Water
- 8.1.3. Functional Water
- 8.2. Market Analysis, Insights and Forecast - by Distribution Channel
- 8.2.1. Supermarkets and Hypermarkets
- 8.2.2. Convenience Stores
- 8.2.3. Home and Office Delivery
- 8.2.4. On-trade
- 8.2.5. Other Distribution Channels
- 8.1. Market Analysis, Insights and Forecast - by Type
- 9. Europe Bottled Water Industry Analysis, Insights and Forecast, 2020-2032
- 9.1. Market Analysis, Insights and Forecast - by Type
- 9.1.1. Still Water
- 9.1.2. Sparkling Water
- 9.1.3. Functional Water
- 9.2. Market Analysis, Insights and Forecast - by Distribution Channel
- 9.2.1. Supermarkets and Hypermarkets
- 9.2.2. Convenience Stores
- 9.2.3. Home and Office Delivery
- 9.2.4. On-trade
- 9.2.5. Other Distribution Channels
- 9.1. Market Analysis, Insights and Forecast - by Type
- 10. Middle East & Africa Bottled Water Industry Analysis, Insights and Forecast, 2020-2032
- 10.1. Market Analysis, Insights and Forecast - by Type
- 10.1.1. Still Water
- 10.1.2. Sparkling Water
- 10.1.3. Functional Water
- 10.2. Market Analysis, Insights and Forecast - by Distribution Channel
- 10.2.1. Supermarkets and Hypermarkets
- 10.2.2. Convenience Stores
- 10.2.3. Home and Office Delivery
- 10.2.4. On-trade
- 10.2.5. Other Distribution Channels
- 10.1. Market Analysis, Insights and Forecast - by Type
- 11. Asia Pacific Bottled Water Industry Analysis, Insights and Forecast, 2020-2032
- 11.1. Market Analysis, Insights and Forecast - by Type
- 11.1.1. Still Water
- 11.1.2. Sparkling Water
- 11.1.3. Functional Water
- 11.2. Market Analysis, Insights and Forecast - by Distribution Channel
- 11.2.1. Supermarkets and Hypermarkets
- 11.2.2. Convenience Stores
- 11.2.3. Home and Office Delivery
- 11.2.4. On-trade
- 11.2.5. Other Distribution Channels
- 11.1. Market Analysis, Insights and Forecast - by Type
- 12. Competitive Analysis
- 12.1. Company Profiles
- 12.1.1 Masafi Inc
- 12.1.1.1. Company Overview
- 12.1.1.2. Products
- 12.1.1.3. Company Financials
- 12.1.1.4. SWOT Analysis
- 12.1.2 Agthia Group PJSC
- 12.1.2.1. Company Overview
- 12.1.2.2. Products
- 12.1.2.3. Company Financials
- 12.1.2.4. SWOT Analysis
- 12.1.3 PepsiCo Inc
- 12.1.3.1. Company Overview
- 12.1.3.2. Products
- 12.1.3.3. Company Financials
- 12.1.3.4. SWOT Analysis
- 12.1.4 Spindrift
- 12.1.4.1. Company Overview
- 12.1.4.2. Products
- 12.1.4.3. Company Financials
- 12.1.4.4. SWOT Analysis
- 12.1.5 National Food Products Company (Oasis Pure Water)
- 12.1.5.1. Company Overview
- 12.1.5.2. Products
- 12.1.5.3. Company Financials
- 12.1.5.4. SWOT Analysis
- 12.1.6 AL Ghadeer Drinking Water LLC
- 12.1.6.1. Company Overview
- 12.1.6.2. Products
- 12.1.6.3. Company Financials
- 12.1.6.4. SWOT Analysis
- 12.1.7 Hint Inc
- 12.1.7.1. Company Overview
- 12.1.7.2. Products
- 12.1.7.3. Company Financials
- 12.1.7.4. SWOT Analysis
- 12.1.8 Mai Dubai*List Not Exhaustive
- 12.1.8.1. Company Overview
- 12.1.8.2. Products
- 12.1.8.3. Company Financials
- 12.1.8.4. SWOT Analysis
- 12.1.9 Dubai Crystal Mineral Water & Refreshments L L C Co
- 12.1.9.1. Company Overview
- 12.1.9.2. Products
- 12.1.9.3. Company Financials
- 12.1.9.4. SWOT Analysis
- 12.1.10 Nestlé S A
- 12.1.10.1. Company Overview
- 12.1.10.2. Products
- 12.1.10.3. Company Financials
- 12.1.10.4. SWOT Analysis
- 12.1.1 Masafi Inc
- 12.2. Market Entropy
- 12.2.1 Company's Key Areas Served
- 12.2.2 Recent Developments
- 12.3. Company Market Share Analysis 2025
- 12.3.1 Top 5 Companies Market Share Analysis
- 12.3.2 Top 3 Companies Market Share Analysis
- 12.4. List of Potential Customers
- 13. Research Methodology
List of Figures
- Figure 1: Global Bottled Water Industry Revenue Breakdown (billion, %) by Region 2025 & 2033
- Figure 2: North America Bottled Water Industry Revenue (billion), by Type 2025 & 2033
- Figure 3: North America Bottled Water Industry Revenue Share (%), by Type 2025 & 2033
- Figure 4: North America Bottled Water Industry Revenue (billion), by Distribution Channel 2025 & 2033
- Figure 5: North America Bottled Water Industry Revenue Share (%), by Distribution Channel 2025 & 2033
- Figure 6: North America Bottled Water Industry Revenue (billion), by Country 2025 & 2033
- Figure 7: North America Bottled Water Industry Revenue Share (%), by Country 2025 & 2033
- Figure 8: South America Bottled Water Industry Revenue (billion), by Type 2025 & 2033
- Figure 9: South America Bottled Water Industry Revenue Share (%), by Type 2025 & 2033
- Figure 10: South America Bottled Water Industry Revenue (billion), by Distribution Channel 2025 & 2033
- Figure 11: South America Bottled Water Industry Revenue Share (%), by Distribution Channel 2025 & 2033
- Figure 12: South America Bottled Water Industry Revenue (billion), by Country 2025 & 2033
- Figure 13: South America Bottled Water Industry Revenue Share (%), by Country 2025 & 2033
- Figure 14: Europe Bottled Water Industry Revenue (billion), by Type 2025 & 2033
- Figure 15: Europe Bottled Water Industry Revenue Share (%), by Type 2025 & 2033
- Figure 16: Europe Bottled Water Industry Revenue (billion), by Distribution Channel 2025 & 2033
- Figure 17: Europe Bottled Water Industry Revenue Share (%), by Distribution Channel 2025 & 2033
- Figure 18: Europe Bottled Water Industry Revenue (billion), by Country 2025 & 2033
- Figure 19: Europe Bottled Water Industry Revenue Share (%), by Country 2025 & 2033
- Figure 20: Middle East & Africa Bottled Water Industry Revenue (billion), by Type 2025 & 2033
- Figure 21: Middle East & Africa Bottled Water Industry Revenue Share (%), by Type 2025 & 2033
- Figure 22: Middle East & Africa Bottled Water Industry Revenue (billion), by Distribution Channel 2025 & 2033
- Figure 23: Middle East & Africa Bottled Water Industry Revenue Share (%), by Distribution Channel 2025 & 2033
- Figure 24: Middle East & Africa Bottled Water Industry Revenue (billion), by Country 2025 & 2033
- Figure 25: Middle East & Africa Bottled Water Industry Revenue Share (%), by Country 2025 & 2033
- Figure 26: Asia Pacific Bottled Water Industry Revenue (billion), by Type 2025 & 2033
- Figure 27: Asia Pacific Bottled Water Industry Revenue Share (%), by Type 2025 & 2033
- Figure 28: Asia Pacific Bottled Water Industry Revenue (billion), by Distribution Channel 2025 & 2033
- Figure 29: Asia Pacific Bottled Water Industry Revenue Share (%), by Distribution Channel 2025 & 2033
- Figure 30: Asia Pacific Bottled Water Industry Revenue (billion), by Country 2025 & 2033
- Figure 31: Asia Pacific Bottled Water Industry Revenue Share (%), by Country 2025 & 2033
List of Tables
- Table 1: Global Bottled Water Industry Revenue billion Forecast, by Type 2020 & 2033
- Table 2: Global Bottled Water Industry Revenue billion Forecast, by Distribution Channel 2020 & 2033
- Table 3: Global Bottled Water Industry Revenue billion Forecast, by Region 2020 & 2033
- Table 4: Global Bottled Water Industry Revenue billion Forecast, by Type 2020 & 2033
- Table 5: Global Bottled Water Industry Revenue billion Forecast, by Distribution Channel 2020 & 2033
- Table 6: Global Bottled Water Industry Revenue billion Forecast, by Country 2020 & 2033
- Table 7: United States Bottled Water Industry Revenue (billion) Forecast, by Application 2020 & 2033
- Table 8: Canada Bottled Water Industry Revenue (billion) Forecast, by Application 2020 & 2033
- Table 9: Mexico Bottled Water Industry Revenue (billion) Forecast, by Application 2020 & 2033
- Table 10: Global Bottled Water Industry Revenue billion Forecast, by Type 2020 & 2033
- Table 11: Global Bottled Water Industry Revenue billion Forecast, by Distribution Channel 2020 & 2033
- Table 12: Global Bottled Water Industry Revenue billion Forecast, by Country 2020 & 2033
- Table 13: Brazil Bottled Water Industry Revenue (billion) Forecast, by Application 2020 & 2033
- Table 14: Argentina Bottled Water Industry Revenue (billion) Forecast, by Application 2020 & 2033
- Table 15: Rest of South America Bottled Water Industry Revenue (billion) Forecast, by Application 2020 & 2033
- Table 16: Global Bottled Water Industry Revenue billion Forecast, by Type 2020 & 2033
- Table 17: Global Bottled Water Industry Revenue billion Forecast, by Distribution Channel 2020 & 2033
- Table 18: Global Bottled Water Industry Revenue billion Forecast, by Country 2020 & 2033
- Table 19: United Kingdom Bottled Water Industry Revenue (billion) Forecast, by Application 2020 & 2033
- Table 20: Germany Bottled Water Industry Revenue (billion) Forecast, by Application 2020 & 2033
- Table 21: France Bottled Water Industry Revenue (billion) Forecast, by Application 2020 & 2033
- Table 22: Italy Bottled Water Industry Revenue (billion) Forecast, by Application 2020 & 2033
- Table 23: Spain Bottled Water Industry Revenue (billion) Forecast, by Application 2020 & 2033
- Table 24: Russia Bottled Water Industry Revenue (billion) Forecast, by Application 2020 & 2033
- Table 25: Benelux Bottled Water Industry Revenue (billion) Forecast, by Application 2020 & 2033
- Table 26: Nordics Bottled Water Industry Revenue (billion) Forecast, by Application 2020 & 2033
- Table 27: Rest of Europe Bottled Water Industry Revenue (billion) Forecast, by Application 2020 & 2033
- Table 28: Global Bottled Water Industry Revenue billion Forecast, by Type 2020 & 2033
- Table 29: Global Bottled Water Industry Revenue billion Forecast, by Distribution Channel 2020 & 2033
- Table 30: Global Bottled Water Industry Revenue billion Forecast, by Country 2020 & 2033
- Table 31: Turkey Bottled Water Industry Revenue (billion) Forecast, by Application 2020 & 2033
- Table 32: Israel Bottled Water Industry Revenue (billion) Forecast, by Application 2020 & 2033
- Table 33: GCC Bottled Water Industry Revenue (billion) Forecast, by Application 2020 & 2033
- Table 34: North Africa Bottled Water Industry Revenue (billion) Forecast, by Application 2020 & 2033
- Table 35: South Africa Bottled Water Industry Revenue (billion) Forecast, by Application 2020 & 2033
- Table 36: Rest of Middle East & Africa Bottled Water Industry Revenue (billion) Forecast, by Application 2020 & 2033
- Table 37: Global Bottled Water Industry Revenue billion Forecast, by Type 2020 & 2033
- Table 38: Global Bottled Water Industry Revenue billion Forecast, by Distribution Channel 2020 & 2033
- Table 39: Global Bottled Water Industry Revenue billion Forecast, by Country 2020 & 2033
- Table 40: China Bottled Water Industry Revenue (billion) Forecast, by Application 2020 & 2033
- Table 41: India Bottled Water Industry Revenue (billion) Forecast, by Application 2020 & 2033
- Table 42: Japan Bottled Water Industry Revenue (billion) Forecast, by Application 2020 & 2033
- Table 43: South Korea Bottled Water Industry Revenue (billion) Forecast, by Application 2020 & 2033
- Table 44: ASEAN Bottled Water Industry Revenue (billion) Forecast, by Application 2020 & 2033
- Table 45: Oceania Bottled Water Industry Revenue (billion) Forecast, by Application 2020 & 2033
- Table 46: Rest of Asia Pacific Bottled Water Industry Revenue (billion) Forecast, by Application 2020 & 2033
Frequently Asked Questions
1. What is the projected Compound Annual Growth Rate (CAGR) of the Bottled Water Industry?
The projected CAGR is approximately 5.3%.
2. Which companies are prominent players in the Bottled Water Industry?
Key companies in the market include Masafi Inc, Agthia Group PJSC, PepsiCo Inc, Spindrift, National Food Products Company (Oasis Pure Water), AL Ghadeer Drinking Water LLC, Hint Inc, Mai Dubai*List Not Exhaustive, Dubai Crystal Mineral Water & Refreshments L L C Co, Nestlé S A.
3. What are the main segments of the Bottled Water Industry?
The market segments include Type, Distribution Channel.
4. Can you provide details about the market size?
The market size is estimated to be USD 353.61 billion as of 2022.
5. What are some drivers contributing to market growth?
Increasing Demand for Protein-Rich Food; Increasing Demand for Plant-Based and Organic Ingredients.
6. What are the notable trends driving market growth?
Surge in the Demand for Functional/Fortified and Flavored Water.
7. Are there any restraints impacting market growth?
Presence of Counterfeit Products.
8. Can you provide examples of recent developments in the market?
September 2021: Masafi Inc. launched "Source", the premium and sustainable water bottle in the UAE, produced by hydro panel technology, which uses the energy and heat of the sun to create premium drinking water.
9. What pricing options are available for accessing the report?
Pricing options include single-user, multi-user, and enterprise licenses priced at USD 3800, USD 4500, and USD 5800 respectively.
10. Is the market size provided in terms of value or volume?
The market size is provided in terms of value, measured in billion.
11. Are there any specific market keywords associated with the report?
Yes, the market keyword associated with the report is "Bottled Water Industry," which aids in identifying and referencing the specific market segment covered.
12. How do I determine which pricing option suits my needs best?
The pricing options vary based on user requirements and access needs. Individual users may opt for single-user licenses, while businesses requiring broader access may choose multi-user or enterprise licenses for cost-effective access to the report.
13. Are there any additional resources or data provided in the Bottled Water Industry report?
While the report offers comprehensive insights, it's advisable to review the specific contents or supplementary materials provided to ascertain if additional resources or data are available.
14. How can I stay updated on further developments or reports in the Bottled Water Industry?
To stay informed about further developments, trends, and reports in the Bottled Water Industry, consider subscribing to industry newsletters, following relevant companies and organizations, or regularly checking reputable industry news sources and publications.
Methodology
Step 1 - Identification of Relevant Samples Size from Population Database


Step 2 - Approaches for Defining Global Market Size (Value, Volume* & Price*)

Note*: In applicable scenarios
Step 3 - Data Sources
Primary Research
- Web Analytics
- Survey Reports
- Research Institute
- Latest Research Reports
- Opinion Leaders
Secondary Research
- Annual Reports
- White Paper
- Latest Press Release
- Industry Association
- Paid Database
- Investor Presentations

Step 4 - Data Triangulation
Involves using different sources of information in order to increase the validity of a study
These sources are likely to be stakeholders in a program - participants, other researchers, program staff, other community members, and so on.
Then we put all data in single framework & apply various statistical tools to find out the dynamic on the market.
During the analysis stage, feedback from the stakeholder groups would be compared to determine areas of agreement as well as areas of divergence