

Key Insights
The Asia-Pacific (APAC) probiotic market is projected for significant expansion, fueled by heightened health awareness, rising disposable incomes, and a greater understanding of the gut microbiome's role in well-being. This diverse region offers substantial opportunities for probiotic manufacturers. Key growth drivers include the increasing incidence of digestive issues and the burgeoning adoption of functional foods. Projected for 2025, the APAC market size is estimated at $86.01 billion, with an anticipated compound annual growth rate (CAGR) of 10.7%. E-commerce expansion and wider online product availability further contribute to this robust market. The market is segmented by product type into probiotic foods (dairy and non-dairy) and supplements. While dairy currently leads due to established consumer trust and distribution, the non-dairy segment is poised for rapid growth driven by vegan and plant-based demand.
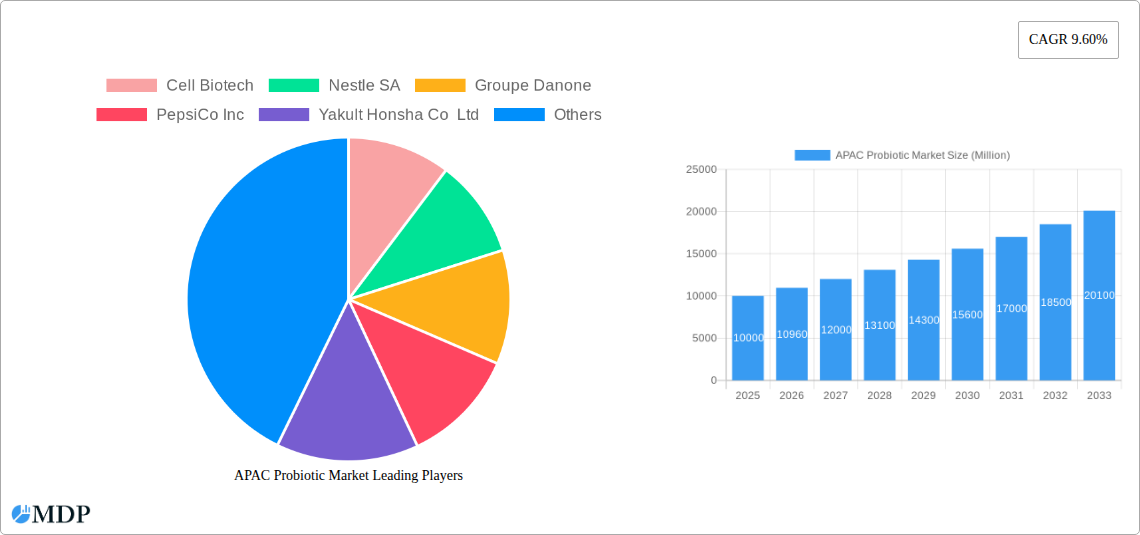
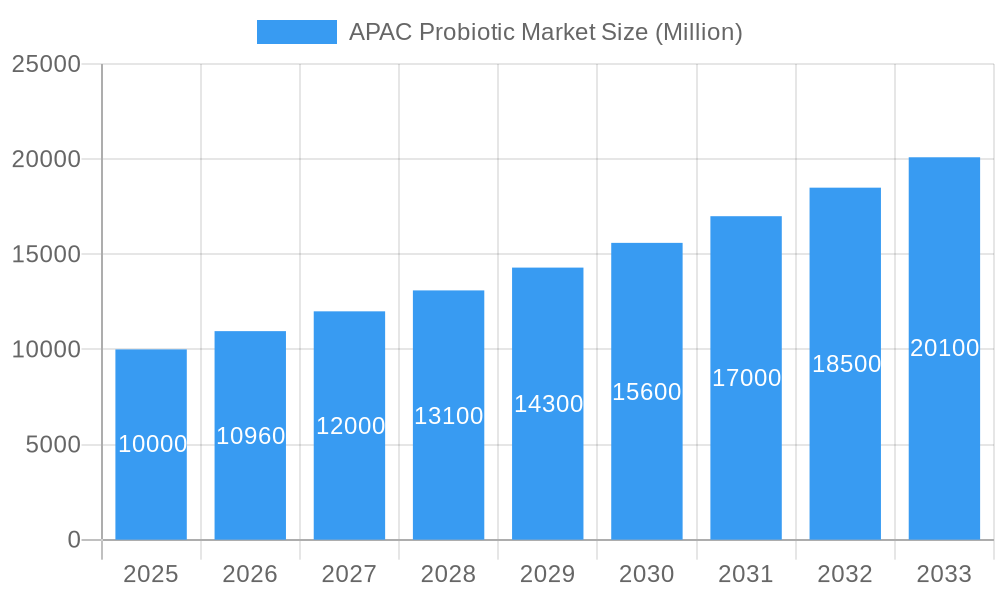
APAC Probiotic Market Market Size (In Billion)
China, India, Japan, and South Korea are pivotal to APAC's market growth, supported by an expanding middle class with increased purchasing power and a focus on preventative healthcare. Potential challenges include varying regulatory landscapes, diverse consumer preferences, and the necessity for clear consumer education on probiotic benefits. Nonetheless, the long-term outlook is highly positive, driven by continuous product innovation, increased R&D investment, and a growing emphasis on personalized nutrition. The development of novel probiotic strains addressing specific health needs will further accelerate market expansion.
APAC Probiotic Market Company Market Share
APAC Probiotic Market Report: 2019-2033
This comprehensive report provides an in-depth analysis of the Asia-Pacific (APAC) probiotic market, covering the period from 2019 to 2033. With a base year of 2025 and a forecast period of 2025-2033, this report is an essential resource for industry stakeholders seeking actionable insights and strategic guidance. The report leverages extensive market research to offer a granular understanding of market dynamics, competitive landscapes, and future growth potential. We analyze key segments, including probiotic foods, probiotic drinks (dairy-based and others), and dietary supplements, across various distribution channels like supermarkets, convenience stores, pharmacies, and online retailers. Leading players such as Cell Biotech, Nestle SA, Groupe Danone, PepsiCo Inc, Yakult Honsha Co Ltd, Amway Corp, Danone SA, Now Foods, Bio-K Plus International, and Anand Milk Union Limited are profiled, providing crucial competitive intelligence. This report is your complete guide to navigating the thriving APAC probiotic market.
APAC Probiotic Market Dynamics & Concentration
The APAC probiotic market is characterized by a dynamic interplay of factors influencing its growth and concentration. Market concentration is currently [Insert Market Concentration Metric, e.g., moderately high, with the top 5 players holding xx% market share], driven by the presence of both established multinational corporations and regional players. Innovation is a key driver, with companies continuously developing new products and formulations to cater to evolving consumer preferences. The regulatory landscape varies across APAC countries, impacting market entry and product approvals. Product substitutes, such as prebiotics and other functional foods, compete for market share, while end-user trends, particularly increasing health consciousness and demand for functional foods, are significantly bolstering growth.
- Market Share: Top 5 players hold approximately xx% of the market share (2024).
- M&A Activity: The number of M&A deals in the APAC probiotic market from 2019 to 2024 totaled approximately xx. These activities reflect a drive towards consolidation and expansion.
- Innovation Drivers: Growing consumer demand for gut health solutions, increasing awareness of the health benefits of probiotics, and technological advancements in probiotic formulation and delivery are key drivers of innovation.
- Regulatory Landscape: Varying regulatory standards across different APAC countries present both challenges and opportunities for market players.
APAC Probiotic Market Industry Trends & Analysis
The APAC probiotic market exhibits robust growth, projected to reach xx Million by 2033, driven by a CAGR of xx% during the forecast period (2025-2033). This growth is fueled by rising health consciousness among consumers, increasing disposable incomes, and a growing preference for natural and functional foods. Technological advancements in probiotic strain development, enhanced delivery systems (e.g., encapsulation), and improved shelf-life are further accelerating market expansion. Consumer preferences are shifting towards convenient, ready-to-consume probiotic products, such as drinks and supplements, alongside traditional probiotic foods like yogurt. Competitive dynamics are intense, with major players engaging in product diversification, strategic partnerships, and aggressive marketing campaigns to gain market share. Market penetration is increasing steadily, especially in rapidly developing economies.
Leading Markets & Segments in APAC Probiotic Market
China and India dominate the APAC probiotic market, accounting for approximately xx% and xx% of the total market value, respectively, in 2024. This dominance is attributable to a large population base, rising health awareness, and increasing disposable incomes. Other key markets include Japan, South Korea, and Australia. Within product types, probiotic drinks command the largest share, followed by dietary supplements and probiotic foods.
- Key Drivers for China: Growing middle class, rising disposable income, increasing health awareness, strong government support for the functional food industry.
- Key Drivers for India: Large population base, increasing demand for affordable and convenient healthcare solutions, expanding retail infrastructure.
The supermarket/hypermarket channel constitutes the primary distribution channel for probiotic products, followed by convenience stores and online retail. Pharmacies and drug stores are also important channels.
APAC Probiotic Market Product Developments
Recent product innovations focus on enhancing the efficacy, stability, and palatability of probiotic products. There is a notable trend towards the development of targeted probiotic formulations for specific health conditions (e.g., gut health, immunity) and demographics (e.g., children, seniors). Companies are also exploring novel delivery systems, such as encapsulation and microencapsulation, to improve probiotic survival during processing and storage, and enhance consumer acceptance. These innovations cater to evolving consumer preferences for convenient, efficacious, and palatable probiotic products.
Key Drivers of APAC Probiotic Market Growth
Several factors are driving the expansion of the APAC probiotic market. Technological advancements in probiotic strain development and delivery systems are enhancing product efficacy and appeal. Rising disposable incomes and increasing health awareness, particularly in emerging economies, are boosting consumer demand. Favorable government regulations supporting the functional food industry also contribute to market growth. Specifically, the growing demand for functional foods and the increasing awareness of the importance of gut health are major growth catalysts.
Challenges in the APAC Probiotic Market Market
Despite robust growth, the APAC probiotic market faces several challenges. Stricter regulatory requirements for probiotic product approvals and labeling create obstacles for market entry. Maintaining the viability and efficacy of probiotic strains during processing and storage poses a significant technical challenge. Intense competition among established players and emerging brands puts pressure on pricing and margins. These factors could collectively impact the market's overall growth trajectory by approximately xx% by 2033 (predicted).
Emerging Opportunities in APAP Probiotic Market
The APAP Probiotic Market presents significant opportunities for growth. Technological advancements like personalized probiotic formulations based on individual gut microbiota profiles are emerging. Strategic partnerships between probiotic manufacturers, food and beverage companies, and healthcare providers are creating synergistic opportunities. Expansion into underserved markets within APAC and tapping into the potential of e-commerce platforms are crucial strategies for long-term growth.
Leading Players in the APAC Probiotic Market Sector
- Cell Biotech
- Nestle SA
- Groupe Danone
- PepsiCo Inc
- Yakult Honsha Co Ltd
- Amway Corp
- Danone SA
- Now Foods
- Bio-K Plus International
- Anand Milk Union Limited
*List Not Exhaustive
Key Milestones in APAC Probiotic Market Industry
- Sept 2022: Nestle Health Science's Garden of Life launched two new probiotic drinks for children in China's offline market.
- Jan 2022: Mengniu's Youyi C launched two probiotic solid drinks featuring Chinese patented bacteria strains.
- Mar 2021: COSTA launched a peach probiotic latte in collaboration with NZMP in China.
These launches showcase the ongoing product innovation and expansion within the APAC probiotic market.
Strategic Outlook for APAC Probiotic Market Market
The APAC probiotic market is poised for continued expansion, driven by a confluence of factors. The increasing adoption of personalized nutrition approaches, coupled with technological breakthroughs in probiotic development and delivery systems, presents significant opportunities. Strategic partnerships, market diversification, and a focus on consumer education will be crucial for companies seeking to capitalize on the market's long-term growth potential. The forecast indicates a substantial increase in market value, driven by the factors highlighted in this report.
APAC Probiotic Market Segmentation
-
1. Type
-
1.1. Probiotic Foods
- 1.1.1. Yogurt
- 1.1.2. Bakery/Breakfast Cereals
- 1.1.3. Baby Food and Infant Formula
- 1.1.4. Other Probiotic Foods
-
1.2. Probiotic Drinks
- 1.2.1. Fruit-based Probiotic Drinks
- 1.2.2. Dairy-based Probiotic Drinks
- 1.3. Dietary Supplements
-
1.1. Probiotic Foods
-
2. Distribution Channel
- 2.1. Supermarkets/Hypermarkets
- 2.2. Convenience Stores
- 2.3. Pharmacies and Drug Stores
- 2.4. Online Retail Stores
- 2.5. Other Distribution Channels
-
3. Geography
- 3.1. China
- 3.2. Japan
- 3.3. India
- 3.4. South Korea
- 3.5. Australia
- 3.6. Rest of Asia-Pacific
APAC Probiotic Market Segmentation By Geography
- 1. China
- 2. Japan
- 3. India
- 4. South Korea
- 5. Australia
- 6. Rest of Asia Pacific
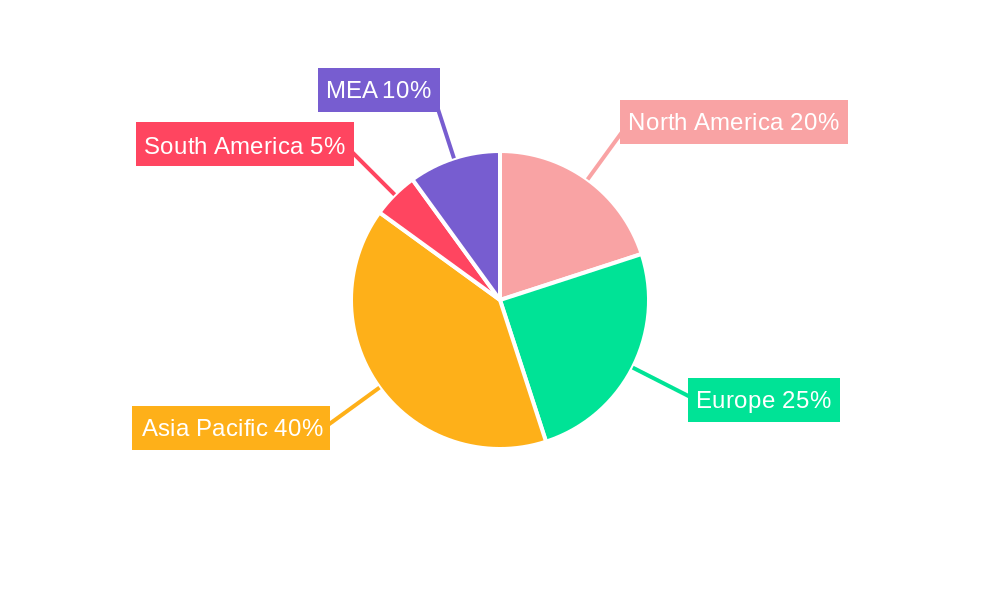
APAC Probiotic Market Regional Market Share
Geographic Coverage of APAC Probiotic Market
APAC Probiotic Market REPORT HIGHLIGHTS
| Aspects | Details |
|---|---|
| Study Period | 2020-2034 |
| Base Year | 2025 |
| Estimated Year | 2026 |
| Forecast Period | 2026-2034 |
| Historical Period | 2020-2025 |
| Growth Rate | CAGR of 10.7% from 2020-2034 |
| Segmentation |
|
Table of Contents
- 1. Introduction
- 1.1. Research Scope
- 1.2. Market Segmentation
- 1.3. Research Objective
- 1.4. Definitions and Assumptions
- 2. Executive Summary
- 2.1. Market Snapshot
- 3. Market Dynamics
- 3.1. Market Drivers
- 3.2. Market Restrains
- 3.3. Market Trends
- 3.4. Market Opportunities
- 4. Market Factor Analysis
- 4.1. Porters Five Forces
- 4.1.1. Bargaining Power of Suppliers
- 4.1.2. Bargaining Power of Buyers
- 4.1.3. Threat of New Entrants
- 4.1.4. Threat of Substitutes
- 4.1.5. Competitive Rivalry
- 4.2. PESTEL analysis
- 4.3. BCG Analysis
- 4.3.1. Stars (High Growth, High Market Share)
- 4.3.2. Cash Cows (Low Growth, High Market Share)
- 4.3.3. Question Mark (High Growth, Low Market Share)
- 4.3.4. Dogs (Low Growth, Low Market Share)
- 4.4. Ansoff Matrix Analysis
- 4.5. Supply Chain Analysis
- 4.6. Regulatory Landscape
- 4.7. Current Market Potential and Opportunity Assessment (TAM–SAM–SOM Framework)
- 4.8. MDP Analyst Note
- 4.1. Porters Five Forces
- 5. Market Analysis, Insights and Forecast 2021-2033
- 5.1. Market Analysis, Insights and Forecast - by Type
- 5.1.1. Probiotic Foods
- 5.1.1.1. Yogurt
- 5.1.1.2. Bakery/Breakfast Cereals
- 5.1.1.3. Baby Food and Infant Formula
- 5.1.1.4. Other Probiotic Foods
- 5.1.2. Probiotic Drinks
- 5.1.2.1. Fruit-based Probiotic Drinks
- 5.1.2.2. Dairy-based Probiotic Drinks
- 5.1.3. Dietary Supplements
- 5.1.1. Probiotic Foods
- 5.2. Market Analysis, Insights and Forecast - by Distribution Channel
- 5.2.1. Supermarkets/Hypermarkets
- 5.2.2. Convenience Stores
- 5.2.3. Pharmacies and Drug Stores
- 5.2.4. Online Retail Stores
- 5.2.5. Other Distribution Channels
- 5.3. Market Analysis, Insights and Forecast - by Geography
- 5.3.1. China
- 5.3.2. Japan
- 5.3.3. India
- 5.3.4. South Korea
- 5.3.5. Australia
- 5.3.6. Rest of Asia-Pacific
- 5.4. Market Analysis, Insights and Forecast - by Region
- 5.4.1. China
- 5.4.2. Japan
- 5.4.3. India
- 5.4.4. South Korea
- 5.4.5. Australia
- 5.4.6. Rest of Asia Pacific
- 5.1. Market Analysis, Insights and Forecast - by Type
- 6. Global APAC Probiotic Market Analysis, Insights and Forecast, 2021-2033
- 6.1. Market Analysis, Insights and Forecast - by Type
- 6.1.1. Probiotic Foods
- 6.1.1.1. Yogurt
- 6.1.1.2. Bakery/Breakfast Cereals
- 6.1.1.3. Baby Food and Infant Formula
- 6.1.1.4. Other Probiotic Foods
- 6.1.2. Probiotic Drinks
- 6.1.2.1. Fruit-based Probiotic Drinks
- 6.1.2.2. Dairy-based Probiotic Drinks
- 6.1.3. Dietary Supplements
- 6.1.1. Probiotic Foods
- 6.2. Market Analysis, Insights and Forecast - by Distribution Channel
- 6.2.1. Supermarkets/Hypermarkets
- 6.2.2. Convenience Stores
- 6.2.3. Pharmacies and Drug Stores
- 6.2.4. Online Retail Stores
- 6.2.5. Other Distribution Channels
- 6.3. Market Analysis, Insights and Forecast - by Geography
- 6.3.1. China
- 6.3.2. Japan
- 6.3.3. India
- 6.3.4. South Korea
- 6.3.5. Australia
- 6.3.6. Rest of Asia-Pacific
- 6.1. Market Analysis, Insights and Forecast - by Type
- 7. China APAC Probiotic Market Analysis, Insights and Forecast, 2020-2032
- 7.1. Market Analysis, Insights and Forecast - by Type
- 7.1.1. Probiotic Foods
- 7.1.1.1. Yogurt
- 7.1.1.2. Bakery/Breakfast Cereals
- 7.1.1.3. Baby Food and Infant Formula
- 7.1.1.4. Other Probiotic Foods
- 7.1.2. Probiotic Drinks
- 7.1.2.1. Fruit-based Probiotic Drinks
- 7.1.2.2. Dairy-based Probiotic Drinks
- 7.1.3. Dietary Supplements
- 7.1.1. Probiotic Foods
- 7.2. Market Analysis, Insights and Forecast - by Distribution Channel
- 7.2.1. Supermarkets/Hypermarkets
- 7.2.2. Convenience Stores
- 7.2.3. Pharmacies and Drug Stores
- 7.2.4. Online Retail Stores
- 7.2.5. Other Distribution Channels
- 7.3. Market Analysis, Insights and Forecast - by Geography
- 7.3.1. China
- 7.3.2. Japan
- 7.3.3. India
- 7.3.4. South Korea
- 7.3.5. Australia
- 7.3.6. Rest of Asia-Pacific
- 7.1. Market Analysis, Insights and Forecast - by Type
- 8. Japan APAC Probiotic Market Analysis, Insights and Forecast, 2020-2032
- 8.1. Market Analysis, Insights and Forecast - by Type
- 8.1.1. Probiotic Foods
- 8.1.1.1. Yogurt
- 8.1.1.2. Bakery/Breakfast Cereals
- 8.1.1.3. Baby Food and Infant Formula
- 8.1.1.4. Other Probiotic Foods
- 8.1.2. Probiotic Drinks
- 8.1.2.1. Fruit-based Probiotic Drinks
- 8.1.2.2. Dairy-based Probiotic Drinks
- 8.1.3. Dietary Supplements
- 8.1.1. Probiotic Foods
- 8.2. Market Analysis, Insights and Forecast - by Distribution Channel
- 8.2.1. Supermarkets/Hypermarkets
- 8.2.2. Convenience Stores
- 8.2.3. Pharmacies and Drug Stores
- 8.2.4. Online Retail Stores
- 8.2.5. Other Distribution Channels
- 8.3. Market Analysis, Insights and Forecast - by Geography
- 8.3.1. China
- 8.3.2. Japan
- 8.3.3. India
- 8.3.4. South Korea
- 8.3.5. Australia
- 8.3.6. Rest of Asia-Pacific
- 8.1. Market Analysis, Insights and Forecast - by Type
- 9. India APAC Probiotic Market Analysis, Insights and Forecast, 2020-2032
- 9.1. Market Analysis, Insights and Forecast - by Type
- 9.1.1. Probiotic Foods
- 9.1.1.1. Yogurt
- 9.1.1.2. Bakery/Breakfast Cereals
- 9.1.1.3. Baby Food and Infant Formula
- 9.1.1.4. Other Probiotic Foods
- 9.1.2. Probiotic Drinks
- 9.1.2.1. Fruit-based Probiotic Drinks
- 9.1.2.2. Dairy-based Probiotic Drinks
- 9.1.3. Dietary Supplements
- 9.1.1. Probiotic Foods
- 9.2. Market Analysis, Insights and Forecast - by Distribution Channel
- 9.2.1. Supermarkets/Hypermarkets
- 9.2.2. Convenience Stores
- 9.2.3. Pharmacies and Drug Stores
- 9.2.4. Online Retail Stores
- 9.2.5. Other Distribution Channels
- 9.3. Market Analysis, Insights and Forecast - by Geography
- 9.3.1. China
- 9.3.2. Japan
- 9.3.3. India
- 9.3.4. South Korea
- 9.3.5. Australia
- 9.3.6. Rest of Asia-Pacific
- 9.1. Market Analysis, Insights and Forecast - by Type
- 10. South Korea APAC Probiotic Market Analysis, Insights and Forecast, 2020-2032
- 10.1. Market Analysis, Insights and Forecast - by Type
- 10.1.1. Probiotic Foods
- 10.1.1.1. Yogurt
- 10.1.1.2. Bakery/Breakfast Cereals
- 10.1.1.3. Baby Food and Infant Formula
- 10.1.1.4. Other Probiotic Foods
- 10.1.2. Probiotic Drinks
- 10.1.2.1. Fruit-based Probiotic Drinks
- 10.1.2.2. Dairy-based Probiotic Drinks
- 10.1.3. Dietary Supplements
- 10.1.1. Probiotic Foods
- 10.2. Market Analysis, Insights and Forecast - by Distribution Channel
- 10.2.1. Supermarkets/Hypermarkets
- 10.2.2. Convenience Stores
- 10.2.3. Pharmacies and Drug Stores
- 10.2.4. Online Retail Stores
- 10.2.5. Other Distribution Channels
- 10.3. Market Analysis, Insights and Forecast - by Geography
- 10.3.1. China
- 10.3.2. Japan
- 10.3.3. India
- 10.3.4. South Korea
- 10.3.5. Australia
- 10.3.6. Rest of Asia-Pacific
- 10.1. Market Analysis, Insights and Forecast - by Type
- 11. Australia APAC Probiotic Market Analysis, Insights and Forecast, 2020-2032
- 11.1. Market Analysis, Insights and Forecast - by Type
- 11.1.1. Probiotic Foods
- 11.1.1.1. Yogurt
- 11.1.1.2. Bakery/Breakfast Cereals
- 11.1.1.3. Baby Food and Infant Formula
- 11.1.1.4. Other Probiotic Foods
- 11.1.2. Probiotic Drinks
- 11.1.2.1. Fruit-based Probiotic Drinks
- 11.1.2.2. Dairy-based Probiotic Drinks
- 11.1.3. Dietary Supplements
- 11.1.1. Probiotic Foods
- 11.2. Market Analysis, Insights and Forecast - by Distribution Channel
- 11.2.1. Supermarkets/Hypermarkets
- 11.2.2. Convenience Stores
- 11.2.3. Pharmacies and Drug Stores
- 11.2.4. Online Retail Stores
- 11.2.5. Other Distribution Channels
- 11.3. Market Analysis, Insights and Forecast - by Geography
- 11.3.1. China
- 11.3.2. Japan
- 11.3.3. India
- 11.3.4. South Korea
- 11.3.5. Australia
- 11.3.6. Rest of Asia-Pacific
- 11.1. Market Analysis, Insights and Forecast - by Type
- 12. Rest of Asia Pacific APAC Probiotic Market Analysis, Insights and Forecast, 2020-2032
- 12.1. Market Analysis, Insights and Forecast - by Type
- 12.1.1. Probiotic Foods
- 12.1.1.1. Yogurt
- 12.1.1.2. Bakery/Breakfast Cereals
- 12.1.1.3. Baby Food and Infant Formula
- 12.1.1.4. Other Probiotic Foods
- 12.1.2. Probiotic Drinks
- 12.1.2.1. Fruit-based Probiotic Drinks
- 12.1.2.2. Dairy-based Probiotic Drinks
- 12.1.3. Dietary Supplements
- 12.1.1. Probiotic Foods
- 12.2. Market Analysis, Insights and Forecast - by Distribution Channel
- 12.2.1. Supermarkets/Hypermarkets
- 12.2.2. Convenience Stores
- 12.2.3. Pharmacies and Drug Stores
- 12.2.4. Online Retail Stores
- 12.2.5. Other Distribution Channels
- 12.3. Market Analysis, Insights and Forecast - by Geography
- 12.3.1. China
- 12.3.2. Japan
- 12.3.3. India
- 12.3.4. South Korea
- 12.3.5. Australia
- 12.3.6. Rest of Asia-Pacific
- 12.1. Market Analysis, Insights and Forecast - by Type
- 13. Competitive Analysis
- 13.1. Company Profiles
- 13.1.1 Cell Biotech
- 13.1.1.1. Company Overview
- 13.1.1.2. Products
- 13.1.1.3. Company Financials
- 13.1.1.4. SWOT Analysis
- 13.1.2 Nestle SA
- 13.1.2.1. Company Overview
- 13.1.2.2. Products
- 13.1.2.3. Company Financials
- 13.1.2.4. SWOT Analysis
- 13.1.3 Groupe Danone
- 13.1.3.1. Company Overview
- 13.1.3.2. Products
- 13.1.3.3. Company Financials
- 13.1.3.4. SWOT Analysis
- 13.1.4 PepsiCo Inc
- 13.1.4.1. Company Overview
- 13.1.4.2. Products
- 13.1.4.3. Company Financials
- 13.1.4.4. SWOT Analysis
- 13.1.5 Yakult Honsha Co Ltd
- 13.1.5.1. Company Overview
- 13.1.5.2. Products
- 13.1.5.3. Company Financials
- 13.1.5.4. SWOT Analysis
- 13.1.6 Amway Corp
- 13.1.6.1. Company Overview
- 13.1.6.2. Products
- 13.1.6.3. Company Financials
- 13.1.6.4. SWOT Analysis
- 13.1.7 Danone SA
- 13.1.7.1. Company Overview
- 13.1.7.2. Products
- 13.1.7.3. Company Financials
- 13.1.7.4. SWOT Analysis
- 13.1.8 Now Foods
- 13.1.8.1. Company Overview
- 13.1.8.2. Products
- 13.1.8.3. Company Financials
- 13.1.8.4. SWOT Analysis
- 13.1.9 Bio-K Plus International
- 13.1.9.1. Company Overview
- 13.1.9.2. Products
- 13.1.9.3. Company Financials
- 13.1.9.4. SWOT Analysis
- 13.1.10 Anand Milk Union Limited*List Not Exhaustive
- 13.1.10.1. Company Overview
- 13.1.10.2. Products
- 13.1.10.3. Company Financials
- 13.1.10.4. SWOT Analysis
- 13.1.1 Cell Biotech
- 13.2. Market Entropy
- 13.2.1 Company's Key Areas Served
- 13.2.2 Recent Developments
- 13.3. Company Market Share Analysis 2025
- 13.3.1 Top 5 Companies Market Share Analysis
- 13.3.2 Top 3 Companies Market Share Analysis
- 13.4. List of Potential Customers
- 14. Research Methodology
List of Figures
- Figure 1: Global APAC Probiotic Market Revenue Breakdown (billion, %) by Region 2025 & 2033
- Figure 2: China APAC Probiotic Market Revenue (billion), by Type 2025 & 2033
- Figure 3: China APAC Probiotic Market Revenue Share (%), by Type 2025 & 2033
- Figure 4: China APAC Probiotic Market Revenue (billion), by Distribution Channel 2025 & 2033
- Figure 5: China APAC Probiotic Market Revenue Share (%), by Distribution Channel 2025 & 2033
- Figure 6: China APAC Probiotic Market Revenue (billion), by Geography 2025 & 2033
- Figure 7: China APAC Probiotic Market Revenue Share (%), by Geography 2025 & 2033
- Figure 8: China APAC Probiotic Market Revenue (billion), by Country 2025 & 2033
- Figure 9: China APAC Probiotic Market Revenue Share (%), by Country 2025 & 2033
- Figure 10: Japan APAC Probiotic Market Revenue (billion), by Type 2025 & 2033
- Figure 11: Japan APAC Probiotic Market Revenue Share (%), by Type 2025 & 2033
- Figure 12: Japan APAC Probiotic Market Revenue (billion), by Distribution Channel 2025 & 2033
- Figure 13: Japan APAC Probiotic Market Revenue Share (%), by Distribution Channel 2025 & 2033
- Figure 14: Japan APAC Probiotic Market Revenue (billion), by Geography 2025 & 2033
- Figure 15: Japan APAC Probiotic Market Revenue Share (%), by Geography 2025 & 2033
- Figure 16: Japan APAC Probiotic Market Revenue (billion), by Country 2025 & 2033
- Figure 17: Japan APAC Probiotic Market Revenue Share (%), by Country 2025 & 2033
- Figure 18: India APAC Probiotic Market Revenue (billion), by Type 2025 & 2033
- Figure 19: India APAC Probiotic Market Revenue Share (%), by Type 2025 & 2033
- Figure 20: India APAC Probiotic Market Revenue (billion), by Distribution Channel 2025 & 2033
- Figure 21: India APAC Probiotic Market Revenue Share (%), by Distribution Channel 2025 & 2033
- Figure 22: India APAC Probiotic Market Revenue (billion), by Geography 2025 & 2033
- Figure 23: India APAC Probiotic Market Revenue Share (%), by Geography 2025 & 2033
- Figure 24: India APAC Probiotic Market Revenue (billion), by Country 2025 & 2033
- Figure 25: India APAC Probiotic Market Revenue Share (%), by Country 2025 & 2033
- Figure 26: South Korea APAC Probiotic Market Revenue (billion), by Type 2025 & 2033
- Figure 27: South Korea APAC Probiotic Market Revenue Share (%), by Type 2025 & 2033
- Figure 28: South Korea APAC Probiotic Market Revenue (billion), by Distribution Channel 2025 & 2033
- Figure 29: South Korea APAC Probiotic Market Revenue Share (%), by Distribution Channel 2025 & 2033
- Figure 30: South Korea APAC Probiotic Market Revenue (billion), by Geography 2025 & 2033
- Figure 31: South Korea APAC Probiotic Market Revenue Share (%), by Geography 2025 & 2033
- Figure 32: South Korea APAC Probiotic Market Revenue (billion), by Country 2025 & 2033
- Figure 33: South Korea APAC Probiotic Market Revenue Share (%), by Country 2025 & 2033
- Figure 34: Australia APAC Probiotic Market Revenue (billion), by Type 2025 & 2033
- Figure 35: Australia APAC Probiotic Market Revenue Share (%), by Type 2025 & 2033
- Figure 36: Australia APAC Probiotic Market Revenue (billion), by Distribution Channel 2025 & 2033
- Figure 37: Australia APAC Probiotic Market Revenue Share (%), by Distribution Channel 2025 & 2033
- Figure 38: Australia APAC Probiotic Market Revenue (billion), by Geography 2025 & 2033
- Figure 39: Australia APAC Probiotic Market Revenue Share (%), by Geography 2025 & 2033
- Figure 40: Australia APAC Probiotic Market Revenue (billion), by Country 2025 & 2033
- Figure 41: Australia APAC Probiotic Market Revenue Share (%), by Country 2025 & 2033
- Figure 42: Rest of Asia Pacific APAC Probiotic Market Revenue (billion), by Type 2025 & 2033
- Figure 43: Rest of Asia Pacific APAC Probiotic Market Revenue Share (%), by Type 2025 & 2033
- Figure 44: Rest of Asia Pacific APAC Probiotic Market Revenue (billion), by Distribution Channel 2025 & 2033
- Figure 45: Rest of Asia Pacific APAC Probiotic Market Revenue Share (%), by Distribution Channel 2025 & 2033
- Figure 46: Rest of Asia Pacific APAC Probiotic Market Revenue (billion), by Geography 2025 & 2033
- Figure 47: Rest of Asia Pacific APAC Probiotic Market Revenue Share (%), by Geography 2025 & 2033
- Figure 48: Rest of Asia Pacific APAC Probiotic Market Revenue (billion), by Country 2025 & 2033
- Figure 49: Rest of Asia Pacific APAC Probiotic Market Revenue Share (%), by Country 2025 & 2033
List of Tables
- Table 1: Global APAC Probiotic Market Revenue billion Forecast, by Type 2020 & 2033
- Table 2: Global APAC Probiotic Market Revenue billion Forecast, by Distribution Channel 2020 & 2033
- Table 3: Global APAC Probiotic Market Revenue billion Forecast, by Geography 2020 & 2033
- Table 4: Global APAC Probiotic Market Revenue billion Forecast, by Region 2020 & 2033
- Table 5: Global APAC Probiotic Market Revenue billion Forecast, by Type 2020 & 2033
- Table 6: Global APAC Probiotic Market Revenue billion Forecast, by Distribution Channel 2020 & 2033
- Table 7: Global APAC Probiotic Market Revenue billion Forecast, by Geography 2020 & 2033
- Table 8: Global APAC Probiotic Market Revenue billion Forecast, by Country 2020 & 2033
- Table 9: Global APAC Probiotic Market Revenue billion Forecast, by Type 2020 & 2033
- Table 10: Global APAC Probiotic Market Revenue billion Forecast, by Distribution Channel 2020 & 2033
- Table 11: Global APAC Probiotic Market Revenue billion Forecast, by Geography 2020 & 2033
- Table 12: Global APAC Probiotic Market Revenue billion Forecast, by Country 2020 & 2033
- Table 13: Global APAC Probiotic Market Revenue billion Forecast, by Type 2020 & 2033
- Table 14: Global APAC Probiotic Market Revenue billion Forecast, by Distribution Channel 2020 & 2033
- Table 15: Global APAC Probiotic Market Revenue billion Forecast, by Geography 2020 & 2033
- Table 16: Global APAC Probiotic Market Revenue billion Forecast, by Country 2020 & 2033
- Table 17: Global APAC Probiotic Market Revenue billion Forecast, by Type 2020 & 2033
- Table 18: Global APAC Probiotic Market Revenue billion Forecast, by Distribution Channel 2020 & 2033
- Table 19: Global APAC Probiotic Market Revenue billion Forecast, by Geography 2020 & 2033
- Table 20: Global APAC Probiotic Market Revenue billion Forecast, by Country 2020 & 2033
- Table 21: Global APAC Probiotic Market Revenue billion Forecast, by Type 2020 & 2033
- Table 22: Global APAC Probiotic Market Revenue billion Forecast, by Distribution Channel 2020 & 2033
- Table 23: Global APAC Probiotic Market Revenue billion Forecast, by Geography 2020 & 2033
- Table 24: Global APAC Probiotic Market Revenue billion Forecast, by Country 2020 & 2033
- Table 25: Global APAC Probiotic Market Revenue billion Forecast, by Type 2020 & 2033
- Table 26: Global APAC Probiotic Market Revenue billion Forecast, by Distribution Channel 2020 & 2033
- Table 27: Global APAC Probiotic Market Revenue billion Forecast, by Geography 2020 & 2033
- Table 28: Global APAC Probiotic Market Revenue billion Forecast, by Country 2020 & 2033
Frequently Asked Questions
1. What is the projected Compound Annual Growth Rate (CAGR) of the APAC Probiotic Market?
The projected CAGR is approximately 10.7%.
2. Which companies are prominent players in the APAC Probiotic Market?
Key companies in the market include Cell Biotech, Nestle SA, Groupe Danone, PepsiCo Inc, Yakult Honsha Co Ltd, Amway Corp, Danone SA, Now Foods, Bio-K Plus International, Anand Milk Union Limited*List Not Exhaustive.
3. What are the main segments of the APAC Probiotic Market?
The market segments include Type, Distribution Channel, Geography.
4. Can you provide details about the market size?
The market size is estimated to be USD 86.01 billion as of 2022.
5. What are some drivers contributing to market growth?
Growth In Foodservice Expenditure and Tourism Sector; Premiumization with the Growth of Fortified and Flavored Water.
6. What are the notable trends driving market growth?
Increasing Health Consciousness.
7. Are there any restraints impacting market growth?
Concerns Regarding Plastic Waste and the Rising Inclination Toward Tap Water.
8. Can you provide examples of recent developments in the market?
Sept 2022: Nestle Health Science's probiotics brand Garden of Life launched two new probiotic drinks targeted at kids' growth and immune health in China's offline retail market.
9. What pricing options are available for accessing the report?
Pricing options include single-user, multi-user, and enterprise licenses priced at USD 4750, USD 5250, and USD 8750 respectively.
10. Is the market size provided in terms of value or volume?
The market size is provided in terms of value, measured in billion.
11. Are there any specific market keywords associated with the report?
Yes, the market keyword associated with the report is "APAC Probiotic Market," which aids in identifying and referencing the specific market segment covered.
12. How do I determine which pricing option suits my needs best?
The pricing options vary based on user requirements and access needs. Individual users may opt for single-user licenses, while businesses requiring broader access may choose multi-user or enterprise licenses for cost-effective access to the report.
13. Are there any additional resources or data provided in the APAC Probiotic Market report?
While the report offers comprehensive insights, it's advisable to review the specific contents or supplementary materials provided to ascertain if additional resources or data are available.
14. How can I stay updated on further developments or reports in the APAC Probiotic Market?
To stay informed about further developments, trends, and reports in the APAC Probiotic Market, consider subscribing to industry newsletters, following relevant companies and organizations, or regularly checking reputable industry news sources and publications.
Methodology
Step 1 - Identification of Relevant Samples Size from Population Database


Step 2 - Approaches for Defining Global Market Size (Value, Volume* & Price*)

Note*: In applicable scenarios
Step 3 - Data Sources
Primary Research
- Web Analytics
- Survey Reports
- Research Institute
- Latest Research Reports
- Opinion Leaders
Secondary Research
- Annual Reports
- White Paper
- Latest Press Release
- Industry Association
- Paid Database
- Investor Presentations

Step 4 - Data Triangulation
Involves using different sources of information in order to increase the validity of a study
These sources are likely to be stakeholders in a program - participants, other researchers, program staff, other community members, and so on.
Then we put all data in single framework & apply various statistical tools to find out the dynamic on the market.
During the analysis stage, feedback from the stakeholder groups would be compared to determine areas of agreement as well as areas of divergence