

Key Insights
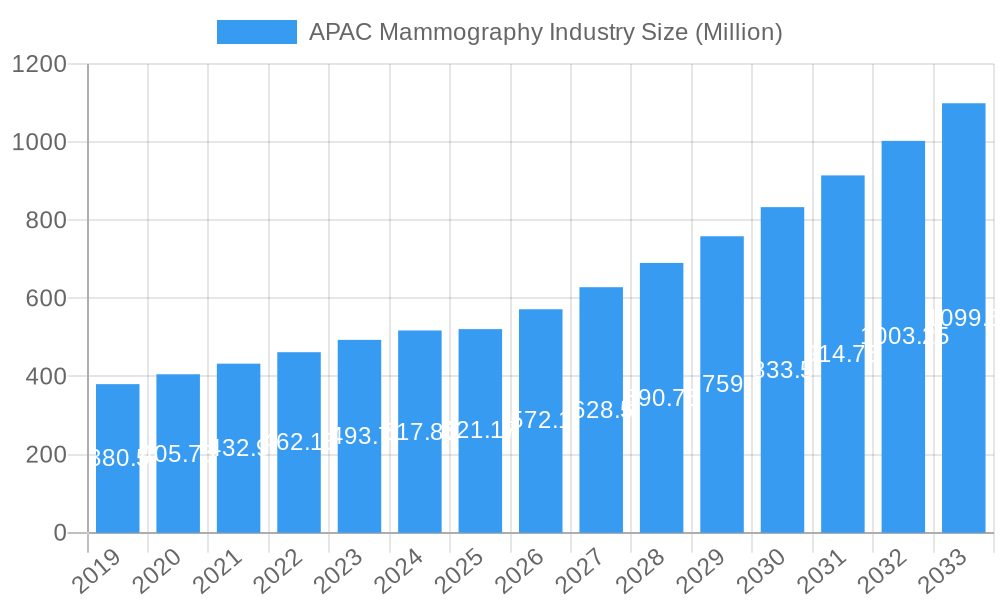
The Asia-Pacific (APAC) mammography market is poised for robust expansion, with a current market size of approximately USD 521.17 million in 2025. This growth is underpinned by a compelling Compound Annual Growth Rate (CAGR) of 9.87% projected over the forecast period of 2025-2033. This sustained upward trajectory indicates increasing demand for advanced mammography solutions across the region. Key growth drivers fueling this expansion include a rising incidence of breast cancer, a growing emphasis on early detection and preventative healthcare initiatives, and increasing disposable incomes that enhance healthcare spending capacity. Furthermore, the progressive adoption of advanced digital mammography systems, including digital breast tomosynthesis (DBT), is significantly contributing to market penetration and improved diagnostic accuracy. The expanding healthcare infrastructure, particularly in developing economies within APAC, coupled with government support for cancer screening programs, further propels market momentum.
APAC Mammography Industry Market Size (In Million)
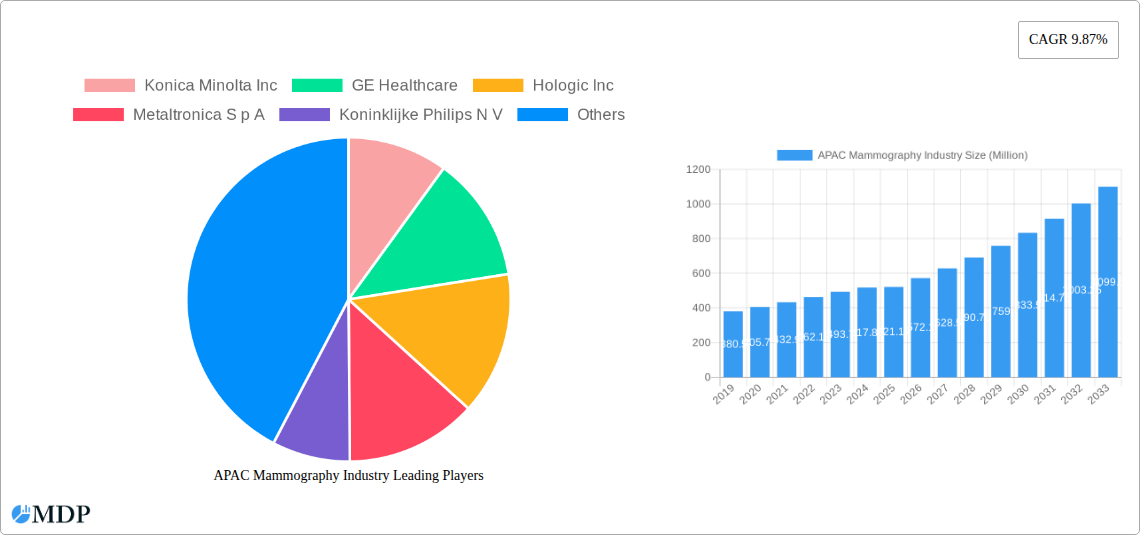
The competitive landscape is characterized by the presence of leading global players such as GE Healthcare, Siemens Healthineers AG, and Hologic Inc., alongside significant regional contributors like Konica Minolta Inc. and Fujifilm Holdings Corporation. These companies are actively engaged in product innovation, strategic collaborations, and expanding their distribution networks to cater to the diverse needs of hospitals, diagnostic centers, and other healthcare providers across APAC. The market is segmented across various product types, with digital systems and breast tomosynthesis systems leading adoption due to their superior imaging capabilities and enhanced patient outcomes. Geographically, China, India, and South Korea are emerging as key growth hubs, driven by large populations, increasing awareness, and substantial investments in healthcare modernization. However, challenges such as the high cost of advanced mammography equipment and limited access to specialized healthcare facilities in remote areas may present some restraints. Nevertheless, the overarching trend points towards a dynamic and growing APAC mammography market driven by technological advancements and a heightened focus on women's health.
APAC Mammography Industry Company Market Share
Unlock critical insights into the rapidly evolving Asia-Pacific mammography market with this in-depth report. Covering a study period from 2019 to 2033, with a base and estimated year of 2025, this analysis provides an exhaustive overview of market dynamics, trends, leading players, and future growth opportunities. Essential for radiologists, oncologists, medical device manufacturers, investors, and healthcare providers, this report empowers strategic decision-making in a crucial segment of women's health diagnostics.
APAC Mammography Industry Market Dynamics & Concentration
The APAC mammography market exhibits a moderate to high concentration, with key players like GE Healthcare, Hologic Inc, Koninklijke Philips N V, and Siemens Healthineers AG holding significant market share, estimated to be over 60% collectively. Innovation is primarily driven by the increasing demand for early breast cancer detection, fueled by rising awareness and favorable government initiatives promoting women's health screening programs across the region. Regulatory frameworks are progressively aligning with global standards, emphasizing high-resolution imaging and advanced diagnostic capabilities. Product substitutes, such as ultrasound and MRI, are present but do not fully replace the diagnostic efficacy of mammography for initial screening. End-user trends show a strong preference for digital mammography systems, including digital breast tomosynthesis (DBT), due to their superior image quality and reduced radiation exposure compared to traditional film-screen systems. Merger and acquisition (M&A) activities are sporadic but significant, often aimed at consolidating market presence or acquiring innovative technologies. For instance, M&A deal counts are projected to be around 5-10 significant transactions within the historical period (2019-2024) and are expected to continue at a similar pace, driven by the need for market expansion and technological advancement.
APAC Mammography Industry Industry Trends & Analysis
The APAC mammography industry is poised for robust growth, driven by a confluence of factors that are reshaping diagnostic capabilities for breast cancer. The projected Compound Annual Growth Rate (CAGR) for the forecast period (2025–2033) is estimated at a healthy 7.5% to 9.0%, indicating substantial market expansion. This growth is largely propelled by increasing healthcare expenditure across emerging economies in the Asia-Pacific region, coupled with a rising incidence of breast cancer, which necessitates advanced diagnostic tools. Technological disruptions are a key theme, with a pronounced shift away from analog systems towards digital mammography and, more significantly, Digital Breast Tomosynthesis (DBT). DBT, often referred to as 3D mammography, offers superior detection rates for invasive breast cancers and reduces recall rates, making it a preferred choice for hospitals and diagnostic centers. Market penetration of digital systems has already surpassed 70% in developed APAC markets like Japan and South Korea and is rapidly increasing in China and India.
Consumer preferences are evolving, with an increased demand for less invasive and more accurate screening methods. This trend directly favors the adoption of DBT. Furthermore, the growing emphasis on preventative healthcare and early detection programs, supported by government mandates and insurance policies, is creating a larger patient pool actively seeking mammography services. Competitive dynamics are intensifying, with established global players investing heavily in research and development to introduce next-generation mammography equipment. This includes innovations in artificial intelligence (AI) for image analysis, improving workflow efficiency, and enhancing diagnostic accuracy. The competitive landscape also includes regional manufacturers vying for market share through cost-effective solutions, particularly in developing nations. The overall market penetration is expected to rise from approximately 40% in 2019 to over 75% by 2033, reflecting the increasing accessibility and adoption of mammography services across diverse demographic segments within the APAC region.
Leading Markets & Segments in APAC Mammography Industry
The Asia-Pacific mammography industry is characterized by distinct regional and segmental leadership. China stands out as the largest and fastest-growing market, driven by a massive population, increasing disposable income, and significant government investments in healthcare infrastructure. Its market share is estimated to be around 30-35% of the total APAC region during the forecast period. Japan continues to be a mature and technologically advanced market, with a high adoption rate of advanced mammography systems, particularly DBT, due to its aging population and established screening programs. India presents substantial growth potential, with a rapidly expanding middle class, a rising breast cancer burden, and increasing government initiatives to improve diagnostic access in both urban and rural areas.
- Dominant Product Type: Digital Systems and Breast Tomosynthesis. Digital Systems, with a projected market share of over 60%, are the backbone of current mammography practices. Within this, Breast Tomosynthesis is the fastest-growing segment, expected to capture over 35% of the digital market by 2033. This dominance is attributed to its enhanced diagnostic capabilities in detecting subtle abnormalities and reducing false positives.
- Dominant End User: Hospitals. Hospitals constitute the largest end-user segment, accounting for approximately 55-60% of the market share. This is due to their comprehensive diagnostic facilities, ability to handle high patient volumes, and the increasing trend of integrated healthcare delivery.
- Geographical Dominance: While China leads in overall market size and growth, South Korea demonstrates a high per capita adoption rate of advanced mammography due to its strong focus on women's health and preventative care. The "Rest of Asia-Pacific" segment, encompassing countries like Southeast Asian nations, is emerging as a significant growth engine, driven by improving healthcare infrastructure and increasing awareness.
Key drivers for this dominance include economic policies that support healthcare infrastructure development, rising disposable incomes, and proactive public health campaigns aimed at early cancer detection. Infrastructure development, including the establishment of specialized breast care centers and mobile screening units, further bolsters market penetration.
APAC Mammography Industry Product Developments
Product development in the APAC mammography industry is primarily focused on enhancing diagnostic accuracy, patient comfort, and workflow efficiency. Innovations are centered around advanced detector technologies, AI-powered image analysis software, and ergonomic designs for improved patient positioning. The integration of AI promises to aid radiologists in detecting suspicious lesions with greater speed and precision, thereby reducing interpretation time and potential errors. Furthermore, advancements in dose reduction technologies are making mammography safer, encouraging wider adoption. These developments provide a competitive advantage by offering superior clinical outcomes and a more streamlined patient experience, directly addressing the evolving needs of both healthcare providers and patients.
Key Drivers of APAC Mammography Industry Growth
The growth of the APAC mammography industry is propelled by several interconnected factors. Firstly, the increasing incidence and prevalence of breast cancer across the region are creating a substantial demand for diagnostic services. Secondly, a growing awareness among women about the importance of early detection, fostered by public health campaigns and accessible information, is driving patient volume. Thirdly, substantial government investments in healthcare infrastructure and the implementation of national breast cancer screening programs, particularly in countries like China and India, are crucial growth catalysts. Finally, technological advancements, such as the widespread adoption of digital mammography and the increasing integration of AI, are improving diagnostic accuracy and efficiency, making these systems more attractive to healthcare providers.
Challenges in the APAC Mammography Industry Market
Despite the positive growth trajectory, the APAC mammography industry faces several challenges. High initial costs of advanced digital mammography and DBT systems can be a significant barrier for smaller healthcare facilities and those in less developed regions. Limited availability of trained radiographers and radiologists, particularly in remote areas, can hinder the widespread adoption and effective utilization of these sophisticated technologies. Inadequate healthcare infrastructure in some developing nations, coupled with variable regulatory frameworks across different countries, can create inconsistencies in standards and accessibility. Furthermore, patient apprehension and awareness gaps regarding the necessity and benefits of regular mammography screening persist in certain segments of the population, requiring ongoing educational efforts.
Emerging Opportunities in APAC Mammography Industry
Emerging opportunities in the APAC mammography industry are abundant, driven by a confluence of technological advancements and evolving healthcare demands. The increasing adoption of AI-powered diagnostic tools presents a significant opportunity to enhance workflow efficiency and diagnostic accuracy, leading to earlier and more precise detection of breast cancer. Strategic partnerships between mammography equipment manufacturers and AI software developers are expected to proliferate. Furthermore, the growing demand for 3D mammography (DBT), due to its superior diagnostic performance, offers substantial market expansion potential. The expansion of tele-radiology services can bridge geographical gaps, enabling remote areas to access expert mammography interpretation. Finally, the increasing focus on personalized medicine and risk assessment in breast cancer screening opens avenues for integrated diagnostic solutions.
Leading Players in the APAC Mammography Industry Sector
- GE Healthcare
- Hologic Inc
- Koninklijke Philips N V
- Siemens Healthineers AG
- Konica Minolta Inc
- Canon Medical Systems Corporation
- Fujifilm Holdings Corporation
- Carestream Health
- Metaltronica S p A
- Planmed Oy
Key Milestones in APAC Mammography Industry Industry
- 2019: Increased adoption of AI in mammography interpretation software gains traction in key markets like Japan and South Korea.
- 2020: Several APAC countries launch or expand national breast cancer screening programs, boosting demand for mammography equipment.
- 2021: Growing awareness of Digital Breast Tomosynthesis (DBT) leads to a significant increase in installations in China and India.
- 2022: Major manufacturers focus on developing more compact and cost-effective mammography solutions for emerging markets.
- 2023: Regulatory approvals for advanced AI algorithms in mammography analysis accelerate market entry.
- 2024: Increased M&A activities focus on acquiring companies with cutting-edge AI and digital imaging technologies.
Strategic Outlook for APAC Mammography Industry Market
The strategic outlook for the APAC mammography industry is highly optimistic, driven by sustained demand for early breast cancer detection and continuous technological innovation. Growth accelerators include the continued expansion of digital mammography and DBT systems, fueled by their proven diagnostic advantages and increasing affordability. The integration of AI for enhanced image analysis and workflow optimization will be a key differentiator for leading players. Furthermore, government initiatives aimed at improving healthcare accessibility and addressing the rising burden of breast cancer will continue to provide a fertile ground for market growth. Companies that focus on developing user-friendly, cost-effective, and technologically advanced solutions, coupled with robust service and support networks, are best positioned to capitalize on the burgeoning opportunities within this dynamic market.
APAC Mammography Industry Segmentation
-
1. Product Type
- 1.1. Digital Systems
- 1.2. Analog Systems
- 1.3. Breast Tomosynthesis
- 1.4. Film Screen Systems
- 1.5. Other Product Types
-
2. End Users
- 2.1. Hospitals
- 2.2. Diagnostic Centers
- 2.3. Others
-
3. Geography
-
3.1. Asia-Pacific
- 3.1.1. China
- 3.1.2. Japan
- 3.1.3. India
- 3.1.4. Australia
- 3.1.5. South korea
- 3.1.6. Rest of Asia-Pacific
-
3.1. Asia-Pacific
APAC Mammography Industry Segmentation By Geography
-
1. Asia Pacific
- 1.1. China
- 1.2. Japan
- 1.3. India
- 1.4. Australia
- 1.5. South korea
- 1.6. Rest of Asia Pacific
APAC Mammography Industry Regional Market Share
Geographic Coverage of APAC Mammography Industry
APAC Mammography Industry REPORT HIGHLIGHTS
| Aspects | Details |
|---|---|
| Study Period | 2020-2034 |
| Base Year | 2025 |
| Estimated Year | 2026 |
| Forecast Period | 2026-2034 |
| Historical Period | 2020-2025 |
| Growth Rate | CAGR of 9.87% from 2020-2034 |
| Segmentation |
|
Table of Contents
- 1. Introduction
- 1.1. Research Scope
- 1.2. Market Segmentation
- 1.3. Research Methodology
- 1.4. Definitions and Assumptions
- 2. Executive Summary
- 2.1. Introduction
- 3. Market Dynamics
- 3.1. Introduction
- 3.2. Market Drivers
- 3.2.1. ; Rising Incidences of Breast Cancer; Advancements in the Technologies of Breast Imaging Modalities
- 3.3. Market Restrains
- 3.3.1. ; High Cost of Imaging Devices; Risk of Adverse Effects of Radiation Exposure
- 3.4. Market Trends
- 3.4.1. Digital Mammography Segment is Expected to Hold the Largest Market Share in the Asia-Pacifc Mammography Market
- 4. Market Factor Analysis
- 4.1. Porters Five Forces
- 4.2. Supply/Value Chain
- 4.3. PESTEL analysis
- 4.4. Market Entropy
- 4.5. Patent/Trademark Analysis
- 5. Global APAC Mammography Industry Analysis, Insights and Forecast, 2020-2032
- 5.1. Market Analysis, Insights and Forecast - by Product Type
- 5.1.1. Digital Systems
- 5.1.2. Analog Systems
- 5.1.3. Breast Tomosynthesis
- 5.1.4. Film Screen Systems
- 5.1.5. Other Product Types
- 5.2. Market Analysis, Insights and Forecast - by End Users
- 5.2.1. Hospitals
- 5.2.2. Diagnostic Centers
- 5.2.3. Others
- 5.3. Market Analysis, Insights and Forecast - by Geography
- 5.3.1. Asia-Pacific
- 5.3.1.1. China
- 5.3.1.2. Japan
- 5.3.1.3. India
- 5.3.1.4. Australia
- 5.3.1.5. South korea
- 5.3.1.6. Rest of Asia-Pacific
- 5.3.1. Asia-Pacific
- 5.4. Market Analysis, Insights and Forecast - by Region
- 5.4.1. Asia Pacific
- 5.1. Market Analysis, Insights and Forecast - by Product Type
- 6. Competitive Analysis
- 6.1. Global Market Share Analysis 2025
- 6.2. Company Profiles
- 6.2.1 Konica Minolta Inc
- 6.2.1.1. Overview
- 6.2.1.2. Products
- 6.2.1.3. SWOT Analysis
- 6.2.1.4. Recent Developments
- 6.2.1.5. Financials (Based on Availability)
- 6.2.2 GE Healthcare
- 6.2.2.1. Overview
- 6.2.2.2. Products
- 6.2.2.3. SWOT Analysis
- 6.2.2.4. Recent Developments
- 6.2.2.5. Financials (Based on Availability)
- 6.2.3 Hologic Inc
- 6.2.3.1. Overview
- 6.2.3.2. Products
- 6.2.3.3. SWOT Analysis
- 6.2.3.4. Recent Developments
- 6.2.3.5. Financials (Based on Availability)
- 6.2.4 Metaltronica S p A
- 6.2.4.1. Overview
- 6.2.4.2. Products
- 6.2.4.3. SWOT Analysis
- 6.2.4.4. Recent Developments
- 6.2.4.5. Financials (Based on Availability)
- 6.2.5 Koninklijke Philips N V
- 6.2.5.1. Overview
- 6.2.5.2. Products
- 6.2.5.3. SWOT Analysis
- 6.2.5.4. Recent Developments
- 6.2.5.5. Financials (Based on Availability)
- 6.2.6 Siemens Healthineers AG
- 6.2.6.1. Overview
- 6.2.6.2. Products
- 6.2.6.3. SWOT Analysis
- 6.2.6.4. Recent Developments
- 6.2.6.5. Financials (Based on Availability)
- 6.2.7 Carestream Health
- 6.2.7.1. Overview
- 6.2.7.2. Products
- 6.2.7.3. SWOT Analysis
- 6.2.7.4. Recent Developments
- 6.2.7.5. Financials (Based on Availability)
- 6.2.8 Planmed Oy
- 6.2.8.1. Overview
- 6.2.8.2. Products
- 6.2.8.3. SWOT Analysis
- 6.2.8.4. Recent Developments
- 6.2.8.5. Financials (Based on Availability)
- 6.2.9 Canon Medical Systems Corporation
- 6.2.9.1. Overview
- 6.2.9.2. Products
- 6.2.9.3. SWOT Analysis
- 6.2.9.4. Recent Developments
- 6.2.9.5. Financials (Based on Availability)
- 6.2.10 Fujifilm Holdings Corporation
- 6.2.10.1. Overview
- 6.2.10.2. Products
- 6.2.10.3. SWOT Analysis
- 6.2.10.4. Recent Developments
- 6.2.10.5. Financials (Based on Availability)
- 6.2.1 Konica Minolta Inc
List of Figures
- Figure 1: Global APAC Mammography Industry Revenue Breakdown (Million, %) by Region 2025 & 2033
- Figure 2: Asia Pacific APAC Mammography Industry Revenue (Million), by Product Type 2025 & 2033
- Figure 3: Asia Pacific APAC Mammography Industry Revenue Share (%), by Product Type 2025 & 2033
- Figure 4: Asia Pacific APAC Mammography Industry Revenue (Million), by End Users 2025 & 2033
- Figure 5: Asia Pacific APAC Mammography Industry Revenue Share (%), by End Users 2025 & 2033
- Figure 6: Asia Pacific APAC Mammography Industry Revenue (Million), by Geography 2025 & 2033
- Figure 7: Asia Pacific APAC Mammography Industry Revenue Share (%), by Geography 2025 & 2033
- Figure 8: Asia Pacific APAC Mammography Industry Revenue (Million), by Country 2025 & 2033
- Figure 9: Asia Pacific APAC Mammography Industry Revenue Share (%), by Country 2025 & 2033
List of Tables
- Table 1: Global APAC Mammography Industry Revenue Million Forecast, by Product Type 2020 & 2033
- Table 2: Global APAC Mammography Industry Revenue Million Forecast, by End Users 2020 & 2033
- Table 3: Global APAC Mammography Industry Revenue Million Forecast, by Geography 2020 & 2033
- Table 4: Global APAC Mammography Industry Revenue Million Forecast, by Region 2020 & 2033
- Table 5: Global APAC Mammography Industry Revenue Million Forecast, by Product Type 2020 & 2033
- Table 6: Global APAC Mammography Industry Revenue Million Forecast, by End Users 2020 & 2033
- Table 7: Global APAC Mammography Industry Revenue Million Forecast, by Geography 2020 & 2033
- Table 8: Global APAC Mammography Industry Revenue Million Forecast, by Country 2020 & 2033
- Table 9: China APAC Mammography Industry Revenue (Million) Forecast, by Application 2020 & 2033
- Table 10: Japan APAC Mammography Industry Revenue (Million) Forecast, by Application 2020 & 2033
- Table 11: India APAC Mammography Industry Revenue (Million) Forecast, by Application 2020 & 2033
- Table 12: Australia APAC Mammography Industry Revenue (Million) Forecast, by Application 2020 & 2033
- Table 13: South korea APAC Mammography Industry Revenue (Million) Forecast, by Application 2020 & 2033
- Table 14: Rest of Asia Pacific APAC Mammography Industry Revenue (Million) Forecast, by Application 2020 & 2033
Frequently Asked Questions
1. What is the projected Compound Annual Growth Rate (CAGR) of the APAC Mammography Industry?
The projected CAGR is approximately 9.87%.
2. Which companies are prominent players in the APAC Mammography Industry?
Key companies in the market include Konica Minolta Inc, GE Healthcare, Hologic Inc, Metaltronica S p A, Koninklijke Philips N V, Siemens Healthineers AG, Carestream Health, Planmed Oy, Canon Medical Systems Corporation, Fujifilm Holdings Corporation.
3. What are the main segments of the APAC Mammography Industry?
The market segments include Product Type, End Users, Geography.
4. Can you provide details about the market size?
The market size is estimated to be USD 521.17 Million as of 2022.
5. What are some drivers contributing to market growth?
; Rising Incidences of Breast Cancer; Advancements in the Technologies of Breast Imaging Modalities.
6. What are the notable trends driving market growth?
Digital Mammography Segment is Expected to Hold the Largest Market Share in the Asia-Pacifc Mammography Market.
7. Are there any restraints impacting market growth?
; High Cost of Imaging Devices; Risk of Adverse Effects of Radiation Exposure.
8. Can you provide examples of recent developments in the market?
N/A
9. What pricing options are available for accessing the report?
Pricing options include single-user, multi-user, and enterprise licenses priced at USD 4750, USD 5250, and USD 8750 respectively.
10. Is the market size provided in terms of value or volume?
The market size is provided in terms of value, measured in Million.
11. Are there any specific market keywords associated with the report?
Yes, the market keyword associated with the report is "APAC Mammography Industry," which aids in identifying and referencing the specific market segment covered.
12. How do I determine which pricing option suits my needs best?
The pricing options vary based on user requirements and access needs. Individual users may opt for single-user licenses, while businesses requiring broader access may choose multi-user or enterprise licenses for cost-effective access to the report.
13. Are there any additional resources or data provided in the APAC Mammography Industry report?
While the report offers comprehensive insights, it's advisable to review the specific contents or supplementary materials provided to ascertain if additional resources or data are available.
14. How can I stay updated on further developments or reports in the APAC Mammography Industry?
To stay informed about further developments, trends, and reports in the APAC Mammography Industry, consider subscribing to industry newsletters, following relevant companies and organizations, or regularly checking reputable industry news sources and publications.
Methodology
Step 1 - Identification of Relevant Samples Size from Population Database


Step 2 - Approaches for Defining Global Market Size (Value, Volume* & Price*)

Note*: In applicable scenarios
Step 3 - Data Sources
Primary Research
- Web Analytics
- Survey Reports
- Research Institute
- Latest Research Reports
- Opinion Leaders
Secondary Research
- Annual Reports
- White Paper
- Latest Press Release
- Industry Association
- Paid Database
- Investor Presentations

Step 4 - Data Triangulation
Involves using different sources of information in order to increase the validity of a study
These sources are likely to be stakeholders in a program - participants, other researchers, program staff, other community members, and so on.
Then we put all data in single framework & apply various statistical tools to find out the dynamic on the market.
During the analysis stage, feedback from the stakeholder groups would be compared to determine areas of agreement as well as areas of divergence