

Key Insights
The US Electric Vehicle (EV) battery pack market is experiencing significant expansion, driven by increasing EV adoption across passenger cars, light commercial vehicles (LCVs), buses, and medium & heavy-duty trucks (M&HDTs). Key growth drivers include government incentives, stringent emission regulations, and rising consumer demand for sustainable transportation. The market is projected to grow at a CAGR of 10.3%, reaching a size of $16.04 billion by 2025.
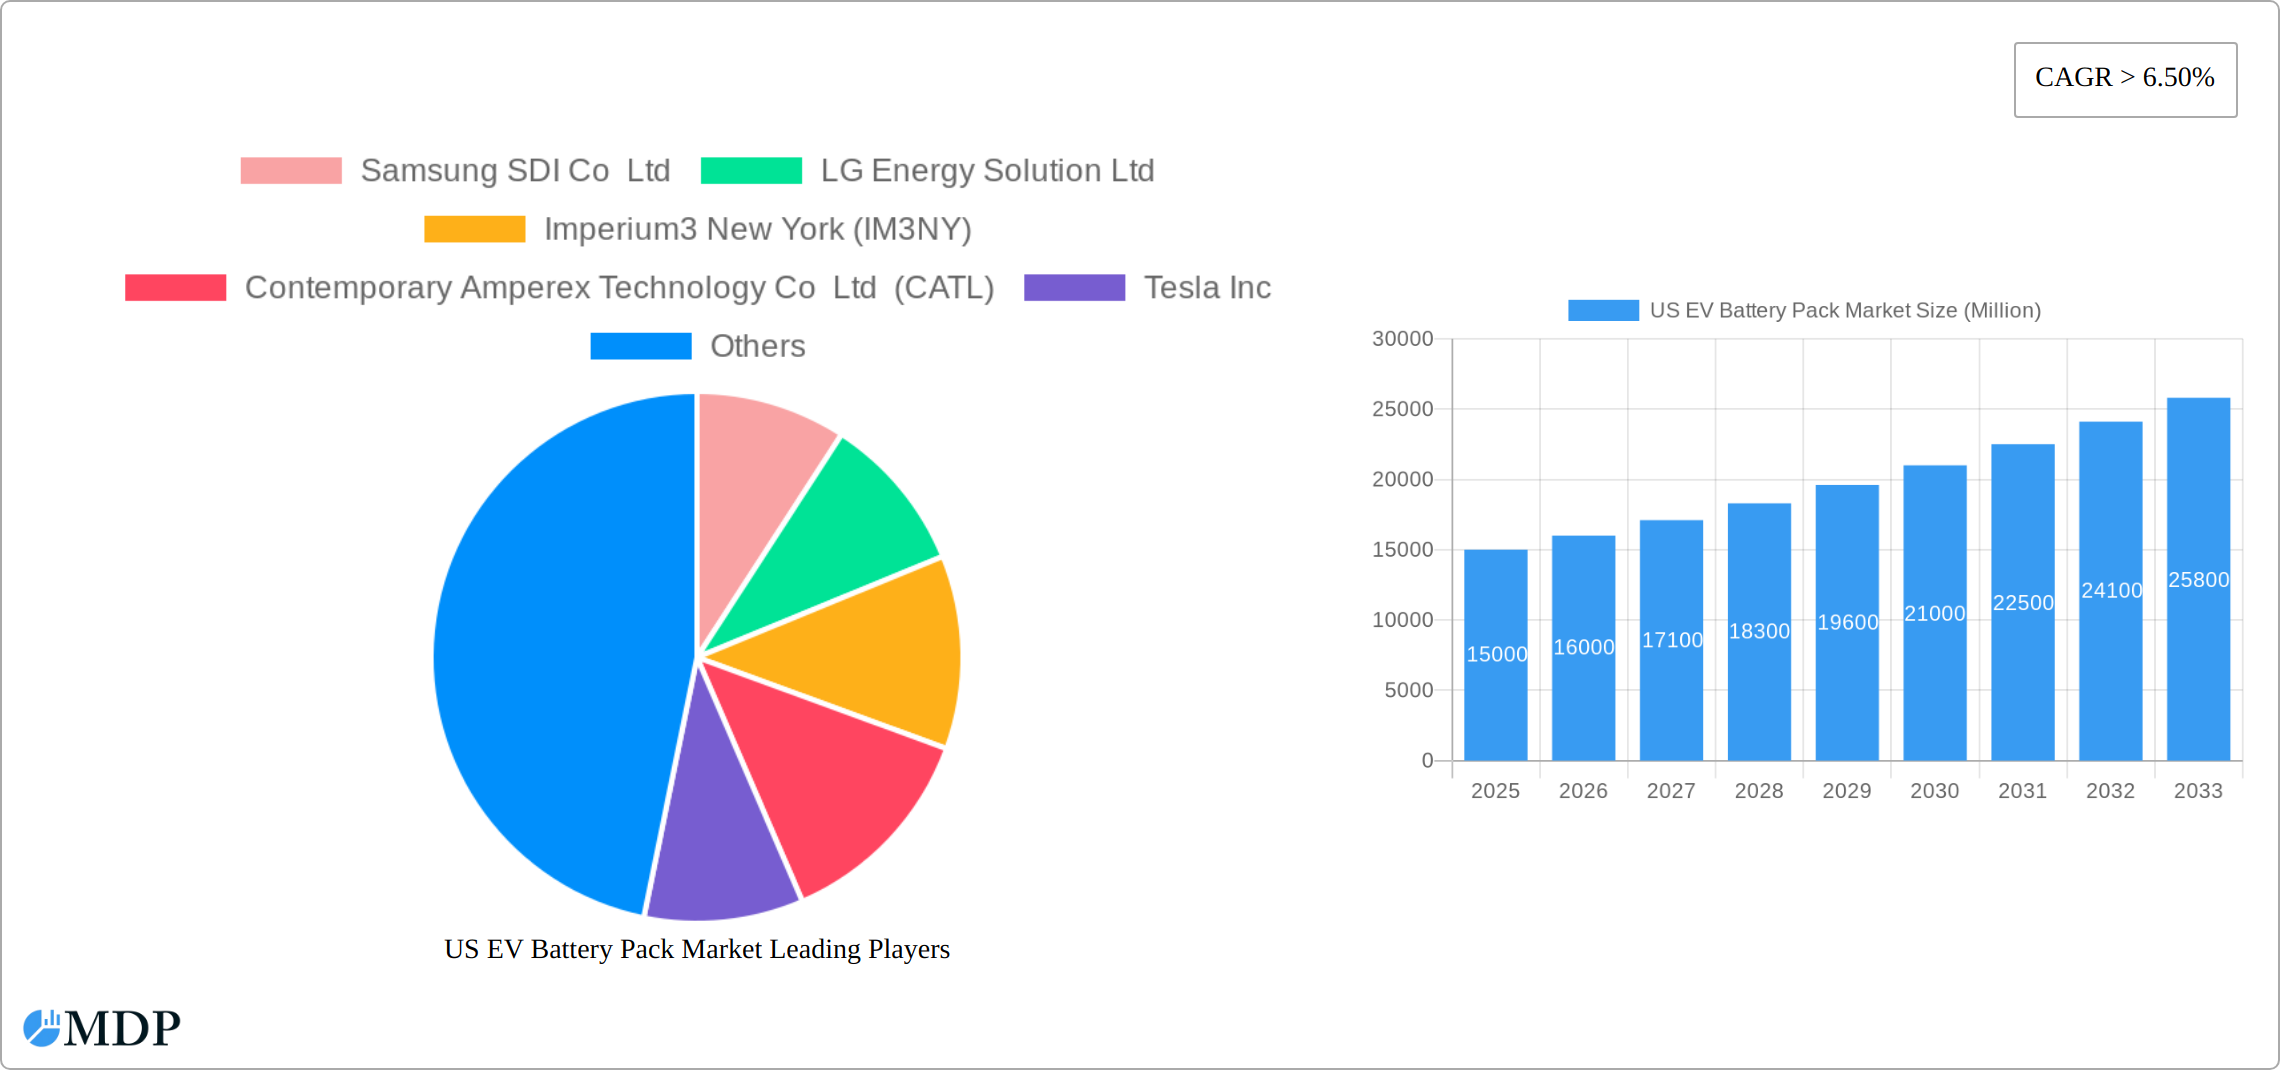
US EV Battery Pack Market Market Size (In Billion)
Advancements in battery chemistry (e.g., LFP, NCM), improved energy density for extended range, and the development of innovative battery form factors (cylindrical, pouch, prismatic) tailored for various vehicle applications are fueling market growth. Enhanced manufacturing processes, such as laser welding, are also contributing to efficiency and cost reduction. Despite challenges in raw material availability and cost (lithium, cobalt, nickel), the market is set for sustained expansion.

US EV Battery Pack Market Company Market Share
Segmentation by battery capacity (15 kWh to over 80 kWh), battery chemistry (LFP, NCA, NCM), and vehicle type indicates varied growth trajectories, with higher-capacity packs for larger vehicles showing accelerated adoption.
The competitive landscape features established players like Samsung SDI, LG Energy Solution, CATL, Tesla, and SK Innovation, alongside innovative emerging companies. Continuous investment in R&D focuses on enhancing battery performance, reducing costs, and improving sustainability. Regional adoption trends, led by states like California, New York, and Texas, are shaping demand. The forecast period (2025-2033) anticipates sustained demand growth, influenced by evolving consumer preferences, technological breakthroughs, and supportive policies. Market expansion remains contingent on addressing supply chain stability, raw material price volatility, and the development of efficient battery recycling infrastructure.
US EV Battery Pack Market Report: 2019-2033
This comprehensive report provides an in-depth analysis of the US EV battery pack market, offering actionable insights for stakeholders across the value chain. From market dynamics and leading players to emerging opportunities and future forecasts, this report is essential for businesses navigating this rapidly evolving landscape. The study period covers 2019-2033, with 2025 as the base and estimated year.
US EV Battery Pack Market Dynamics & Concentration
The US EV battery pack market is characterized by intense competition and significant innovation. Market concentration is moderate, with key players such as Samsung SDI Co Ltd, LG Energy Solution Ltd, and CATL holding substantial market share, but smaller players also contribute significantly. The market is driven by increasing EV adoption, stringent emission regulations, and government incentives promoting electric mobility. However, challenges include raw material price volatility, supply chain complexities, and the need for advancements in battery technology to improve energy density, lifespan, and charging speeds. M&A activity has been significant in recent years, with xx deals recorded between 2019 and 2024, reflecting strategic efforts to consolidate market share and secure access to critical resources. The market is also influenced by product substitutes, such as fuel cell vehicles, which pose a challenge.
- Market Concentration: Moderate, with top 5 players holding approximately xx% market share (2024).
- Innovation Drivers: Government funding for R&D, increasing demand for high-performance batteries, and technological advancements in battery chemistry and manufacturing processes.
- Regulatory Frameworks: Stringent emissions standards and policies incentivizing EV adoption shape the market landscape.
- Product Substitutes: Fuel cell vehicles and alternative transportation modes represent potential competitive threats.
- End-User Trends: Growing preference for EVs among consumers and businesses due to environmental concerns and cost savings.
- M&A Activities: xx deals closed between 2019 and 2024, indicating significant industry consolidation.
US EV Battery Pack Market Industry Trends & Analysis
The US EV battery pack market is currently in a phase of dynamic expansion, projected to witness a substantial Compound Annual Growth Rate (CAGR) of [Insert Specific CAGR Here]% during the forecast period spanning from 2025 to 2033. This upward trajectory is primarily propelled by a confluence of factors, most notably the escalating demand for electric vehicles (EVs). This demand is intrinsically linked to heightened environmental consciousness among consumers and increasingly stringent government regulations aimed at curbing emissions. Concurrently, rapid technological advancements are acting as significant catalysts. Innovations such as the development of next-generation solid-state batteries, promising enhanced safety and energy density, and sophisticated battery management systems (BMS) that optimize performance and longevity, are actively fueling market growth. Consumer preferences are demonstrably shifting towards EVs that offer extended driving ranges and quicker charging capabilities, compelling automotive manufacturers to prioritize continuous innovation and product development. The competitive landscape is characterized by its dynamism, with a vigorous interplay between established automotive giants and agile new entrants. These players are actively vying for market share through a combination of groundbreaking technological developments, strategic collaborations, and aggressive pricing strategies. The penetration of EVs into the broader automotive market continues its upward climb, with projections indicating that [Insert Specific Percentage Here]% of new vehicle sales will be electric by the year 2033. The market is intricately segmented across various dimensions to facilitate a granular understanding, including: Battery Chemistry (Lithium Iron Phosphate (LFP), Nickel Cobalt Aluminum (NCA), Nickel Cobalt Manganese (NCM), Nickel Manganese Cobalt (NMC), and Others), Capacity (categorized as Less than 15 kWh, 15 kWh to 40 kWh, 40 kWh to 80 kWh, and Above 80 kWh), Battery Form (encompassing Cylindrical, Pouch, and Prismatic cells), Manufacturing Method (Laser and Wire welding), Component Type (Anode, Cathode, Electrolyte, and Separator), Material Type (Cobalt, Lithium, Manganese, Natural Graphite, Nickel, and Other Critical Materials), Vehicle Body Type (Passenger Cars, Light Commercial Vehicles (LCVs), Medium & Heavy-Duty Trucks (M&HDT), and Buses), and Propulsion Type (Battery Electric Vehicles (BEV) and Plug-in Hybrid Electric Vehicles (PHEV)).
Leading Markets & Segments in US EV Battery Pack Market
The passenger car segment dominates the US EV battery pack market, accounting for approximately xx% of the total market value in 2024. Within battery chemistry, NCM and NMC chemistries hold the largest market share due to their high energy density. The 40 kWh to 80 kWh capacity segment is also a significant contributor to market growth, driven by increasing demand for EVs with extended ranges. Prismatic battery form factor is currently the most widely adopted in the market, due to its cost-effectiveness and suitability for high energy density requirements.
- Key Drivers for Passenger Car Segment: Stringent emission regulations, government incentives, and growing consumer preference for electric vehicles.
- Key Drivers for NCM/NMC Chemistry: High energy density, suitable for long-range EVs.
- Key Drivers for 40 kWh to 80 kWh Capacity Segment: Balance between range and cost-effectiveness.
- Key Drivers for Prismatic Battery Form Factor: Cost efficiency and high energy density capabilities.
- Dominance Analysis: The passenger car segment’s dominance is expected to continue throughout the forecast period, driven by rising consumer demand and increasing affordability of EVs.
US EV Battery Pack Market Product Developments
Recent product developments focus on improving energy density, fast charging capabilities, and battery lifespan. Solid-state batteries, advancements in battery management systems, and the use of novel materials are key technological trends. These innovations enhance the performance, safety, and cost-effectiveness of EV battery packs, increasing their market appeal.
Key Drivers of US EV Battery Pack Market Growth
The expansion of the US EV battery pack market is significantly propelled by two primary forces: continuous technological advancements in battery chemistry and manufacturing processes, and robust governmental support. These include a spectrum of incentives and regulations meticulously designed to accelerate the adoption of electric vehicles. Furthermore, the discernible decrease in battery costs, coupled with a growing consumer awareness and appreciation for the environmental benefits associated with EVs, are also substantial contributors to this ongoing market growth.
Challenges in the US EV Battery Pack Market Market
A primary concern within the US EV battery pack market revolves around the inherent volatility of raw material prices, particularly impacting critical elements like lithium and cobalt. Disruptions within the global supply chain, exacerbated by geopolitical uncertainties, also pose a significant threat to the consistent availability and cost-effectiveness of essential battery components. Moreover, the intense competition among manufacturers necessitates a constant commitment to innovation and product improvement to sustain and enhance market competitiveness, presenting a continuous challenge for industry players.
Emerging Opportunities in US EV Battery Pack Market
The development and eventual commercialization of solid-state batteries represent a significant long-term opportunity, promising enhanced performance, safety, and energy density. Alongside this, advancements in battery recycling technologies offer a sustainable pathway for resource management and cost reduction. Strategic alliances and partnerships formed between battery manufacturers, prominent automotive companies, and suppliers of raw materials are poised to play a pivotal role in ensuring a stable and secure supply of critical battery materials. Furthermore, the strategic expansion into burgeoning segments, such as commercial vehicles and the broader energy storage solutions market, presents considerable avenues for sustained growth and diversification.
Leading Players in the US EV Battery Pack Market Sector
- Samsung SDI Co Ltd (Samsung SDI)
- LG Energy Solution Ltd (LG Energy Solution)
- Imperium3 New York (IM3NY)
- Contemporary Amperex Technology Co Ltd (CATL) (CATL)
- Tesla Inc (Tesla)
- SK Innovation Co Ltd (SK Innovation)
- Ambri Inc
- Sila Nanotechnologies Inc (Sila Nanotechnologies)
- Panasonic Holdings Corporation (Panasonic)
- Envision AESC Japan Co Ltd
Key Milestones in US EV Battery Pack Market Industry
- January 2023: Tesla announces a USD 3.6 billion investment to expand Gigafactory Nevada, including a 100 GWh 4680 cell factory. This significantly increases US battery production capacity.
- March 2023: Tesla reportedly in talks with CATL to build a battery factory in the U.S., indicating potential for further investment and market expansion.
- June 2023: CATL commits USD 1.4 billion to help Bolivia develop its lithium reserves, securing a crucial raw material supply for future battery production.
Strategic Outlook for US EV Battery Pack Market Market
The US EV battery pack market is positioned for substantial growth, fueled by the accelerating adoption of electric vehicles and the relentless pace of innovation in battery technology. Success in this highly competitive arena will hinge on the ability of companies to forge strategic partnerships, make significant investments in research and development (R&D), and proactively secure access to critical raw materials. Entities that prioritize innovation, embrace sustainability principles, and focus on cost-effectiveness are optimally positioned to capitalize on the promising long-term growth trajectories anticipated within this market.
US EV Battery Pack Market Segmentation
-
1. Body Type
- 1.1. Bus
- 1.2. LCV
- 1.3. M&HDT
- 1.4. Passenger Car
-
2. Propulsion Type
- 2.1. BEV
- 2.2. PHEV
-
3. Battery Chemistry
- 3.1. LFP
- 3.2. NCA
- 3.3. NCM
- 3.4. NMC
- 3.5. Others
-
4. Capacity
- 4.1. 15 kWh to 40 kWh
- 4.2. 40 kWh to 80 kWh
- 4.3. Above 80 kWh
- 4.4. Less than 15 kWh
-
5. Battery Form
- 5.1. Cylindrical
- 5.2. Pouch
- 5.3. Prismatic
-
6. Method
- 6.1. Laser
- 6.2. Wire
-
7. Component
- 7.1. Anode
- 7.2. Cathode
- 7.3. Electrolyte
- 7.4. Separator
-
8. Material Type
- 8.1. Cobalt
- 8.2. Lithium
- 8.3. Manganese
- 8.4. Natural Graphite
- 8.5. Nickel
- 8.6. Other Materials
US EV Battery Pack Market Segmentation By Geography
-
1. North America
- 1.1. United States
- 1.2. Canada
- 1.3. Mexico
-
2. South America
- 2.1. Brazil
- 2.2. Argentina
- 2.3. Rest of South America
-
3. Europe
- 3.1. United Kingdom
- 3.2. Germany
- 3.3. France
- 3.4. Italy
- 3.5. Spain
- 3.6. Russia
- 3.7. Benelux
- 3.8. Nordics
- 3.9. Rest of Europe
-
4. Middle East & Africa
- 4.1. Turkey
- 4.2. Israel
- 4.3. GCC
- 4.4. North Africa
- 4.5. South Africa
- 4.6. Rest of Middle East & Africa
-
5. Asia Pacific
- 5.1. China
- 5.2. India
- 5.3. Japan
- 5.4. South Korea
- 5.5. ASEAN
- 5.6. Oceania
- 5.7. Rest of Asia Pacific
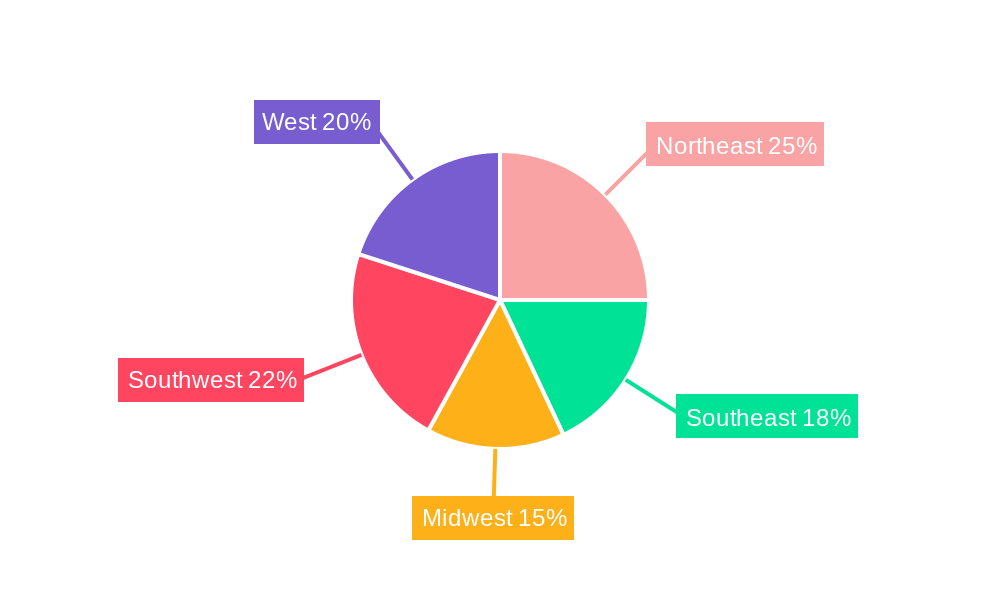
US EV Battery Pack Market Regional Market Share
Geographic Coverage of US EV Battery Pack Market
US EV Battery Pack Market REPORT HIGHLIGHTS
| Aspects | Details |
|---|---|
| Study Period | 2020-2034 |
| Base Year | 2025 |
| Estimated Year | 2026 |
| Forecast Period | 2026-2034 |
| Historical Period | 2020-2025 |
| Growth Rate | CAGR of 10.3% from 2020-2034 |
| Segmentation |
|
Table of Contents
- 1. Introduction
- 1.1. Research Scope
- 1.2. Market Segmentation
- 1.3. Research Methodology
- 1.4. Definitions and Assumptions
- 2. Executive Summary
- 2.1. Introduction
- 3. Market Dynamics
- 3.1. Introduction
- 3.2. Market Drivers
- 3.2.1. Increasing Demand and Sales of Commercial Vehicles is Driving the Market for Hydraulic Systems
- 3.3. Market Restrains
- 3.3.1. Increasing Replacement of Conventional Hydraulic Systems with Fully-electric Hydraulic Systems Acts as a Restraint
- 3.4. Market Trends
- 3.4.1. OTHER KEY INDUSTRY TRENDS COVERED IN THE REPORT
- 4. Market Factor Analysis
- 4.1. Porters Five Forces
- 4.2. Supply/Value Chain
- 4.3. PESTEL analysis
- 4.4. Market Entropy
- 4.5. Patent/Trademark Analysis
- 5. Global US EV Battery Pack Market Analysis, Insights and Forecast, 2020-2032
- 5.1. Market Analysis, Insights and Forecast - by Body Type
- 5.1.1. Bus
- 5.1.2. LCV
- 5.1.3. M&HDT
- 5.1.4. Passenger Car
- 5.2. Market Analysis, Insights and Forecast - by Propulsion Type
- 5.2.1. BEV
- 5.2.2. PHEV
- 5.3. Market Analysis, Insights and Forecast - by Battery Chemistry
- 5.3.1. LFP
- 5.3.2. NCA
- 5.3.3. NCM
- 5.3.4. NMC
- 5.3.5. Others
- 5.4. Market Analysis, Insights and Forecast - by Capacity
- 5.4.1. 15 kWh to 40 kWh
- 5.4.2. 40 kWh to 80 kWh
- 5.4.3. Above 80 kWh
- 5.4.4. Less than 15 kWh
- 5.5. Market Analysis, Insights and Forecast - by Battery Form
- 5.5.1. Cylindrical
- 5.5.2. Pouch
- 5.5.3. Prismatic
- 5.6. Market Analysis, Insights and Forecast - by Method
- 5.6.1. Laser
- 5.6.2. Wire
- 5.7. Market Analysis, Insights and Forecast - by Component
- 5.7.1. Anode
- 5.7.2. Cathode
- 5.7.3. Electrolyte
- 5.7.4. Separator
- 5.8. Market Analysis, Insights and Forecast - by Material Type
- 5.8.1. Cobalt
- 5.8.2. Lithium
- 5.8.3. Manganese
- 5.8.4. Natural Graphite
- 5.8.5. Nickel
- 5.8.6. Other Materials
- 5.9. Market Analysis, Insights and Forecast - by Region
- 5.9.1. North America
- 5.9.2. South America
- 5.9.3. Europe
- 5.9.4. Middle East & Africa
- 5.9.5. Asia Pacific
- 5.1. Market Analysis, Insights and Forecast - by Body Type
- 6. North America US EV Battery Pack Market Analysis, Insights and Forecast, 2020-2032
- 6.1. Market Analysis, Insights and Forecast - by Body Type
- 6.1.1. Bus
- 6.1.2. LCV
- 6.1.3. M&HDT
- 6.1.4. Passenger Car
- 6.2. Market Analysis, Insights and Forecast - by Propulsion Type
- 6.2.1. BEV
- 6.2.2. PHEV
- 6.3. Market Analysis, Insights and Forecast - by Battery Chemistry
- 6.3.1. LFP
- 6.3.2. NCA
- 6.3.3. NCM
- 6.3.4. NMC
- 6.3.5. Others
- 6.4. Market Analysis, Insights and Forecast - by Capacity
- 6.4.1. 15 kWh to 40 kWh
- 6.4.2. 40 kWh to 80 kWh
- 6.4.3. Above 80 kWh
- 6.4.4. Less than 15 kWh
- 6.5. Market Analysis, Insights and Forecast - by Battery Form
- 6.5.1. Cylindrical
- 6.5.2. Pouch
- 6.5.3. Prismatic
- 6.6. Market Analysis, Insights and Forecast - by Method
- 6.6.1. Laser
- 6.6.2. Wire
- 6.7. Market Analysis, Insights and Forecast - by Component
- 6.7.1. Anode
- 6.7.2. Cathode
- 6.7.3. Electrolyte
- 6.7.4. Separator
- 6.8. Market Analysis, Insights and Forecast - by Material Type
- 6.8.1. Cobalt
- 6.8.2. Lithium
- 6.8.3. Manganese
- 6.8.4. Natural Graphite
- 6.8.5. Nickel
- 6.8.6. Other Materials
- 6.1. Market Analysis, Insights and Forecast - by Body Type
- 7. South America US EV Battery Pack Market Analysis, Insights and Forecast, 2020-2032
- 7.1. Market Analysis, Insights and Forecast - by Body Type
- 7.1.1. Bus
- 7.1.2. LCV
- 7.1.3. M&HDT
- 7.1.4. Passenger Car
- 7.2. Market Analysis, Insights and Forecast - by Propulsion Type
- 7.2.1. BEV
- 7.2.2. PHEV
- 7.3. Market Analysis, Insights and Forecast - by Battery Chemistry
- 7.3.1. LFP
- 7.3.2. NCA
- 7.3.3. NCM
- 7.3.4. NMC
- 7.3.5. Others
- 7.4. Market Analysis, Insights and Forecast - by Capacity
- 7.4.1. 15 kWh to 40 kWh
- 7.4.2. 40 kWh to 80 kWh
- 7.4.3. Above 80 kWh
- 7.4.4. Less than 15 kWh
- 7.5. Market Analysis, Insights and Forecast - by Battery Form
- 7.5.1. Cylindrical
- 7.5.2. Pouch
- 7.5.3. Prismatic
- 7.6. Market Analysis, Insights and Forecast - by Method
- 7.6.1. Laser
- 7.6.2. Wire
- 7.7. Market Analysis, Insights and Forecast - by Component
- 7.7.1. Anode
- 7.7.2. Cathode
- 7.7.3. Electrolyte
- 7.7.4. Separator
- 7.8. Market Analysis, Insights and Forecast - by Material Type
- 7.8.1. Cobalt
- 7.8.2. Lithium
- 7.8.3. Manganese
- 7.8.4. Natural Graphite
- 7.8.5. Nickel
- 7.8.6. Other Materials
- 7.1. Market Analysis, Insights and Forecast - by Body Type
- 8. Europe US EV Battery Pack Market Analysis, Insights and Forecast, 2020-2032
- 8.1. Market Analysis, Insights and Forecast - by Body Type
- 8.1.1. Bus
- 8.1.2. LCV
- 8.1.3. M&HDT
- 8.1.4. Passenger Car
- 8.2. Market Analysis, Insights and Forecast - by Propulsion Type
- 8.2.1. BEV
- 8.2.2. PHEV
- 8.3. Market Analysis, Insights and Forecast - by Battery Chemistry
- 8.3.1. LFP
- 8.3.2. NCA
- 8.3.3. NCM
- 8.3.4. NMC
- 8.3.5. Others
- 8.4. Market Analysis, Insights and Forecast - by Capacity
- 8.4.1. 15 kWh to 40 kWh
- 8.4.2. 40 kWh to 80 kWh
- 8.4.3. Above 80 kWh
- 8.4.4. Less than 15 kWh
- 8.5. Market Analysis, Insights and Forecast - by Battery Form
- 8.5.1. Cylindrical
- 8.5.2. Pouch
- 8.5.3. Prismatic
- 8.6. Market Analysis, Insights and Forecast - by Method
- 8.6.1. Laser
- 8.6.2. Wire
- 8.7. Market Analysis, Insights and Forecast - by Component
- 8.7.1. Anode
- 8.7.2. Cathode
- 8.7.3. Electrolyte
- 8.7.4. Separator
- 8.8. Market Analysis, Insights and Forecast - by Material Type
- 8.8.1. Cobalt
- 8.8.2. Lithium
- 8.8.3. Manganese
- 8.8.4. Natural Graphite
- 8.8.5. Nickel
- 8.8.6. Other Materials
- 8.1. Market Analysis, Insights and Forecast - by Body Type
- 9. Middle East & Africa US EV Battery Pack Market Analysis, Insights and Forecast, 2020-2032
- 9.1. Market Analysis, Insights and Forecast - by Body Type
- 9.1.1. Bus
- 9.1.2. LCV
- 9.1.3. M&HDT
- 9.1.4. Passenger Car
- 9.2. Market Analysis, Insights and Forecast - by Propulsion Type
- 9.2.1. BEV
- 9.2.2. PHEV
- 9.3. Market Analysis, Insights and Forecast - by Battery Chemistry
- 9.3.1. LFP
- 9.3.2. NCA
- 9.3.3. NCM
- 9.3.4. NMC
- 9.3.5. Others
- 9.4. Market Analysis, Insights and Forecast - by Capacity
- 9.4.1. 15 kWh to 40 kWh
- 9.4.2. 40 kWh to 80 kWh
- 9.4.3. Above 80 kWh
- 9.4.4. Less than 15 kWh
- 9.5. Market Analysis, Insights and Forecast - by Battery Form
- 9.5.1. Cylindrical
- 9.5.2. Pouch
- 9.5.3. Prismatic
- 9.6. Market Analysis, Insights and Forecast - by Method
- 9.6.1. Laser
- 9.6.2. Wire
- 9.7. Market Analysis, Insights and Forecast - by Component
- 9.7.1. Anode
- 9.7.2. Cathode
- 9.7.3. Electrolyte
- 9.7.4. Separator
- 9.8. Market Analysis, Insights and Forecast - by Material Type
- 9.8.1. Cobalt
- 9.8.2. Lithium
- 9.8.3. Manganese
- 9.8.4. Natural Graphite
- 9.8.5. Nickel
- 9.8.6. Other Materials
- 9.1. Market Analysis, Insights and Forecast - by Body Type
- 10. Asia Pacific US EV Battery Pack Market Analysis, Insights and Forecast, 2020-2032
- 10.1. Market Analysis, Insights and Forecast - by Body Type
- 10.1.1. Bus
- 10.1.2. LCV
- 10.1.3. M&HDT
- 10.1.4. Passenger Car
- 10.2. Market Analysis, Insights and Forecast - by Propulsion Type
- 10.2.1. BEV
- 10.2.2. PHEV
- 10.3. Market Analysis, Insights and Forecast - by Battery Chemistry
- 10.3.1. LFP
- 10.3.2. NCA
- 10.3.3. NCM
- 10.3.4. NMC
- 10.3.5. Others
- 10.4. Market Analysis, Insights and Forecast - by Capacity
- 10.4.1. 15 kWh to 40 kWh
- 10.4.2. 40 kWh to 80 kWh
- 10.4.3. Above 80 kWh
- 10.4.4. Less than 15 kWh
- 10.5. Market Analysis, Insights and Forecast - by Battery Form
- 10.5.1. Cylindrical
- 10.5.2. Pouch
- 10.5.3. Prismatic
- 10.6. Market Analysis, Insights and Forecast - by Method
- 10.6.1. Laser
- 10.6.2. Wire
- 10.7. Market Analysis, Insights and Forecast - by Component
- 10.7.1. Anode
- 10.7.2. Cathode
- 10.7.3. Electrolyte
- 10.7.4. Separator
- 10.8. Market Analysis, Insights and Forecast - by Material Type
- 10.8.1. Cobalt
- 10.8.2. Lithium
- 10.8.3. Manganese
- 10.8.4. Natural Graphite
- 10.8.5. Nickel
- 10.8.6. Other Materials
- 10.1. Market Analysis, Insights and Forecast - by Body Type
- 11. Competitive Analysis
- 11.1. Global Market Share Analysis 2025
- 11.2. Company Profiles
- 11.2.1 Samsung SDI Co Ltd
- 11.2.1.1. Overview
- 11.2.1.2. Products
- 11.2.1.3. SWOT Analysis
- 11.2.1.4. Recent Developments
- 11.2.1.5. Financials (Based on Availability)
- 11.2.2 LG Energy Solution Ltd
- 11.2.2.1. Overview
- 11.2.2.2. Products
- 11.2.2.3. SWOT Analysis
- 11.2.2.4. Recent Developments
- 11.2.2.5. Financials (Based on Availability)
- 11.2.3 Imperium3 New York (IM3NY)
- 11.2.3.1. Overview
- 11.2.3.2. Products
- 11.2.3.3. SWOT Analysis
- 11.2.3.4. Recent Developments
- 11.2.3.5. Financials (Based on Availability)
- 11.2.4 Contemporary Amperex Technology Co Ltd (CATL)
- 11.2.4.1. Overview
- 11.2.4.2. Products
- 11.2.4.3. SWOT Analysis
- 11.2.4.4. Recent Developments
- 11.2.4.5. Financials (Based on Availability)
- 11.2.5 Tesla Inc
- 11.2.5.1. Overview
- 11.2.5.2. Products
- 11.2.5.3. SWOT Analysis
- 11.2.5.4. Recent Developments
- 11.2.5.5. Financials (Based on Availability)
- 11.2.6 SK Innovation Co Ltd
- 11.2.6.1. Overview
- 11.2.6.2. Products
- 11.2.6.3. SWOT Analysis
- 11.2.6.4. Recent Developments
- 11.2.6.5. Financials (Based on Availability)
- 11.2.7 Ambri Inc
- 11.2.7.1. Overview
- 11.2.7.2. Products
- 11.2.7.3. SWOT Analysis
- 11.2.7.4. Recent Developments
- 11.2.7.5. Financials (Based on Availability)
- 11.2.8 Sila Nanotechnologies Inc
- 11.2.8.1. Overview
- 11.2.8.2. Products
- 11.2.8.3. SWOT Analysis
- 11.2.8.4. Recent Developments
- 11.2.8.5. Financials (Based on Availability)
- 11.2.9 Panasonic Holdings Corporation
- 11.2.9.1. Overview
- 11.2.9.2. Products
- 11.2.9.3. SWOT Analysis
- 11.2.9.4. Recent Developments
- 11.2.9.5. Financials (Based on Availability)
- 11.2.10 Envision AESC Japan Co Ltd
- 11.2.10.1. Overview
- 11.2.10.2. Products
- 11.2.10.3. SWOT Analysis
- 11.2.10.4. Recent Developments
- 11.2.10.5. Financials (Based on Availability)
- 11.2.1 Samsung SDI Co Ltd
List of Figures
- Figure 1: Global US EV Battery Pack Market Revenue Breakdown (billion, %) by Region 2025 & 2033
- Figure 2: North America US EV Battery Pack Market Revenue (billion), by Body Type 2025 & 2033
- Figure 3: North America US EV Battery Pack Market Revenue Share (%), by Body Type 2025 & 2033
- Figure 4: North America US EV Battery Pack Market Revenue (billion), by Propulsion Type 2025 & 2033
- Figure 5: North America US EV Battery Pack Market Revenue Share (%), by Propulsion Type 2025 & 2033
- Figure 6: North America US EV Battery Pack Market Revenue (billion), by Battery Chemistry 2025 & 2033
- Figure 7: North America US EV Battery Pack Market Revenue Share (%), by Battery Chemistry 2025 & 2033
- Figure 8: North America US EV Battery Pack Market Revenue (billion), by Capacity 2025 & 2033
- Figure 9: North America US EV Battery Pack Market Revenue Share (%), by Capacity 2025 & 2033
- Figure 10: North America US EV Battery Pack Market Revenue (billion), by Battery Form 2025 & 2033
- Figure 11: North America US EV Battery Pack Market Revenue Share (%), by Battery Form 2025 & 2033
- Figure 12: North America US EV Battery Pack Market Revenue (billion), by Method 2025 & 2033
- Figure 13: North America US EV Battery Pack Market Revenue Share (%), by Method 2025 & 2033
- Figure 14: North America US EV Battery Pack Market Revenue (billion), by Component 2025 & 2033
- Figure 15: North America US EV Battery Pack Market Revenue Share (%), by Component 2025 & 2033
- Figure 16: North America US EV Battery Pack Market Revenue (billion), by Material Type 2025 & 2033
- Figure 17: North America US EV Battery Pack Market Revenue Share (%), by Material Type 2025 & 2033
- Figure 18: North America US EV Battery Pack Market Revenue (billion), by Country 2025 & 2033
- Figure 19: North America US EV Battery Pack Market Revenue Share (%), by Country 2025 & 2033
- Figure 20: South America US EV Battery Pack Market Revenue (billion), by Body Type 2025 & 2033
- Figure 21: South America US EV Battery Pack Market Revenue Share (%), by Body Type 2025 & 2033
- Figure 22: South America US EV Battery Pack Market Revenue (billion), by Propulsion Type 2025 & 2033
- Figure 23: South America US EV Battery Pack Market Revenue Share (%), by Propulsion Type 2025 & 2033
- Figure 24: South America US EV Battery Pack Market Revenue (billion), by Battery Chemistry 2025 & 2033
- Figure 25: South America US EV Battery Pack Market Revenue Share (%), by Battery Chemistry 2025 & 2033
- Figure 26: South America US EV Battery Pack Market Revenue (billion), by Capacity 2025 & 2033
- Figure 27: South America US EV Battery Pack Market Revenue Share (%), by Capacity 2025 & 2033
- Figure 28: South America US EV Battery Pack Market Revenue (billion), by Battery Form 2025 & 2033
- Figure 29: South America US EV Battery Pack Market Revenue Share (%), by Battery Form 2025 & 2033
- Figure 30: South America US EV Battery Pack Market Revenue (billion), by Method 2025 & 2033
- Figure 31: South America US EV Battery Pack Market Revenue Share (%), by Method 2025 & 2033
- Figure 32: South America US EV Battery Pack Market Revenue (billion), by Component 2025 & 2033
- Figure 33: South America US EV Battery Pack Market Revenue Share (%), by Component 2025 & 2033
- Figure 34: South America US EV Battery Pack Market Revenue (billion), by Material Type 2025 & 2033
- Figure 35: South America US EV Battery Pack Market Revenue Share (%), by Material Type 2025 & 2033
- Figure 36: South America US EV Battery Pack Market Revenue (billion), by Country 2025 & 2033
- Figure 37: South America US EV Battery Pack Market Revenue Share (%), by Country 2025 & 2033
- Figure 38: Europe US EV Battery Pack Market Revenue (billion), by Body Type 2025 & 2033
- Figure 39: Europe US EV Battery Pack Market Revenue Share (%), by Body Type 2025 & 2033
- Figure 40: Europe US EV Battery Pack Market Revenue (billion), by Propulsion Type 2025 & 2033
- Figure 41: Europe US EV Battery Pack Market Revenue Share (%), by Propulsion Type 2025 & 2033
- Figure 42: Europe US EV Battery Pack Market Revenue (billion), by Battery Chemistry 2025 & 2033
- Figure 43: Europe US EV Battery Pack Market Revenue Share (%), by Battery Chemistry 2025 & 2033
- Figure 44: Europe US EV Battery Pack Market Revenue (billion), by Capacity 2025 & 2033
- Figure 45: Europe US EV Battery Pack Market Revenue Share (%), by Capacity 2025 & 2033
- Figure 46: Europe US EV Battery Pack Market Revenue (billion), by Battery Form 2025 & 2033
- Figure 47: Europe US EV Battery Pack Market Revenue Share (%), by Battery Form 2025 & 2033
- Figure 48: Europe US EV Battery Pack Market Revenue (billion), by Method 2025 & 2033
- Figure 49: Europe US EV Battery Pack Market Revenue Share (%), by Method 2025 & 2033
- Figure 50: Europe US EV Battery Pack Market Revenue (billion), by Component 2025 & 2033
- Figure 51: Europe US EV Battery Pack Market Revenue Share (%), by Component 2025 & 2033
- Figure 52: Europe US EV Battery Pack Market Revenue (billion), by Material Type 2025 & 2033
- Figure 53: Europe US EV Battery Pack Market Revenue Share (%), by Material Type 2025 & 2033
- Figure 54: Europe US EV Battery Pack Market Revenue (billion), by Country 2025 & 2033
- Figure 55: Europe US EV Battery Pack Market Revenue Share (%), by Country 2025 & 2033
- Figure 56: Middle East & Africa US EV Battery Pack Market Revenue (billion), by Body Type 2025 & 2033
- Figure 57: Middle East & Africa US EV Battery Pack Market Revenue Share (%), by Body Type 2025 & 2033
- Figure 58: Middle East & Africa US EV Battery Pack Market Revenue (billion), by Propulsion Type 2025 & 2033
- Figure 59: Middle East & Africa US EV Battery Pack Market Revenue Share (%), by Propulsion Type 2025 & 2033
- Figure 60: Middle East & Africa US EV Battery Pack Market Revenue (billion), by Battery Chemistry 2025 & 2033
- Figure 61: Middle East & Africa US EV Battery Pack Market Revenue Share (%), by Battery Chemistry 2025 & 2033
- Figure 62: Middle East & Africa US EV Battery Pack Market Revenue (billion), by Capacity 2025 & 2033
- Figure 63: Middle East & Africa US EV Battery Pack Market Revenue Share (%), by Capacity 2025 & 2033
- Figure 64: Middle East & Africa US EV Battery Pack Market Revenue (billion), by Battery Form 2025 & 2033
- Figure 65: Middle East & Africa US EV Battery Pack Market Revenue Share (%), by Battery Form 2025 & 2033
- Figure 66: Middle East & Africa US EV Battery Pack Market Revenue (billion), by Method 2025 & 2033
- Figure 67: Middle East & Africa US EV Battery Pack Market Revenue Share (%), by Method 2025 & 2033
- Figure 68: Middle East & Africa US EV Battery Pack Market Revenue (billion), by Component 2025 & 2033
- Figure 69: Middle East & Africa US EV Battery Pack Market Revenue Share (%), by Component 2025 & 2033
- Figure 70: Middle East & Africa US EV Battery Pack Market Revenue (billion), by Material Type 2025 & 2033
- Figure 71: Middle East & Africa US EV Battery Pack Market Revenue Share (%), by Material Type 2025 & 2033
- Figure 72: Middle East & Africa US EV Battery Pack Market Revenue (billion), by Country 2025 & 2033
- Figure 73: Middle East & Africa US EV Battery Pack Market Revenue Share (%), by Country 2025 & 2033
- Figure 74: Asia Pacific US EV Battery Pack Market Revenue (billion), by Body Type 2025 & 2033
- Figure 75: Asia Pacific US EV Battery Pack Market Revenue Share (%), by Body Type 2025 & 2033
- Figure 76: Asia Pacific US EV Battery Pack Market Revenue (billion), by Propulsion Type 2025 & 2033
- Figure 77: Asia Pacific US EV Battery Pack Market Revenue Share (%), by Propulsion Type 2025 & 2033
- Figure 78: Asia Pacific US EV Battery Pack Market Revenue (billion), by Battery Chemistry 2025 & 2033
- Figure 79: Asia Pacific US EV Battery Pack Market Revenue Share (%), by Battery Chemistry 2025 & 2033
- Figure 80: Asia Pacific US EV Battery Pack Market Revenue (billion), by Capacity 2025 & 2033
- Figure 81: Asia Pacific US EV Battery Pack Market Revenue Share (%), by Capacity 2025 & 2033
- Figure 82: Asia Pacific US EV Battery Pack Market Revenue (billion), by Battery Form 2025 & 2033
- Figure 83: Asia Pacific US EV Battery Pack Market Revenue Share (%), by Battery Form 2025 & 2033
- Figure 84: Asia Pacific US EV Battery Pack Market Revenue (billion), by Method 2025 & 2033
- Figure 85: Asia Pacific US EV Battery Pack Market Revenue Share (%), by Method 2025 & 2033
- Figure 86: Asia Pacific US EV Battery Pack Market Revenue (billion), by Component 2025 & 2033
- Figure 87: Asia Pacific US EV Battery Pack Market Revenue Share (%), by Component 2025 & 2033
- Figure 88: Asia Pacific US EV Battery Pack Market Revenue (billion), by Material Type 2025 & 2033
- Figure 89: Asia Pacific US EV Battery Pack Market Revenue Share (%), by Material Type 2025 & 2033
- Figure 90: Asia Pacific US EV Battery Pack Market Revenue (billion), by Country 2025 & 2033
- Figure 91: Asia Pacific US EV Battery Pack Market Revenue Share (%), by Country 2025 & 2033
List of Tables
- Table 1: Global US EV Battery Pack Market Revenue billion Forecast, by Body Type 2020 & 2033
- Table 2: Global US EV Battery Pack Market Revenue billion Forecast, by Propulsion Type 2020 & 2033
- Table 3: Global US EV Battery Pack Market Revenue billion Forecast, by Battery Chemistry 2020 & 2033
- Table 4: Global US EV Battery Pack Market Revenue billion Forecast, by Capacity 2020 & 2033
- Table 5: Global US EV Battery Pack Market Revenue billion Forecast, by Battery Form 2020 & 2033
- Table 6: Global US EV Battery Pack Market Revenue billion Forecast, by Method 2020 & 2033
- Table 7: Global US EV Battery Pack Market Revenue billion Forecast, by Component 2020 & 2033
- Table 8: Global US EV Battery Pack Market Revenue billion Forecast, by Material Type 2020 & 2033
- Table 9: Global US EV Battery Pack Market Revenue billion Forecast, by Region 2020 & 2033
- Table 10: Global US EV Battery Pack Market Revenue billion Forecast, by Body Type 2020 & 2033
- Table 11: Global US EV Battery Pack Market Revenue billion Forecast, by Propulsion Type 2020 & 2033
- Table 12: Global US EV Battery Pack Market Revenue billion Forecast, by Battery Chemistry 2020 & 2033
- Table 13: Global US EV Battery Pack Market Revenue billion Forecast, by Capacity 2020 & 2033
- Table 14: Global US EV Battery Pack Market Revenue billion Forecast, by Battery Form 2020 & 2033
- Table 15: Global US EV Battery Pack Market Revenue billion Forecast, by Method 2020 & 2033
- Table 16: Global US EV Battery Pack Market Revenue billion Forecast, by Component 2020 & 2033
- Table 17: Global US EV Battery Pack Market Revenue billion Forecast, by Material Type 2020 & 2033
- Table 18: Global US EV Battery Pack Market Revenue billion Forecast, by Country 2020 & 2033
- Table 19: United States US EV Battery Pack Market Revenue (billion) Forecast, by Application 2020 & 2033
- Table 20: Canada US EV Battery Pack Market Revenue (billion) Forecast, by Application 2020 & 2033
- Table 21: Mexico US EV Battery Pack Market Revenue (billion) Forecast, by Application 2020 & 2033
- Table 22: Global US EV Battery Pack Market Revenue billion Forecast, by Body Type 2020 & 2033
- Table 23: Global US EV Battery Pack Market Revenue billion Forecast, by Propulsion Type 2020 & 2033
- Table 24: Global US EV Battery Pack Market Revenue billion Forecast, by Battery Chemistry 2020 & 2033
- Table 25: Global US EV Battery Pack Market Revenue billion Forecast, by Capacity 2020 & 2033
- Table 26: Global US EV Battery Pack Market Revenue billion Forecast, by Battery Form 2020 & 2033
- Table 27: Global US EV Battery Pack Market Revenue billion Forecast, by Method 2020 & 2033
- Table 28: Global US EV Battery Pack Market Revenue billion Forecast, by Component 2020 & 2033
- Table 29: Global US EV Battery Pack Market Revenue billion Forecast, by Material Type 2020 & 2033
- Table 30: Global US EV Battery Pack Market Revenue billion Forecast, by Country 2020 & 2033
- Table 31: Brazil US EV Battery Pack Market Revenue (billion) Forecast, by Application 2020 & 2033
- Table 32: Argentina US EV Battery Pack Market Revenue (billion) Forecast, by Application 2020 & 2033
- Table 33: Rest of South America US EV Battery Pack Market Revenue (billion) Forecast, by Application 2020 & 2033
- Table 34: Global US EV Battery Pack Market Revenue billion Forecast, by Body Type 2020 & 2033
- Table 35: Global US EV Battery Pack Market Revenue billion Forecast, by Propulsion Type 2020 & 2033
- Table 36: Global US EV Battery Pack Market Revenue billion Forecast, by Battery Chemistry 2020 & 2033
- Table 37: Global US EV Battery Pack Market Revenue billion Forecast, by Capacity 2020 & 2033
- Table 38: Global US EV Battery Pack Market Revenue billion Forecast, by Battery Form 2020 & 2033
- Table 39: Global US EV Battery Pack Market Revenue billion Forecast, by Method 2020 & 2033
- Table 40: Global US EV Battery Pack Market Revenue billion Forecast, by Component 2020 & 2033
- Table 41: Global US EV Battery Pack Market Revenue billion Forecast, by Material Type 2020 & 2033
- Table 42: Global US EV Battery Pack Market Revenue billion Forecast, by Country 2020 & 2033
- Table 43: United Kingdom US EV Battery Pack Market Revenue (billion) Forecast, by Application 2020 & 2033
- Table 44: Germany US EV Battery Pack Market Revenue (billion) Forecast, by Application 2020 & 2033
- Table 45: France US EV Battery Pack Market Revenue (billion) Forecast, by Application 2020 & 2033
- Table 46: Italy US EV Battery Pack Market Revenue (billion) Forecast, by Application 2020 & 2033
- Table 47: Spain US EV Battery Pack Market Revenue (billion) Forecast, by Application 2020 & 2033
- Table 48: Russia US EV Battery Pack Market Revenue (billion) Forecast, by Application 2020 & 2033
- Table 49: Benelux US EV Battery Pack Market Revenue (billion) Forecast, by Application 2020 & 2033
- Table 50: Nordics US EV Battery Pack Market Revenue (billion) Forecast, by Application 2020 & 2033
- Table 51: Rest of Europe US EV Battery Pack Market Revenue (billion) Forecast, by Application 2020 & 2033
- Table 52: Global US EV Battery Pack Market Revenue billion Forecast, by Body Type 2020 & 2033
- Table 53: Global US EV Battery Pack Market Revenue billion Forecast, by Propulsion Type 2020 & 2033
- Table 54: Global US EV Battery Pack Market Revenue billion Forecast, by Battery Chemistry 2020 & 2033
- Table 55: Global US EV Battery Pack Market Revenue billion Forecast, by Capacity 2020 & 2033
- Table 56: Global US EV Battery Pack Market Revenue billion Forecast, by Battery Form 2020 & 2033
- Table 57: Global US EV Battery Pack Market Revenue billion Forecast, by Method 2020 & 2033
- Table 58: Global US EV Battery Pack Market Revenue billion Forecast, by Component 2020 & 2033
- Table 59: Global US EV Battery Pack Market Revenue billion Forecast, by Material Type 2020 & 2033
- Table 60: Global US EV Battery Pack Market Revenue billion Forecast, by Country 2020 & 2033
- Table 61: Turkey US EV Battery Pack Market Revenue (billion) Forecast, by Application 2020 & 2033
- Table 62: Israel US EV Battery Pack Market Revenue (billion) Forecast, by Application 2020 & 2033
- Table 63: GCC US EV Battery Pack Market Revenue (billion) Forecast, by Application 2020 & 2033
- Table 64: North Africa US EV Battery Pack Market Revenue (billion) Forecast, by Application 2020 & 2033
- Table 65: South Africa US EV Battery Pack Market Revenue (billion) Forecast, by Application 2020 & 2033
- Table 66: Rest of Middle East & Africa US EV Battery Pack Market Revenue (billion) Forecast, by Application 2020 & 2033
- Table 67: Global US EV Battery Pack Market Revenue billion Forecast, by Body Type 2020 & 2033
- Table 68: Global US EV Battery Pack Market Revenue billion Forecast, by Propulsion Type 2020 & 2033
- Table 69: Global US EV Battery Pack Market Revenue billion Forecast, by Battery Chemistry 2020 & 2033
- Table 70: Global US EV Battery Pack Market Revenue billion Forecast, by Capacity 2020 & 2033
- Table 71: Global US EV Battery Pack Market Revenue billion Forecast, by Battery Form 2020 & 2033
- Table 72: Global US EV Battery Pack Market Revenue billion Forecast, by Method 2020 & 2033
- Table 73: Global US EV Battery Pack Market Revenue billion Forecast, by Component 2020 & 2033
- Table 74: Global US EV Battery Pack Market Revenue billion Forecast, by Material Type 2020 & 2033
- Table 75: Global US EV Battery Pack Market Revenue billion Forecast, by Country 2020 & 2033
- Table 76: China US EV Battery Pack Market Revenue (billion) Forecast, by Application 2020 & 2033
- Table 77: India US EV Battery Pack Market Revenue (billion) Forecast, by Application 2020 & 2033
- Table 78: Japan US EV Battery Pack Market Revenue (billion) Forecast, by Application 2020 & 2033
- Table 79: South Korea US EV Battery Pack Market Revenue (billion) Forecast, by Application 2020 & 2033
- Table 80: ASEAN US EV Battery Pack Market Revenue (billion) Forecast, by Application 2020 & 2033
- Table 81: Oceania US EV Battery Pack Market Revenue (billion) Forecast, by Application 2020 & 2033
- Table 82: Rest of Asia Pacific US EV Battery Pack Market Revenue (billion) Forecast, by Application 2020 & 2033
Frequently Asked Questions
1. What is the projected Compound Annual Growth Rate (CAGR) of the US EV Battery Pack Market?
The projected CAGR is approximately 10.3%.
2. Which companies are prominent players in the US EV Battery Pack Market?
Key companies in the market include Samsung SDI Co Ltd, LG Energy Solution Ltd, Imperium3 New York (IM3NY), Contemporary Amperex Technology Co Ltd (CATL), Tesla Inc, SK Innovation Co Ltd, Ambri Inc, Sila Nanotechnologies Inc, Panasonic Holdings Corporation, Envision AESC Japan Co Ltd.
3. What are the main segments of the US EV Battery Pack Market?
The market segments include Body Type, Propulsion Type, Battery Chemistry, Capacity, Battery Form, Method, Component, Material Type.
4. Can you provide details about the market size?
The market size is estimated to be USD 16.04 billion as of 2022.
5. What are some drivers contributing to market growth?
Increasing Demand and Sales of Commercial Vehicles is Driving the Market for Hydraulic Systems.
6. What are the notable trends driving market growth?
OTHER KEY INDUSTRY TRENDS COVERED IN THE REPORT.
7. Are there any restraints impacting market growth?
Increasing Replacement of Conventional Hydraulic Systems with Fully-electric Hydraulic Systems Acts as a Restraint.
8. Can you provide examples of recent developments in the market?
June 2023: CATL will invest USD 1.4 billion in helping Bolivia develop its huge but largely untapped reserves of lithium. Following a meeting with CATL executives on June 25, Bolivian President Luis Arce confirmed the commitment to build two lithium plants to extract minerals from the country’s Uyuni and Oruro salt flats. Construction of both plants could begin as soon as July, according to the country’s energy ministry.March 2023: Tesla was reported to be in talks with Contemporary Amperex Technology Co. Ltd. (CATL) regarding plans to build a battery factory in the U.S., according to sources familiar with the matter.January 2023: Tesla has announced a new investment of USD 3.6 billion to expand its Gigafactory Nevada complex, hire 3,000 additional employees, and construct two new facilities on the site, including a 100 GWh 4680 cell factory.
9. What pricing options are available for accessing the report?
Pricing options include single-user, multi-user, and enterprise licenses priced at USD 3800, USD 4500, and USD 5800 respectively.
10. Is the market size provided in terms of value or volume?
The market size is provided in terms of value, measured in billion.
11. Are there any specific market keywords associated with the report?
Yes, the market keyword associated with the report is "US EV Battery Pack Market," which aids in identifying and referencing the specific market segment covered.
12. How do I determine which pricing option suits my needs best?
The pricing options vary based on user requirements and access needs. Individual users may opt for single-user licenses, while businesses requiring broader access may choose multi-user or enterprise licenses for cost-effective access to the report.
13. Are there any additional resources or data provided in the US EV Battery Pack Market report?
While the report offers comprehensive insights, it's advisable to review the specific contents or supplementary materials provided to ascertain if additional resources or data are available.
14. How can I stay updated on further developments or reports in the US EV Battery Pack Market?
To stay informed about further developments, trends, and reports in the US EV Battery Pack Market, consider subscribing to industry newsletters, following relevant companies and organizations, or regularly checking reputable industry news sources and publications.
Methodology
Step 1 - Identification of Relevant Samples Size from Population Database


Step 2 - Approaches for Defining Global Market Size (Value, Volume* & Price*)

Note*: In applicable scenarios
Step 3 - Data Sources
Primary Research
- Web Analytics
- Survey Reports
- Research Institute
- Latest Research Reports
- Opinion Leaders
Secondary Research
- Annual Reports
- White Paper
- Latest Press Release
- Industry Association
- Paid Database
- Investor Presentations

Step 4 - Data Triangulation
Involves using different sources of information in order to increase the validity of a study
These sources are likely to be stakeholders in a program - participants, other researchers, program staff, other community members, and so on.
Then we put all data in single framework & apply various statistical tools to find out the dynamic on the market.
During the analysis stage, feedback from the stakeholder groups would be compared to determine areas of agreement as well as areas of divergence