

Key Insights
The global tanker truck market is poised for significant expansion, projected to reach a substantial $2.2 billion in 2025. This growth is fueled by a robust CAGR of 4.8% anticipated over the forecast period, indicating sustained demand and increasing market value through 2033. The primary drivers behind this upward trajectory include the ever-growing need for efficient and large-scale transportation of liquid and gaseous commodities, such as refined petroleum products, chemicals, and agricultural liquids. The increasing industrialization and infrastructure development across emerging economies are creating new avenues for tanker truck deployment, while stringent safety regulations are spurring upgrades and the adoption of advanced, compliant fleet. Furthermore, a rising global population and its subsequent demand for energy and manufactured goods directly translate to higher logistics requirements, with tanker trucks playing a crucial role in the supply chain.
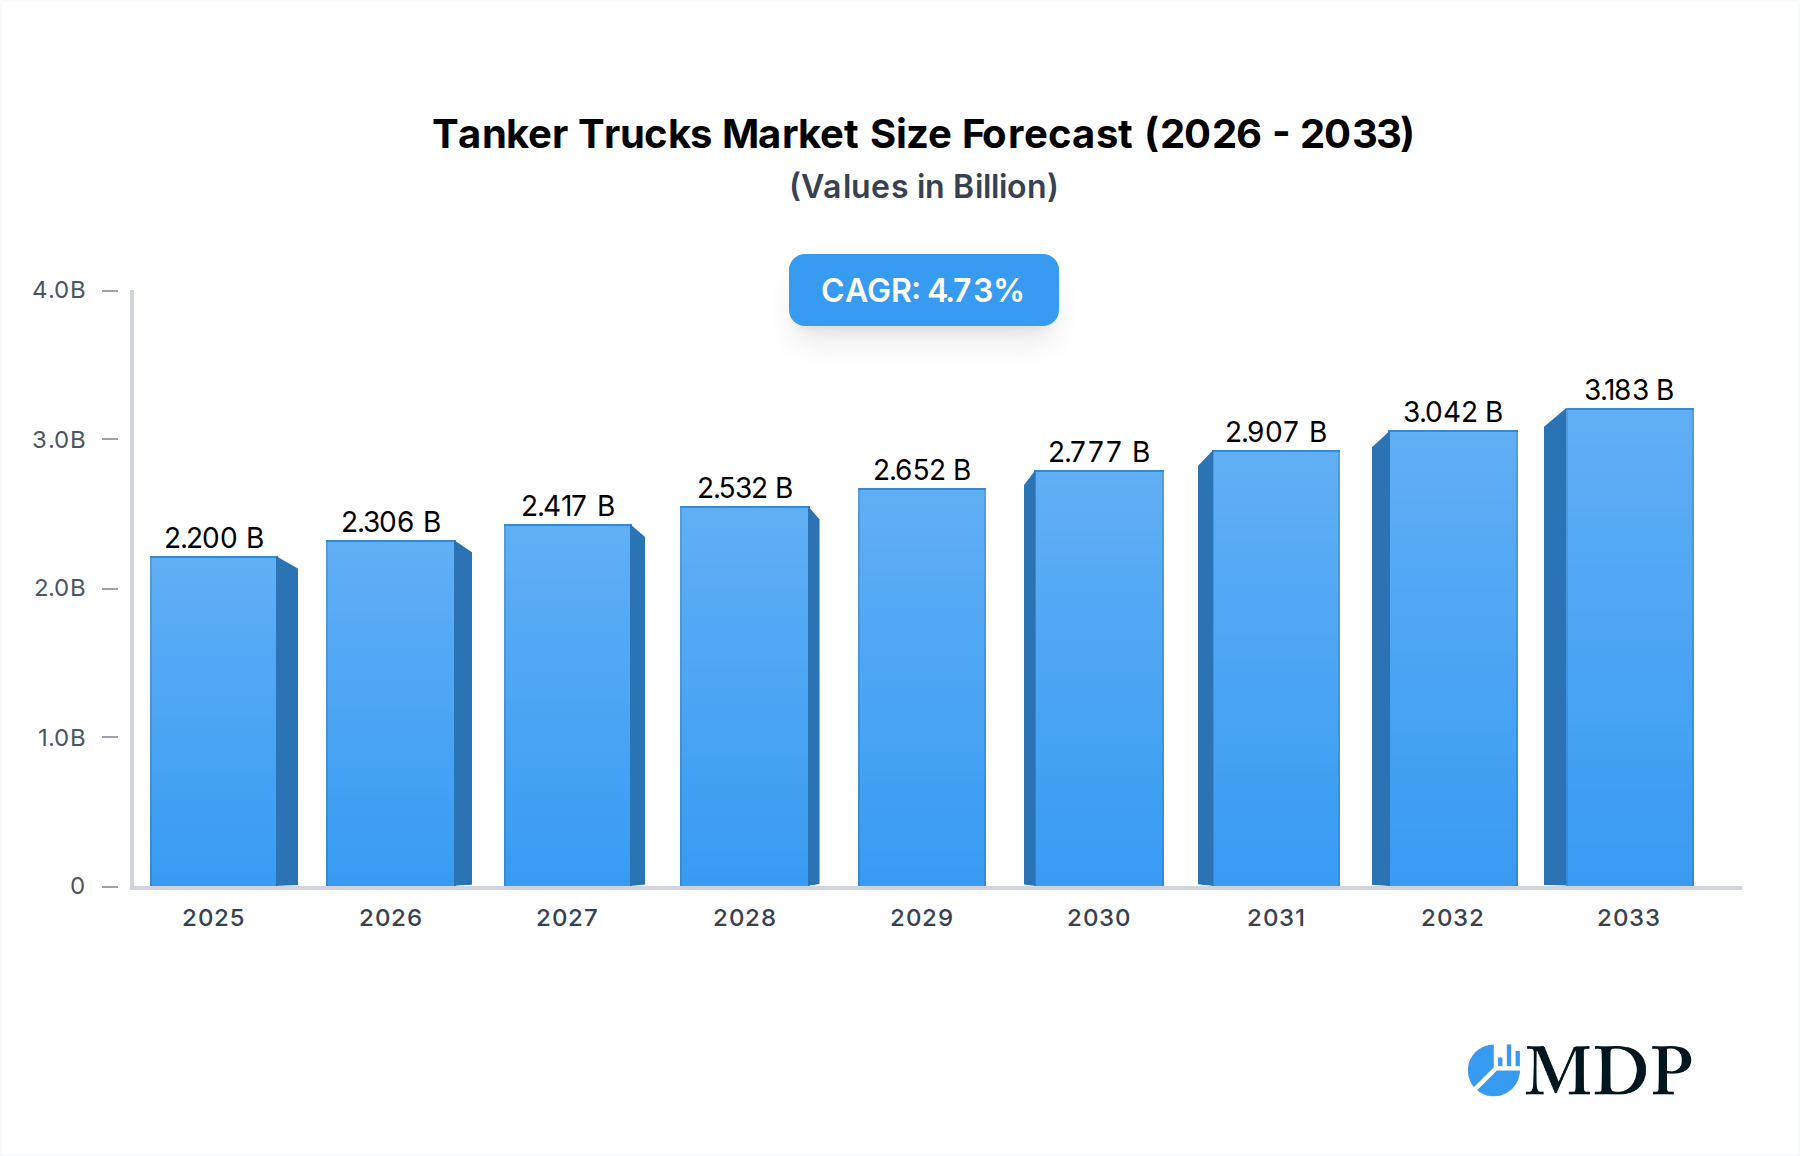
Tanker Trucks Market Size (In Billion)
The market is segmented by application, with Gasoline Transport and Diesel Transport applications dominating due to their consistent and high-volume requirements within the transportation and energy sectors. The "Others" category, encompassing chemicals, food-grade liquids, and more specialized payloads, is also expected to witness steady growth as industries diversify. In terms of type, large-capacity trucks, particularly those above 3000 gallons, are increasingly favored for their economic efficiency in long-haul transportation. Key trends include the integration of smart technologies for real-time tracking, enhanced safety features, and improved fuel efficiency to address environmental concerns and operational costs. While the market enjoys strong growth, restraints such as the high initial investment cost of advanced tanker trucks and fluctuating raw material prices for manufacturing may present challenges. However, the overall outlook remains highly positive, driven by fundamental economic activity and evolving logistical demands worldwide.

Tanker Trucks Company Market Share
Embark on a comprehensive journey through the global Tanker Trucks market with this in-depth report. Delving into critical market dynamics, evolving industry trends, leading segments, and strategic outlooks, this analysis provides invaluable insights for stakeholders seeking to navigate and capitalize on the burgeoning demand for specialized liquid and gas transportation solutions. The study encompasses a detailed examination from 2019 to 2033, with a robust base year of 2025 and an extensive forecast period.
Tanker Trucks Market Dynamics & Concentration
The global Tanker Trucks market exhibits a moderately consolidated landscape, with a few dominant players holding significant market share. Key innovation drivers include the increasing demand for specialized chemical and hazardous material transport, coupled with stringent safety regulations mandating advanced features. Regulatory frameworks, such as emission standards and transportation safety guidelines, significantly influence product development and market entry. Product substitutes, primarily rail and pipeline transportation for bulk commodities, pose a competitive challenge. End-user trends are increasingly leaning towards fuel efficiency, enhanced safety features, and customized solutions for diverse applications like gasoline and diesel transport. Merger and Acquisition (M&A) activities are observed as companies seek to expand their product portfolios and geographical reach. For instance, in the historical period, there were approximately 15 M&A deals valued in the billions, indicating a strategic consolidation trend. The market share of the top 5 companies is estimated to be around 60 billion.
Tanker Trucks Industry Trends & Analysis
The Tanker Trucks industry is poised for significant expansion, driven by the relentless global demand for efficient and secure transportation of liquids and gases. Market growth is fueled by the escalating consumption of petroleum products, chemicals, and agricultural liquids, necessitating a robust fleet of specialized tankers. Technological advancements are at the forefront, with manufacturers integrating lighter, more durable materials, advanced braking systems, and sophisticated tracking technologies to enhance operational efficiency and safety. The market penetration for advanced safety features is projected to exceed 70 billion by 2025. Consumer preferences are evolving, with a strong emphasis on fuel-efficient designs, reduced environmental impact, and customizable configurations to meet specific cargo requirements. Competitive dynamics are characterized by fierce price competition, innovation races in safety and material science, and strategic alliances to secure supply chains and expand distribution networks. The Compound Annual Growth Rate (CAGR) for the Tanker Trucks market is conservatively estimated at 5.2% over the forecast period, translating to a market valuation projected to reach over 800 billion by 2033. The increasing demand for specialized tankers for transporting an array of chemicals and petroleum products will continue to be a primary growth catalyst, with infrastructure development in emerging economies playing a crucial role in this expansion. The sector's ability to adapt to evolving environmental regulations and integrate sustainable practices will also be pivotal in shaping its trajectory.
Leading Markets & Segments in Tanker Trucks
The global Tanker Trucks market is segmented by application and capacity, with significant regional variations in dominance.
Dominant Application Segment: Diesel Transport
- The Diesel Transport segment commands the largest market share due to the pervasive use of diesel fuel across commercial transportation, industrial machinery, and power generation globally. Economic policies supporting logistics and transportation sectors, coupled with extensive refueling infrastructure, are key drivers. The demand for efficient and high-capacity diesel tankers is consistently high in major economies.
- Gasoline Transport follows closely, driven by consumer demand for personal vehicles and the need for extensive retail refueling networks. Infrastructure development and urbanization in emerging markets further bolster this segment.
- Others, encompassing chemicals, food-grade liquids, and industrial gases, represent a rapidly growing segment. Stricter regulations for hazardous material transport are spurring demand for specialized, high-specification tankers, contributing to market value exceeding 200 billion in this sub-segment alone by 2025.
Dominant Type Segment: Capacity above 3000 gallons
- Within the capacity segments, Capacity above 3000 gallons represents the most dominant category, accounting for a substantial portion of the market value, estimated to be over 600 billion. This dominance is attributed to the need for economies of scale in transporting large volumes of liquids efficiently.
- Capacity 6000-10,000 gallons is a rapidly expanding segment, reflecting the trend towards larger capacity vehicles to optimize logistics and reduce transportation costs per unit. Investments in highway infrastructure and the growth of long-haul transportation are key enablers.
- Capacity 3000-6000 gallons caters to regional distribution, specialized delivery needs, and markets with road weight restrictions. While smaller in volume, this segment remains crucial for last-mile delivery and niche applications.
Geographically, North America and Europe lead in terms of market value due to established infrastructure and stringent safety standards. However, the Asia-Pacific region is emerging as a significant growth hub, driven by rapid industrialization and increasing demand for fuel and chemical transport.
Tanker Trucks Product Developments
Product innovations in the Tanker Trucks sector are focused on enhancing safety, efficiency, and sustainability. Manufacturers are increasingly adopting advanced materials like high-strength aluminum alloys and composite materials to reduce vehicle weight, thereby improving fuel efficiency and payload capacity. Smart technologies, including real-time monitoring systems for temperature, pressure, and cargo integrity, are becoming standard. Furthermore, designs are evolving to accommodate a wider range of specialized cargo, from cryogenic liquids to hazardous chemicals, with improved containment and discharge systems. Competitive advantages are derived from superior construction quality, compliance with international safety standards, and the ability to offer customized solutions, positioning companies like Schmitz Cargobull and CIMC at the forefront of innovation.
Key Drivers of Tanker Trucks Growth
The Tanker Trucks market is propelled by several key drivers. Economic growth and industrial expansion worldwide directly correlate with the demand for transporting raw materials and finished products, including fuels, chemicals, and agricultural liquids. Technological advancements in vehicle design, material science, and safety features enhance operational efficiency and reduce environmental impact, stimulating upgrades. Stringent regulatory frameworks for safety and environmental compliance necessitate the adoption of modern, compliant tanker trucks. Infrastructure development, particularly in emerging economies, expands reach and increases the need for robust transportation fleets. Finally, increasing global energy consumption and the associated demand for oil and gas products remain a fundamental growth accelerator.
Challenges in the Tanker Trucks Market
The Tanker Trucks market faces several challenges that could impede growth. Stringent and evolving regulatory landscapes can increase compliance costs and necessitate frequent product redesigns. Fluctuations in raw material prices, particularly for steel and aluminum, directly impact manufacturing costs and profit margins. Intensifying competition among established players and emerging manufacturers can lead to price wars and reduced profitability. Supply chain disruptions, as witnessed in recent years, can affect production timelines and component availability. Lastly, public perception and environmental concerns surrounding the transport of hazardous materials can lead to increased scrutiny and operational restrictions. The cost of advanced safety features, while beneficial, can also be a barrier to adoption for smaller operators, impacting market penetration in certain segments.
Emerging Opportunities in Tanker Trucks
Emerging opportunities in the Tanker Trucks market are diverse and promising. The growing demand for specialized tankers for chemical and pharmaceutical logistics presents a significant avenue for growth, driven by the need for precise temperature control and containment. Expansion into emerging markets with developing infrastructure and increasing industrial activity offers substantial untapped potential. The development of electric and alternative fuel tanker trucks aligns with global sustainability trends and governmental mandates, opening new market segments. Strategic partnerships and collaborations between manufacturers, technology providers, and logistics companies can lead to innovative solutions and expanded market reach. The increasing focus on circular economy principles, such as the development of recyclable and more durable tanker materials, also presents an opportunity for differentiation and market leadership.
Leading Players in the Tanker Trucks Sector
- Schmitz Cargobull
- CIMC
- Schwarzmüller Group
- Kassbohrer
- Feldbinder
- Wabash National Corporation
- Crosstand
- Willig
- Alura Trailer
- Linder & Fische
- STOKOTA
- Amthor International
- TANSAN
- Welgro
- GOFA
- Schrader
- Fruehauf
- LBT
- Tremcar
- Polar Tank Trailer
- Heil Trailer International
- MAC Trailer
Key Milestones in Tanker Trucks Industry
- 2019: Increased adoption of advanced telematics and IoT solutions for fleet management and safety monitoring.
- 2020: Significant supply chain disruptions due to global events, highlighting the need for resilient manufacturing and logistics.
- 2021: Growing focus on lightweight materials and aerodynamic designs to improve fuel efficiency and reduce emissions.
- 2022: Introduction of enhanced safety features, including advanced braking and stability control systems, driven by regulatory pressures.
- 2023: Emergence of early prototypes for electric-powered tanker trucks, signaling a shift towards sustainable transportation.
- 2024: Increased M&A activity as key players sought to consolidate market positions and expand product portfolios.
- 2025 (Base Year): Projected acceleration in the adoption of smart tanker technologies and a steady growth in demand for specialized chemical transport.
Strategic Outlook for Tanker Trucks Market
The strategic outlook for the Tanker Trucks market is characterized by sustained growth and innovation. Key growth accelerators include the ongoing global demand for essential commodities, continuous technological advancements in safety and efficiency, and the increasing adoption of sustainable transportation solutions. Companies that invest in research and development for advanced materials, smart technologies, and alternative fuel vehicles will be well-positioned for success. Strategic market expansion into rapidly developing regions, coupled with robust partnerships, will be crucial for capturing emerging opportunities. The focus on regulatory compliance and customization to meet diverse end-user needs will remain paramount in maintaining a competitive edge. The market is expected to witness a gradual but significant integration of digital solutions, enhancing operational visibility and efficiency across the entire value chain.
Tanker Trucks Segmentation
-
1. Application
- 1.1. Gasoline Transport
- 1.2. Diesel Transport
- 1.3. Others
-
2. Type
- 2.1. Capacity above 3000 gallons
- 2.2. Capacity 3000-6000 gallons
- 2.3. Capacity 6000-10,000 gallons
Tanker Trucks Segmentation By Geography
-
1. North America
- 1.1. United States
- 1.2. Canada
- 1.3. Mexico
-
2. South America
- 2.1. Brazil
- 2.2. Argentina
- 2.3. Rest of South America
-
3. Europe
- 3.1. United Kingdom
- 3.2. Germany
- 3.3. France
- 3.4. Italy
- 3.5. Spain
- 3.6. Russia
- 3.7. Benelux
- 3.8. Nordics
- 3.9. Rest of Europe
-
4. Middle East & Africa
- 4.1. Turkey
- 4.2. Israel
- 4.3. GCC
- 4.4. North Africa
- 4.5. South Africa
- 4.6. Rest of Middle East & Africa
-
5. Asia Pacific
- 5.1. China
- 5.2. India
- 5.3. Japan
- 5.4. South Korea
- 5.5. ASEAN
- 5.6. Oceania
- 5.7. Rest of Asia Pacific
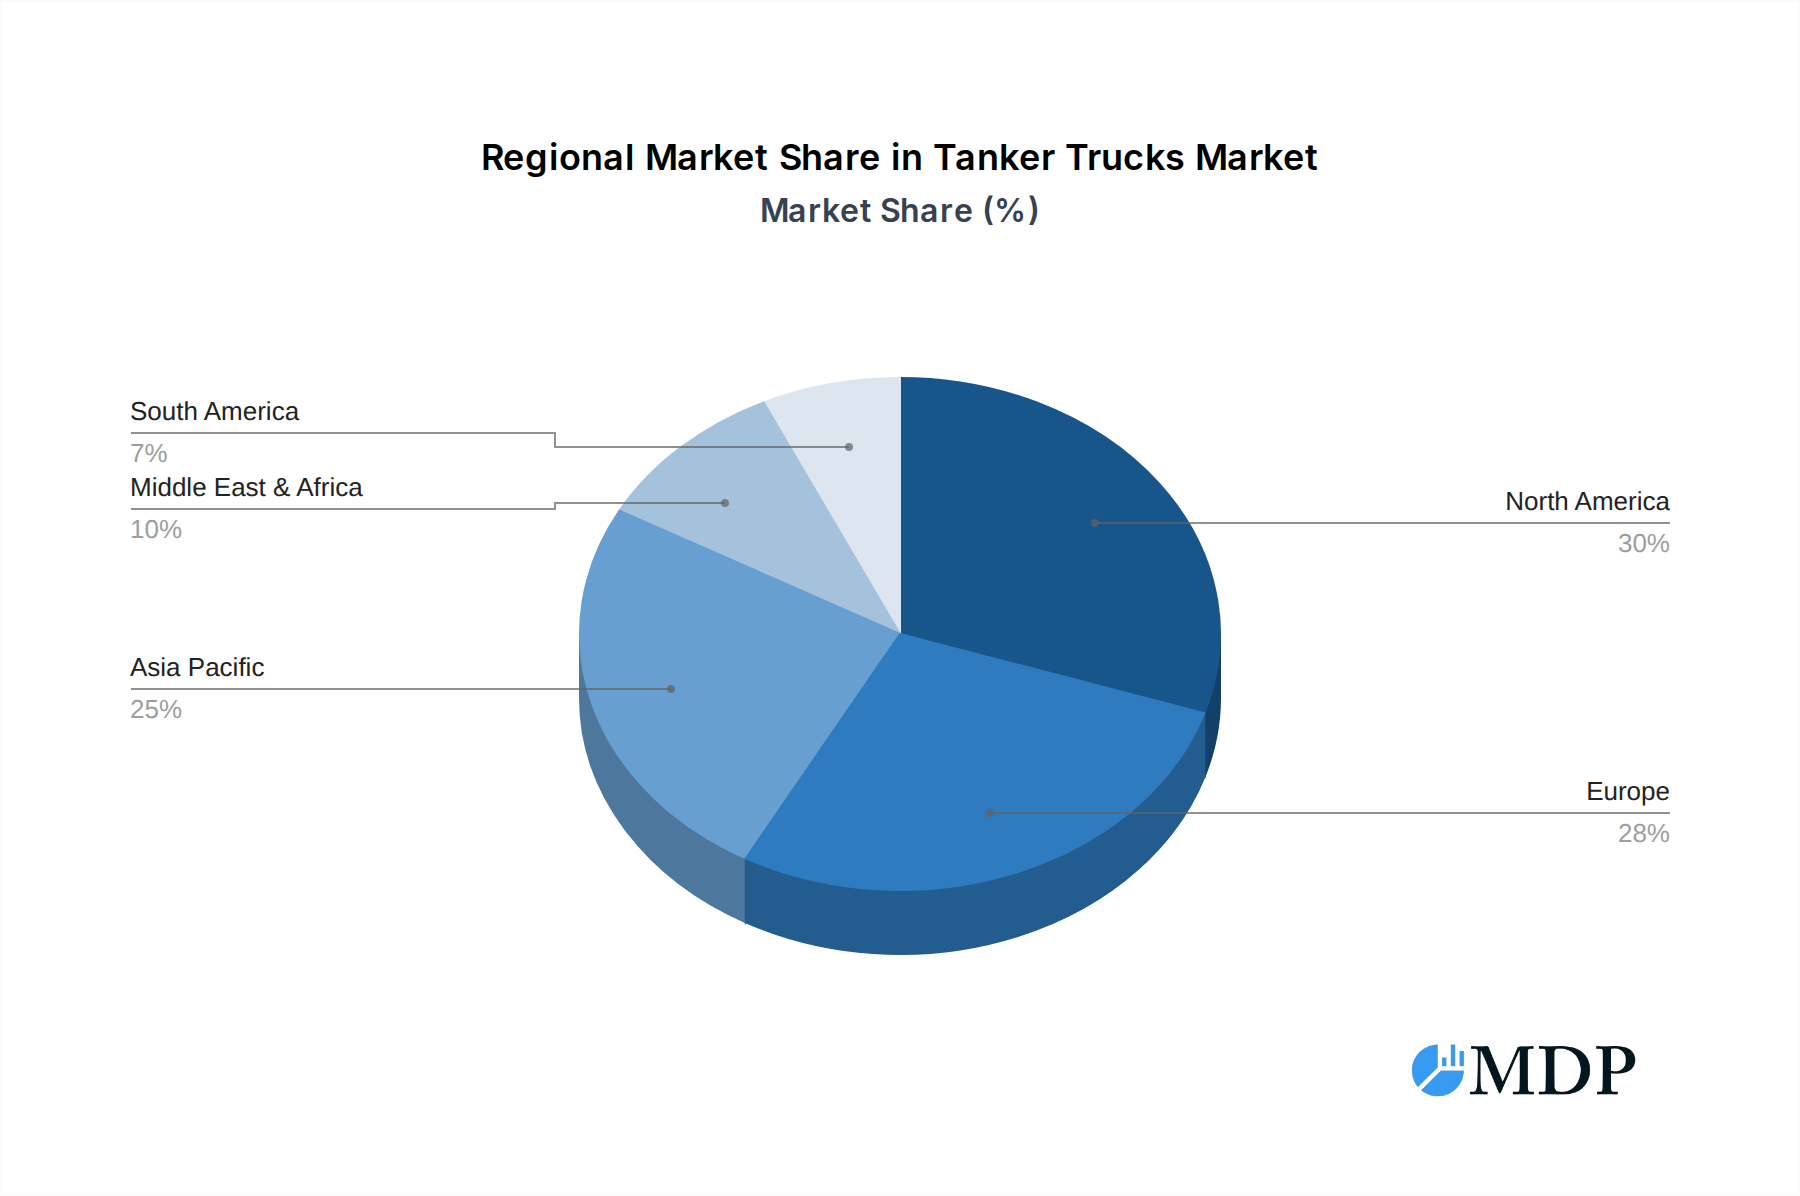
Tanker Trucks Regional Market Share
Geographic Coverage of Tanker Trucks
Tanker Trucks REPORT HIGHLIGHTS
| Aspects | Details |
|---|---|
| Study Period | 2020-2034 |
| Base Year | 2025 |
| Estimated Year | 2026 |
| Forecast Period | 2026-2034 |
| Historical Period | 2020-2025 |
| Growth Rate | CAGR of 4.8% from 2020-2034 |
| Segmentation |
|
Table of Contents
- 1. Introduction
- 1.1. Research Scope
- 1.2. Market Segmentation
- 1.3. Research Methodology
- 1.4. Definitions and Assumptions
- 2. Executive Summary
- 2.1. Introduction
- 3. Market Dynamics
- 3.1. Introduction
- 3.2. Market Drivers
- 3.3. Market Restrains
- 3.4. Market Trends
- 4. Market Factor Analysis
- 4.1. Porters Five Forces
- 4.2. Supply/Value Chain
- 4.3. PESTEL analysis
- 4.4. Market Entropy
- 4.5. Patent/Trademark Analysis
- 5. Global Tanker Trucks Analysis, Insights and Forecast, 2020-2032
- 5.1. Market Analysis, Insights and Forecast - by Application
- 5.1.1. Gasoline Transport
- 5.1.2. Diesel Transport
- 5.1.3. Others
- 5.2. Market Analysis, Insights and Forecast - by Type
- 5.2.1. Capacity above 3000 gallons
- 5.2.2. Capacity 3000-6000 gallons
- 5.2.3. Capacity 6000-10,000 gallons
- 5.3. Market Analysis, Insights and Forecast - by Region
- 5.3.1. North America
- 5.3.2. South America
- 5.3.3. Europe
- 5.3.4. Middle East & Africa
- 5.3.5. Asia Pacific
- 5.1. Market Analysis, Insights and Forecast - by Application
- 6. North America Tanker Trucks Analysis, Insights and Forecast, 2020-2032
- 6.1. Market Analysis, Insights and Forecast - by Application
- 6.1.1. Gasoline Transport
- 6.1.2. Diesel Transport
- 6.1.3. Others
- 6.2. Market Analysis, Insights and Forecast - by Type
- 6.2.1. Capacity above 3000 gallons
- 6.2.2. Capacity 3000-6000 gallons
- 6.2.3. Capacity 6000-10,000 gallons
- 6.1. Market Analysis, Insights and Forecast - by Application
- 7. South America Tanker Trucks Analysis, Insights and Forecast, 2020-2032
- 7.1. Market Analysis, Insights and Forecast - by Application
- 7.1.1. Gasoline Transport
- 7.1.2. Diesel Transport
- 7.1.3. Others
- 7.2. Market Analysis, Insights and Forecast - by Type
- 7.2.1. Capacity above 3000 gallons
- 7.2.2. Capacity 3000-6000 gallons
- 7.2.3. Capacity 6000-10,000 gallons
- 7.1. Market Analysis, Insights and Forecast - by Application
- 8. Europe Tanker Trucks Analysis, Insights and Forecast, 2020-2032
- 8.1. Market Analysis, Insights and Forecast - by Application
- 8.1.1. Gasoline Transport
- 8.1.2. Diesel Transport
- 8.1.3. Others
- 8.2. Market Analysis, Insights and Forecast - by Type
- 8.2.1. Capacity above 3000 gallons
- 8.2.2. Capacity 3000-6000 gallons
- 8.2.3. Capacity 6000-10,000 gallons
- 8.1. Market Analysis, Insights and Forecast - by Application
- 9. Middle East & Africa Tanker Trucks Analysis, Insights and Forecast, 2020-2032
- 9.1. Market Analysis, Insights and Forecast - by Application
- 9.1.1. Gasoline Transport
- 9.1.2. Diesel Transport
- 9.1.3. Others
- 9.2. Market Analysis, Insights and Forecast - by Type
- 9.2.1. Capacity above 3000 gallons
- 9.2.2. Capacity 3000-6000 gallons
- 9.2.3. Capacity 6000-10,000 gallons
- 9.1. Market Analysis, Insights and Forecast - by Application
- 10. Asia Pacific Tanker Trucks Analysis, Insights and Forecast, 2020-2032
- 10.1. Market Analysis, Insights and Forecast - by Application
- 10.1.1. Gasoline Transport
- 10.1.2. Diesel Transport
- 10.1.3. Others
- 10.2. Market Analysis, Insights and Forecast - by Type
- 10.2.1. Capacity above 3000 gallons
- 10.2.2. Capacity 3000-6000 gallons
- 10.2.3. Capacity 6000-10,000 gallons
- 10.1. Market Analysis, Insights and Forecast - by Application
- 11. Competitive Analysis
- 11.1. Global Market Share Analysis 2025
- 11.2. Company Profiles
- 11.2.1 Schmitz Cargobull
- 11.2.1.1. Overview
- 11.2.1.2. Products
- 11.2.1.3. SWOT Analysis
- 11.2.1.4. Recent Developments
- 11.2.1.5. Financials (Based on Availability)
- 11.2.2 CIMC
- 11.2.2.1. Overview
- 11.2.2.2. Products
- 11.2.2.3. SWOT Analysis
- 11.2.2.4. Recent Developments
- 11.2.2.5. Financials (Based on Availability)
- 11.2.3 Schwarzmüller Group
- 11.2.3.1. Overview
- 11.2.3.2. Products
- 11.2.3.3. SWOT Analysis
- 11.2.3.4. Recent Developments
- 11.2.3.5. Financials (Based on Availability)
- 11.2.4 Kassbohrer
- 11.2.4.1. Overview
- 11.2.4.2. Products
- 11.2.4.3. SWOT Analysis
- 11.2.4.4. Recent Developments
- 11.2.4.5. Financials (Based on Availability)
- 11.2.5 Feldbinder
- 11.2.5.1. Overview
- 11.2.5.2. Products
- 11.2.5.3. SWOT Analysis
- 11.2.5.4. Recent Developments
- 11.2.5.5. Financials (Based on Availability)
- 11.2.6 Wabash National Corporation
- 11.2.6.1. Overview
- 11.2.6.2. Products
- 11.2.6.3. SWOT Analysis
- 11.2.6.4. Recent Developments
- 11.2.6.5. Financials (Based on Availability)
- 11.2.7 Crosstand
- 11.2.7.1. Overview
- 11.2.7.2. Products
- 11.2.7.3. SWOT Analysis
- 11.2.7.4. Recent Developments
- 11.2.7.5. Financials (Based on Availability)
- 11.2.8 Willig
- 11.2.8.1. Overview
- 11.2.8.2. Products
- 11.2.8.3. SWOT Analysis
- 11.2.8.4. Recent Developments
- 11.2.8.5. Financials (Based on Availability)
- 11.2.9 Alura Trailer
- 11.2.9.1. Overview
- 11.2.9.2. Products
- 11.2.9.3. SWOT Analysis
- 11.2.9.4. Recent Developments
- 11.2.9.5. Financials (Based on Availability)
- 11.2.10 Linder& Fische
- 11.2.10.1. Overview
- 11.2.10.2. Products
- 11.2.10.3. SWOT Analysis
- 11.2.10.4. Recent Developments
- 11.2.10.5. Financials (Based on Availability)
- 11.2.11 STOKOTA
- 11.2.11.1. Overview
- 11.2.11.2. Products
- 11.2.11.3. SWOT Analysis
- 11.2.11.4. Recent Developments
- 11.2.11.5. Financials (Based on Availability)
- 11.2.12 Amthor International
- 11.2.12.1. Overview
- 11.2.12.2. Products
- 11.2.12.3. SWOT Analysis
- 11.2.12.4. Recent Developments
- 11.2.12.5. Financials (Based on Availability)
- 11.2.13 TANSAN
- 11.2.13.1. Overview
- 11.2.13.2. Products
- 11.2.13.3. SWOT Analysis
- 11.2.13.4. Recent Developments
- 11.2.13.5. Financials (Based on Availability)
- 11.2.14 Welgro
- 11.2.14.1. Overview
- 11.2.14.2. Products
- 11.2.14.3. SWOT Analysis
- 11.2.14.4. Recent Developments
- 11.2.14.5. Financials (Based on Availability)
- 11.2.15 GOFA
- 11.2.15.1. Overview
- 11.2.15.2. Products
- 11.2.15.3. SWOT Analysis
- 11.2.15.4. Recent Developments
- 11.2.15.5. Financials (Based on Availability)
- 11.2.16 Schrader
- 11.2.16.1. Overview
- 11.2.16.2. Products
- 11.2.16.3. SWOT Analysis
- 11.2.16.4. Recent Developments
- 11.2.16.5. Financials (Based on Availability)
- 11.2.17 Fruehauf
- 11.2.17.1. Overview
- 11.2.17.2. Products
- 11.2.17.3. SWOT Analysis
- 11.2.17.4. Recent Developments
- 11.2.17.5. Financials (Based on Availability)
- 11.2.18 LBT
- 11.2.18.1. Overview
- 11.2.18.2. Products
- 11.2.18.3. SWOT Analysis
- 11.2.18.4. Recent Developments
- 11.2.18.5. Financials (Based on Availability)
- 11.2.19 Tremcar
- 11.2.19.1. Overview
- 11.2.19.2. Products
- 11.2.19.3. SWOT Analysis
- 11.2.19.4. Recent Developments
- 11.2.19.5. Financials (Based on Availability)
- 11.2.20 Polar Tank Trailer
- 11.2.20.1. Overview
- 11.2.20.2. Products
- 11.2.20.3. SWOT Analysis
- 11.2.20.4. Recent Developments
- 11.2.20.5. Financials (Based on Availability)
- 11.2.21 Heil Trailer International
- 11.2.21.1. Overview
- 11.2.21.2. Products
- 11.2.21.3. SWOT Analysis
- 11.2.21.4. Recent Developments
- 11.2.21.5. Financials (Based on Availability)
- 11.2.22 MAC Trailer
- 11.2.22.1. Overview
- 11.2.22.2. Products
- 11.2.22.3. SWOT Analysis
- 11.2.22.4. Recent Developments
- 11.2.22.5. Financials (Based on Availability)
- 11.2.1 Schmitz Cargobull
List of Figures
- Figure 1: Global Tanker Trucks Revenue Breakdown (billion, %) by Region 2025 & 2033
- Figure 2: North America Tanker Trucks Revenue (billion), by Application 2025 & 2033
- Figure 3: North America Tanker Trucks Revenue Share (%), by Application 2025 & 2033
- Figure 4: North America Tanker Trucks Revenue (billion), by Type 2025 & 2033
- Figure 5: North America Tanker Trucks Revenue Share (%), by Type 2025 & 2033
- Figure 6: North America Tanker Trucks Revenue (billion), by Country 2025 & 2033
- Figure 7: North America Tanker Trucks Revenue Share (%), by Country 2025 & 2033
- Figure 8: South America Tanker Trucks Revenue (billion), by Application 2025 & 2033
- Figure 9: South America Tanker Trucks Revenue Share (%), by Application 2025 & 2033
- Figure 10: South America Tanker Trucks Revenue (billion), by Type 2025 & 2033
- Figure 11: South America Tanker Trucks Revenue Share (%), by Type 2025 & 2033
- Figure 12: South America Tanker Trucks Revenue (billion), by Country 2025 & 2033
- Figure 13: South America Tanker Trucks Revenue Share (%), by Country 2025 & 2033
- Figure 14: Europe Tanker Trucks Revenue (billion), by Application 2025 & 2033
- Figure 15: Europe Tanker Trucks Revenue Share (%), by Application 2025 & 2033
- Figure 16: Europe Tanker Trucks Revenue (billion), by Type 2025 & 2033
- Figure 17: Europe Tanker Trucks Revenue Share (%), by Type 2025 & 2033
- Figure 18: Europe Tanker Trucks Revenue (billion), by Country 2025 & 2033
- Figure 19: Europe Tanker Trucks Revenue Share (%), by Country 2025 & 2033
- Figure 20: Middle East & Africa Tanker Trucks Revenue (billion), by Application 2025 & 2033
- Figure 21: Middle East & Africa Tanker Trucks Revenue Share (%), by Application 2025 & 2033
- Figure 22: Middle East & Africa Tanker Trucks Revenue (billion), by Type 2025 & 2033
- Figure 23: Middle East & Africa Tanker Trucks Revenue Share (%), by Type 2025 & 2033
- Figure 24: Middle East & Africa Tanker Trucks Revenue (billion), by Country 2025 & 2033
- Figure 25: Middle East & Africa Tanker Trucks Revenue Share (%), by Country 2025 & 2033
- Figure 26: Asia Pacific Tanker Trucks Revenue (billion), by Application 2025 & 2033
- Figure 27: Asia Pacific Tanker Trucks Revenue Share (%), by Application 2025 & 2033
- Figure 28: Asia Pacific Tanker Trucks Revenue (billion), by Type 2025 & 2033
- Figure 29: Asia Pacific Tanker Trucks Revenue Share (%), by Type 2025 & 2033
- Figure 30: Asia Pacific Tanker Trucks Revenue (billion), by Country 2025 & 2033
- Figure 31: Asia Pacific Tanker Trucks Revenue Share (%), by Country 2025 & 2033
List of Tables
- Table 1: Global Tanker Trucks Revenue billion Forecast, by Application 2020 & 2033
- Table 2: Global Tanker Trucks Revenue billion Forecast, by Type 2020 & 2033
- Table 3: Global Tanker Trucks Revenue billion Forecast, by Region 2020 & 2033
- Table 4: Global Tanker Trucks Revenue billion Forecast, by Application 2020 & 2033
- Table 5: Global Tanker Trucks Revenue billion Forecast, by Type 2020 & 2033
- Table 6: Global Tanker Trucks Revenue billion Forecast, by Country 2020 & 2033
- Table 7: United States Tanker Trucks Revenue (billion) Forecast, by Application 2020 & 2033
- Table 8: Canada Tanker Trucks Revenue (billion) Forecast, by Application 2020 & 2033
- Table 9: Mexico Tanker Trucks Revenue (billion) Forecast, by Application 2020 & 2033
- Table 10: Global Tanker Trucks Revenue billion Forecast, by Application 2020 & 2033
- Table 11: Global Tanker Trucks Revenue billion Forecast, by Type 2020 & 2033
- Table 12: Global Tanker Trucks Revenue billion Forecast, by Country 2020 & 2033
- Table 13: Brazil Tanker Trucks Revenue (billion) Forecast, by Application 2020 & 2033
- Table 14: Argentina Tanker Trucks Revenue (billion) Forecast, by Application 2020 & 2033
- Table 15: Rest of South America Tanker Trucks Revenue (billion) Forecast, by Application 2020 & 2033
- Table 16: Global Tanker Trucks Revenue billion Forecast, by Application 2020 & 2033
- Table 17: Global Tanker Trucks Revenue billion Forecast, by Type 2020 & 2033
- Table 18: Global Tanker Trucks Revenue billion Forecast, by Country 2020 & 2033
- Table 19: United Kingdom Tanker Trucks Revenue (billion) Forecast, by Application 2020 & 2033
- Table 20: Germany Tanker Trucks Revenue (billion) Forecast, by Application 2020 & 2033
- Table 21: France Tanker Trucks Revenue (billion) Forecast, by Application 2020 & 2033
- Table 22: Italy Tanker Trucks Revenue (billion) Forecast, by Application 2020 & 2033
- Table 23: Spain Tanker Trucks Revenue (billion) Forecast, by Application 2020 & 2033
- Table 24: Russia Tanker Trucks Revenue (billion) Forecast, by Application 2020 & 2033
- Table 25: Benelux Tanker Trucks Revenue (billion) Forecast, by Application 2020 & 2033
- Table 26: Nordics Tanker Trucks Revenue (billion) Forecast, by Application 2020 & 2033
- Table 27: Rest of Europe Tanker Trucks Revenue (billion) Forecast, by Application 2020 & 2033
- Table 28: Global Tanker Trucks Revenue billion Forecast, by Application 2020 & 2033
- Table 29: Global Tanker Trucks Revenue billion Forecast, by Type 2020 & 2033
- Table 30: Global Tanker Trucks Revenue billion Forecast, by Country 2020 & 2033
- Table 31: Turkey Tanker Trucks Revenue (billion) Forecast, by Application 2020 & 2033
- Table 32: Israel Tanker Trucks Revenue (billion) Forecast, by Application 2020 & 2033
- Table 33: GCC Tanker Trucks Revenue (billion) Forecast, by Application 2020 & 2033
- Table 34: North Africa Tanker Trucks Revenue (billion) Forecast, by Application 2020 & 2033
- Table 35: South Africa Tanker Trucks Revenue (billion) Forecast, by Application 2020 & 2033
- Table 36: Rest of Middle East & Africa Tanker Trucks Revenue (billion) Forecast, by Application 2020 & 2033
- Table 37: Global Tanker Trucks Revenue billion Forecast, by Application 2020 & 2033
- Table 38: Global Tanker Trucks Revenue billion Forecast, by Type 2020 & 2033
- Table 39: Global Tanker Trucks Revenue billion Forecast, by Country 2020 & 2033
- Table 40: China Tanker Trucks Revenue (billion) Forecast, by Application 2020 & 2033
- Table 41: India Tanker Trucks Revenue (billion) Forecast, by Application 2020 & 2033
- Table 42: Japan Tanker Trucks Revenue (billion) Forecast, by Application 2020 & 2033
- Table 43: South Korea Tanker Trucks Revenue (billion) Forecast, by Application 2020 & 2033
- Table 44: ASEAN Tanker Trucks Revenue (billion) Forecast, by Application 2020 & 2033
- Table 45: Oceania Tanker Trucks Revenue (billion) Forecast, by Application 2020 & 2033
- Table 46: Rest of Asia Pacific Tanker Trucks Revenue (billion) Forecast, by Application 2020 & 2033
Frequently Asked Questions
1. What is the projected Compound Annual Growth Rate (CAGR) of the Tanker Trucks?
The projected CAGR is approximately 4.8%.
2. Which companies are prominent players in the Tanker Trucks?
Key companies in the market include Schmitz Cargobull, CIMC, Schwarzmüller Group, Kassbohrer, Feldbinder, Wabash National Corporation, Crosstand, Willig, Alura Trailer, Linder& Fische, STOKOTA, Amthor International, TANSAN, Welgro, GOFA, Schrader, Fruehauf, LBT, Tremcar, Polar Tank Trailer, Heil Trailer International, MAC Trailer.
3. What are the main segments of the Tanker Trucks?
The market segments include Application, Type.
4. Can you provide details about the market size?
The market size is estimated to be USD 2.2 billion as of 2022.
5. What are some drivers contributing to market growth?
N/A
6. What are the notable trends driving market growth?
N/A
7. Are there any restraints impacting market growth?
N/A
8. Can you provide examples of recent developments in the market?
N/A
9. What pricing options are available for accessing the report?
Pricing options include single-user, multi-user, and enterprise licenses priced at USD 2900.00, USD 4350.00, and USD 5800.00 respectively.
10. Is the market size provided in terms of value or volume?
The market size is provided in terms of value, measured in billion.
11. Are there any specific market keywords associated with the report?
Yes, the market keyword associated with the report is "Tanker Trucks," which aids in identifying and referencing the specific market segment covered.
12. How do I determine which pricing option suits my needs best?
The pricing options vary based on user requirements and access needs. Individual users may opt for single-user licenses, while businesses requiring broader access may choose multi-user or enterprise licenses for cost-effective access to the report.
13. Are there any additional resources or data provided in the Tanker Trucks report?
While the report offers comprehensive insights, it's advisable to review the specific contents or supplementary materials provided to ascertain if additional resources or data are available.
14. How can I stay updated on further developments or reports in the Tanker Trucks?
To stay informed about further developments, trends, and reports in the Tanker Trucks, consider subscribing to industry newsletters, following relevant companies and organizations, or regularly checking reputable industry news sources and publications.
Methodology
Step 1 - Identification of Relevant Samples Size from Population Database


Step 2 - Approaches for Defining Global Market Size (Value, Volume* & Price*)

Note*: In applicable scenarios
Step 3 - Data Sources
Primary Research
- Web Analytics
- Survey Reports
- Research Institute
- Latest Research Reports
- Opinion Leaders
Secondary Research
- Annual Reports
- White Paper
- Latest Press Release
- Industry Association
- Paid Database
- Investor Presentations

Step 4 - Data Triangulation
Involves using different sources of information in order to increase the validity of a study
These sources are likely to be stakeholders in a program - participants, other researchers, program staff, other community members, and so on.
Then we put all data in single framework & apply various statistical tools to find out the dynamic on the market.
During the analysis stage, feedback from the stakeholder groups would be compared to determine areas of agreement as well as areas of divergence