
Key Insights
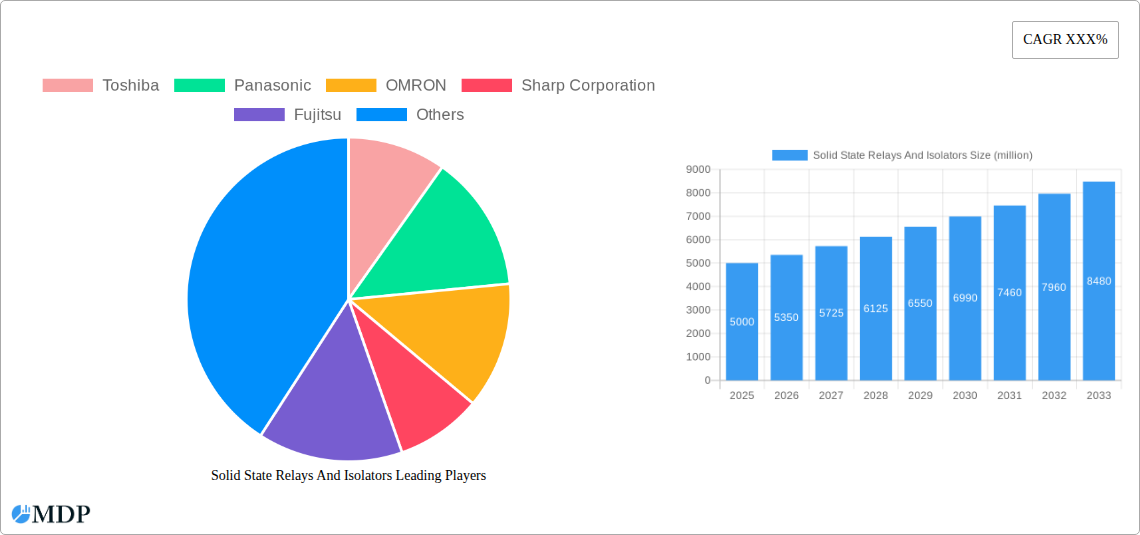
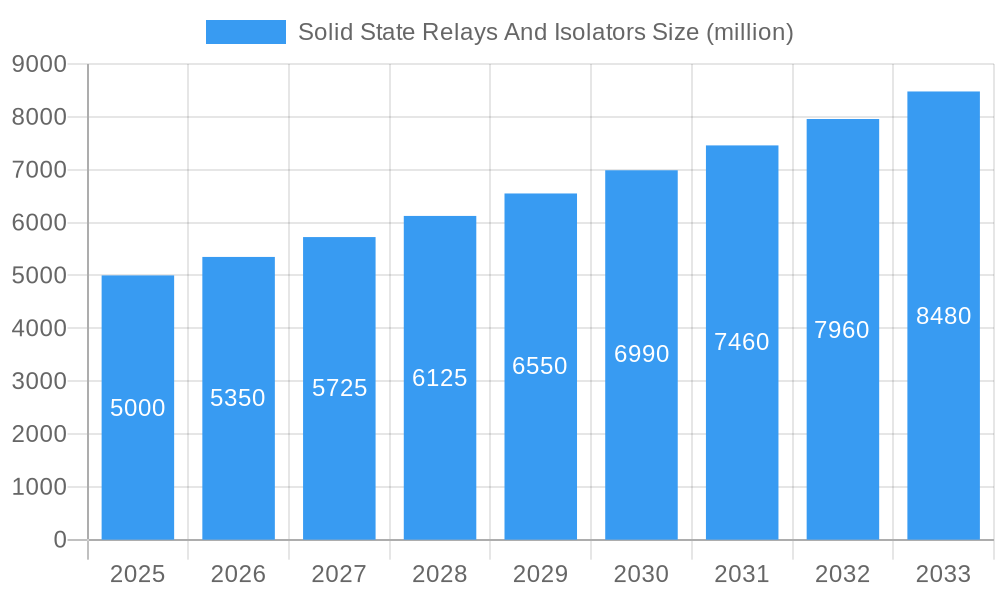
The global market for Solid State Relays (SSRs) and Isolators is experiencing robust growth, driven by increasing automation across diverse sectors. The rising adoption of SSRs and isolators in industrial automation, automotive applications (particularly electric vehicles), and home appliances is a key factor fueling this expansion. The shift towards energy-efficient and reliable switching solutions, coupled with the inherent advantages of SSRs and isolators—such as longer lifespan, noise reduction, and improved control—is further propelling market growth. We estimate the market size in 2025 to be approximately $5 billion, based on reasonable projections considering the current growth trajectory and penetration rates in various applications. A Compound Annual Growth Rate (CAGR) of 7% is projected from 2025 to 2033, indicating a substantial market opportunity. Significant regional variations exist; North America and Europe currently dominate, owing to established industrial bases and high technological adoption. However, Asia-Pacific is poised for significant expansion, fueled by rapid industrialization and increasing investments in smart infrastructure. Market segmentation reveals a strong demand for solid-state relays over isolators, reflecting their versatility and broader applications. Restraints include high initial costs compared to electromechanical relays and potential challenges related to thermal management in high-power applications. However, ongoing technological advancements, such as the development of more efficient and cost-effective SSRs and isolators, are mitigating these challenges.
Solid State Relays And Isolators Market Size (In Billion)
The competitive landscape is characterized by a mix of established players and emerging companies. Major industry participants, including Toshiba, Panasonic, OMRON, and others, are investing heavily in research and development to enhance product performance, expand their product portfolios, and cater to evolving customer demands. The market is also witnessing the emergence of innovative solutions and specialized SSRs tailored to specific industry needs. This competitive intensity is likely to further drive innovation and price optimization, benefiting end-users. The forecast period of 2025-2033 offers significant opportunities for market players to capitalize on the growing demand for reliable and efficient switching solutions across various applications and geographical regions. Strategies focused on product diversification, strategic partnerships, and expansion into emerging markets are likely to prove successful in the long term.
Solid State Relays And Isolators Company Market Share
Solid State Relays and Isolators Market Report: A Comprehensive Analysis (2019-2033)
This comprehensive report provides an in-depth analysis of the global solid state relays and isolators market, projecting a market value exceeding $XX million by 2033. The study covers the period from 2019 to 2033, with 2025 serving as both the base and estimated year. This report is essential for industry stakeholders, investors, and strategic decision-makers seeking to understand market dynamics, key players, and future growth opportunities within this rapidly evolving sector. The report leverages rigorous data analysis and expert insights to deliver actionable intelligence.
Solid State Relays And Isolators Market Dynamics & Concentration
The global solid state relays and isolators market is characterized by a moderately concentrated landscape, with several key players holding significant market share. In 2025, the top five companies – Toshiba, Panasonic, OMRON, Sharp Corporation, and Fujitsu – collectively held an estimated xx% market share. However, the market also exhibits a considerable presence of smaller, specialized players catering to niche segments.
Market concentration is influenced by factors such as economies of scale, technological innovation, and strategic mergers and acquisitions (M&A). Over the historical period (2019-2024), we witnessed approximately xx M&A deals, primarily driven by the desire to expand product portfolios and geographic reach. Regulatory frameworks, particularly those focusing on energy efficiency and safety standards, significantly impact market dynamics. The increasing adoption of solid-state technology in various applications is driving substitution away from traditional electromechanical relays. End-user trends, including the preference for higher efficiency and longer lifespan components, are further bolstering market growth.
- Key Market Dynamics:
- High market concentration among leading players.
- Significant M&A activity driving consolidation.
- Stringent regulatory frameworks influencing product development.
- Increasing substitution of electromechanical relays.
- Growing demand for energy-efficient and long-lasting components.
Solid State Relays And Isolators Industry Trends & Analysis
The solid state relays and isolators market is experiencing robust growth, driven by increasing automation across various industries and the ongoing adoption of smart technologies. The Compound Annual Growth Rate (CAGR) during the forecast period (2025-2033) is estimated to be xx%, exceeding the historical CAGR of xx% (2019-2024). This accelerated growth is attributed to several key trends:
The rising demand for industrial automation, particularly in manufacturing and process industries, is a major driver. Technological advancements, such as the development of smaller, more efficient, and higher-power solid-state relays, are expanding application possibilities. Consumer preference for energy-efficient appliances in the home appliances segment is creating substantial market opportunities. Intense competitive dynamics, marked by continuous product innovation and aggressive pricing strategies, are shaping the market landscape. Market penetration is particularly strong in developed economies, with developing nations rapidly catching up.
Leading Markets & Segments in Solid State Relays And Isolators
The industrial sector currently dominates the application segment, accounting for approximately xx% of the total market revenue in 2025. This dominance is driven by the increasing adoption of automation in manufacturing, process control, and power distribution systems. The automotive sector is another significant segment, fueled by the electrification of vehicles and the integration of advanced driver-assistance systems (ADAS). Solid State Relays (SSRs) represent the larger portion of the type segment, with a market share of approximately xx% in 2025, reflecting their broader applicability compared to Solid State Isolators (SSIs). Among regions, North America and Europe currently lead, benefitting from established industrial infrastructure and robust technological adoption.
Key Drivers for Industrial Segment Dominance:
- High levels of industrial automation
- Growing demand for process control and monitoring solutions
- Stringent safety and reliability requirements
Key Drivers for Automotive Segment Growth:
- Electrification of vehicles
- Development of ADAS
- Rising demand for efficient power management systems
Dominant Region Analysis:
- North America and Europe benefit from established industrial bases and high technological adoption rates.
- Asia-Pacific is expected to experience significant growth due to rising industrialization and automation.
Solid State Relays And Isolators Product Developments
Recent product innovations focus on enhanced efficiency, improved thermal management, increased switching speeds, and miniaturization. New applications are emerging in renewable energy systems, smart grids, and high-power industrial equipment. Competitive advantages are increasingly centered on superior performance, reliability, and integration capabilities. The industry is witnessing a shift towards highly integrated solutions that combine several functionalities into single components, minimizing system complexity and improving overall efficiency. Technological trends point towards the adoption of wide bandgap semiconductor materials (e.g., SiC, GaN) to further enhance performance and efficiency.
Key Drivers of Solid State Relays And Isolators Growth
Several factors contribute to the strong growth trajectory of the solid-state relays and isolators market. Technological advancements, particularly the development of more efficient and compact devices, are a primary driver. The increasing demand for automation across various industries, coupled with stringent energy efficiency regulations, further fuels market growth. Economic factors, such as rising industrial output and investment in infrastructure projects, also contribute to increased demand. Government initiatives promoting energy conservation and industrial automation are creating a supportive regulatory environment.
Challenges in the Solid State Relays And Isolators Market
The market faces challenges such as high initial investment costs associated with the adoption of solid-state technology. Supply chain disruptions can impact production and availability, leading to potential price fluctuations. Intense competition among established players and emerging entrants creates pressure on pricing and profit margins. Regulatory hurdles and evolving safety standards pose ongoing challenges for manufacturers. These factors collectively may impact the market’s growth trajectory by approximately xx% in the coming years.
Emerging Opportunities in Solid State Relays And Isolators
Long-term growth is fueled by several emerging opportunities. Technological breakthroughs, such as the wider adoption of wide bandgap semiconductors, promise enhanced performance and efficiency. Strategic partnerships between manufacturers and end-users can drive innovation and market penetration. Market expansion strategies focusing on emerging economies with growing industrial sectors are likely to yield significant returns. The development of smart grid infrastructure presents new opportunities for the application of solid-state relays and isolators in power management and distribution.
Leading Players in the Solid State Relays And Isolators Sector
- Toshiba
- Panasonic
- OMRON
- Sharp Corporation
- Fujitsu
- Broadcom
- Vishay
- Sensata Technology
- Infineon
- Texas Instruments
- Carlo Gavazzi
- Celduc
- Schneider Electric
- Siemens
- Rockwell Automation
- Opto 22
- GOLD SSR Relay
- BRIGHT TOWARD INDUSTRIAL CO., LTD.
- Tianhao Electronics
- COSMO Electronics
Key Milestones in Solid State Relays And Isolators Industry
- 2020: Introduction of xx% more efficient SSRs by Toshiba.
- 2021: Merger between xx and xx, creating a larger market player.
- 2022: Launch of a new generation of high-power SSIs by Infineon.
- 2023: Implementation of new safety standards impacting the market.
- 2024: Significant investment in R&D by leading companies focusing on SiC-based devices.
Strategic Outlook for Solid State Relays And Isolators Market
The solid state relays and isolators market holds immense future potential, driven by ongoing technological advancements and the expansion of automation across diverse sectors. Strategic opportunities lie in focusing on niche applications, such as renewable energy and smart grids, and in developing innovative solutions that address the evolving needs of end-users. Companies investing in R&D, enhancing supply chain resilience, and exploring strategic partnerships are poised to capitalize on the considerable growth prospects within this dynamic market.
Solid State Relays And Isolators Segmentation
-
1. Application
- 1.1. Industrial
- 1.2. Automotive
- 1.3. Home Appliances
- 1.4. Others
-
2. Type
- 2.1. Solid State Relays
- 2.2. Solid State Isolators
Solid State Relays And Isolators Segmentation By Geography
-
1. North America
- 1.1. United States
- 1.2. Canada
- 1.3. Mexico
-
2. South America
- 2.1. Brazil
- 2.2. Argentina
- 2.3. Rest of South America
-
3. Europe
- 3.1. United Kingdom
- 3.2. Germany
- 3.3. France
- 3.4. Italy
- 3.5. Spain
- 3.6. Russia
- 3.7. Benelux
- 3.8. Nordics
- 3.9. Rest of Europe
-
4. Middle East & Africa
- 4.1. Turkey
- 4.2. Israel
- 4.3. GCC
- 4.4. North Africa
- 4.5. South Africa
- 4.6. Rest of Middle East & Africa
-
5. Asia Pacific
- 5.1. China
- 5.2. India
- 5.3. Japan
- 5.4. South Korea
- 5.5. ASEAN
- 5.6. Oceania
- 5.7. Rest of Asia Pacific

Solid State Relays And Isolators Regional Market Share
Geographic Coverage of Solid State Relays And Isolators
Solid State Relays And Isolators REPORT HIGHLIGHTS
| Aspects | Details |
|---|---|
| Study Period | 2020-2034 |
| Base Year | 2025 |
| Estimated Year | 2026 |
| Forecast Period | 2026-2034 |
| Historical Period | 2020-2025 |
| Growth Rate | CAGR of XXX% from 2020-2034 |
| Segmentation |
|
Table of Contents
- 1. Introduction
- 1.1. Research Scope
- 1.2. Market Segmentation
- 1.3. Research Methodology
- 1.4. Definitions and Assumptions
- 2. Executive Summary
- 2.1. Introduction
- 3. Market Dynamics
- 3.1. Introduction
- 3.2. Market Drivers
- 3.3. Market Restrains
- 3.4. Market Trends
- 4. Market Factor Analysis
- 4.1. Porters Five Forces
- 4.2. Supply/Value Chain
- 4.3. PESTEL analysis
- 4.4. Market Entropy
- 4.5. Patent/Trademark Analysis
- 5. Global Solid State Relays And Isolators Analysis, Insights and Forecast, 2020-2032
- 5.1. Market Analysis, Insights and Forecast - by Application
- 5.1.1. Industrial
- 5.1.2. Automotive
- 5.1.3. Home Appliances
- 5.1.4. Others
- 5.2. Market Analysis, Insights and Forecast - by Type
- 5.2.1. Solid State Relays
- 5.2.2. Solid State Isolators
- 5.3. Market Analysis, Insights and Forecast - by Region
- 5.3.1. North America
- 5.3.2. South America
- 5.3.3. Europe
- 5.3.4. Middle East & Africa
- 5.3.5. Asia Pacific
- 5.1. Market Analysis, Insights and Forecast - by Application
- 6. North America Solid State Relays And Isolators Analysis, Insights and Forecast, 2020-2032
- 6.1. Market Analysis, Insights and Forecast - by Application
- 6.1.1. Industrial
- 6.1.2. Automotive
- 6.1.3. Home Appliances
- 6.1.4. Others
- 6.2. Market Analysis, Insights and Forecast - by Type
- 6.2.1. Solid State Relays
- 6.2.2. Solid State Isolators
- 6.1. Market Analysis, Insights and Forecast - by Application
- 7. South America Solid State Relays And Isolators Analysis, Insights and Forecast, 2020-2032
- 7.1. Market Analysis, Insights and Forecast - by Application
- 7.1.1. Industrial
- 7.1.2. Automotive
- 7.1.3. Home Appliances
- 7.1.4. Others
- 7.2. Market Analysis, Insights and Forecast - by Type
- 7.2.1. Solid State Relays
- 7.2.2. Solid State Isolators
- 7.1. Market Analysis, Insights and Forecast - by Application
- 8. Europe Solid State Relays And Isolators Analysis, Insights and Forecast, 2020-2032
- 8.1. Market Analysis, Insights and Forecast - by Application
- 8.1.1. Industrial
- 8.1.2. Automotive
- 8.1.3. Home Appliances
- 8.1.4. Others
- 8.2. Market Analysis, Insights and Forecast - by Type
- 8.2.1. Solid State Relays
- 8.2.2. Solid State Isolators
- 8.1. Market Analysis, Insights and Forecast - by Application
- 9. Middle East & Africa Solid State Relays And Isolators Analysis, Insights and Forecast, 2020-2032
- 9.1. Market Analysis, Insights and Forecast - by Application
- 9.1.1. Industrial
- 9.1.2. Automotive
- 9.1.3. Home Appliances
- 9.1.4. Others
- 9.2. Market Analysis, Insights and Forecast - by Type
- 9.2.1. Solid State Relays
- 9.2.2. Solid State Isolators
- 9.1. Market Analysis, Insights and Forecast - by Application
- 10. Asia Pacific Solid State Relays And Isolators Analysis, Insights and Forecast, 2020-2032
- 10.1. Market Analysis, Insights and Forecast - by Application
- 10.1.1. Industrial
- 10.1.2. Automotive
- 10.1.3. Home Appliances
- 10.1.4. Others
- 10.2. Market Analysis, Insights and Forecast - by Type
- 10.2.1. Solid State Relays
- 10.2.2. Solid State Isolators
- 10.1. Market Analysis, Insights and Forecast - by Application
- 11. Competitive Analysis
- 11.1. Global Market Share Analysis 2025
- 11.2. Company Profiles
- 11.2.1 Toshiba
- 11.2.1.1. Overview
- 11.2.1.2. Products
- 11.2.1.3. SWOT Analysis
- 11.2.1.4. Recent Developments
- 11.2.1.5. Financials (Based on Availability)
- 11.2.2 Panasonic
- 11.2.2.1. Overview
- 11.2.2.2. Products
- 11.2.2.3. SWOT Analysis
- 11.2.2.4. Recent Developments
- 11.2.2.5. Financials (Based on Availability)
- 11.2.3 OMRON
- 11.2.3.1. Overview
- 11.2.3.2. Products
- 11.2.3.3. SWOT Analysis
- 11.2.3.4. Recent Developments
- 11.2.3.5. Financials (Based on Availability)
- 11.2.4 Sharp Corporation
- 11.2.4.1. Overview
- 11.2.4.2. Products
- 11.2.4.3. SWOT Analysis
- 11.2.4.4. Recent Developments
- 11.2.4.5. Financials (Based on Availability)
- 11.2.5 Fujitsu
- 11.2.5.1. Overview
- 11.2.5.2. Products
- 11.2.5.3. SWOT Analysis
- 11.2.5.4. Recent Developments
- 11.2.5.5. Financials (Based on Availability)
- 11.2.6 Broadcom
- 11.2.6.1. Overview
- 11.2.6.2. Products
- 11.2.6.3. SWOT Analysis
- 11.2.6.4. Recent Developments
- 11.2.6.5. Financials (Based on Availability)
- 11.2.7 Vishay
- 11.2.7.1. Overview
- 11.2.7.2. Products
- 11.2.7.3. SWOT Analysis
- 11.2.7.4. Recent Developments
- 11.2.7.5. Financials (Based on Availability)
- 11.2.8 Sensata Technology
- 11.2.8.1. Overview
- 11.2.8.2. Products
- 11.2.8.3. SWOT Analysis
- 11.2.8.4. Recent Developments
- 11.2.8.5. Financials (Based on Availability)
- 11.2.9 Infineon
- 11.2.9.1. Overview
- 11.2.9.2. Products
- 11.2.9.3. SWOT Analysis
- 11.2.9.4. Recent Developments
- 11.2.9.5. Financials (Based on Availability)
- 11.2.10 Texas Instruments
- 11.2.10.1. Overview
- 11.2.10.2. Products
- 11.2.10.3. SWOT Analysis
- 11.2.10.4. Recent Developments
- 11.2.10.5. Financials (Based on Availability)
- 11.2.11 Carlo gavazzi
- 11.2.11.1. Overview
- 11.2.11.2. Products
- 11.2.11.3. SWOT Analysis
- 11.2.11.4. Recent Developments
- 11.2.11.5. Financials (Based on Availability)
- 11.2.12 Celduc
- 11.2.12.1. Overview
- 11.2.12.2. Products
- 11.2.12.3. SWOT Analysis
- 11.2.12.4. Recent Developments
- 11.2.12.5. Financials (Based on Availability)
- 11.2.13 Schneider
- 11.2.13.1. Overview
- 11.2.13.2. Products
- 11.2.13.3. SWOT Analysis
- 11.2.13.4. Recent Developments
- 11.2.13.5. Financials (Based on Availability)
- 11.2.14 Siemens
- 11.2.14.1. Overview
- 11.2.14.2. Products
- 11.2.14.3. SWOT Analysis
- 11.2.14.4. Recent Developments
- 11.2.14.5. Financials (Based on Availability)
- 11.2.15 Rockwell Automation
- 11.2.15.1. Overview
- 11.2.15.2. Products
- 11.2.15.3. SWOT Analysis
- 11.2.15.4. Recent Developments
- 11.2.15.5. Financials (Based on Availability)
- 11.2.16 Opto 22
- 11.2.16.1. Overview
- 11.2.16.2. Products
- 11.2.16.3. SWOT Analysis
- 11.2.16.4. Recent Developments
- 11.2.16.5. Financials (Based on Availability)
- 11.2.17 GOLD SSR Relay
- 11.2.17.1. Overview
- 11.2.17.2. Products
- 11.2.17.3. SWOT Analysis
- 11.2.17.4. Recent Developments
- 11.2.17.5. Financials (Based on Availability)
- 11.2.18 BRIGHT TOWARD INDUSTRIAL CO. LTD.
- 11.2.18.1. Overview
- 11.2.18.2. Products
- 11.2.18.3. SWOT Analysis
- 11.2.18.4. Recent Developments
- 11.2.18.5. Financials (Based on Availability)
- 11.2.19 Tianhao Electronics
- 11.2.19.1. Overview
- 11.2.19.2. Products
- 11.2.19.3. SWOT Analysis
- 11.2.19.4. Recent Developments
- 11.2.19.5. Financials (Based on Availability)
- 11.2.20 COSMO Electronics
- 11.2.20.1. Overview
- 11.2.20.2. Products
- 11.2.20.3. SWOT Analysis
- 11.2.20.4. Recent Developments
- 11.2.20.5. Financials (Based on Availability)
- 11.2.1 Toshiba
List of Figures
- Figure 1: Global Solid State Relays And Isolators Revenue Breakdown (million, %) by Region 2025 & 2033
- Figure 2: Global Solid State Relays And Isolators Volume Breakdown (K, %) by Region 2025 & 2033
- Figure 3: North America Solid State Relays And Isolators Revenue (million), by Application 2025 & 2033
- Figure 4: North America Solid State Relays And Isolators Volume (K), by Application 2025 & 2033
- Figure 5: North America Solid State Relays And Isolators Revenue Share (%), by Application 2025 & 2033
- Figure 6: North America Solid State Relays And Isolators Volume Share (%), by Application 2025 & 2033
- Figure 7: North America Solid State Relays And Isolators Revenue (million), by Type 2025 & 2033
- Figure 8: North America Solid State Relays And Isolators Volume (K), by Type 2025 & 2033
- Figure 9: North America Solid State Relays And Isolators Revenue Share (%), by Type 2025 & 2033
- Figure 10: North America Solid State Relays And Isolators Volume Share (%), by Type 2025 & 2033
- Figure 11: North America Solid State Relays And Isolators Revenue (million), by Country 2025 & 2033
- Figure 12: North America Solid State Relays And Isolators Volume (K), by Country 2025 & 2033
- Figure 13: North America Solid State Relays And Isolators Revenue Share (%), by Country 2025 & 2033
- Figure 14: North America Solid State Relays And Isolators Volume Share (%), by Country 2025 & 2033
- Figure 15: South America Solid State Relays And Isolators Revenue (million), by Application 2025 & 2033
- Figure 16: South America Solid State Relays And Isolators Volume (K), by Application 2025 & 2033
- Figure 17: South America Solid State Relays And Isolators Revenue Share (%), by Application 2025 & 2033
- Figure 18: South America Solid State Relays And Isolators Volume Share (%), by Application 2025 & 2033
- Figure 19: South America Solid State Relays And Isolators Revenue (million), by Type 2025 & 2033
- Figure 20: South America Solid State Relays And Isolators Volume (K), by Type 2025 & 2033
- Figure 21: South America Solid State Relays And Isolators Revenue Share (%), by Type 2025 & 2033
- Figure 22: South America Solid State Relays And Isolators Volume Share (%), by Type 2025 & 2033
- Figure 23: South America Solid State Relays And Isolators Revenue (million), by Country 2025 & 2033
- Figure 24: South America Solid State Relays And Isolators Volume (K), by Country 2025 & 2033
- Figure 25: South America Solid State Relays And Isolators Revenue Share (%), by Country 2025 & 2033
- Figure 26: South America Solid State Relays And Isolators Volume Share (%), by Country 2025 & 2033
- Figure 27: Europe Solid State Relays And Isolators Revenue (million), by Application 2025 & 2033
- Figure 28: Europe Solid State Relays And Isolators Volume (K), by Application 2025 & 2033
- Figure 29: Europe Solid State Relays And Isolators Revenue Share (%), by Application 2025 & 2033
- Figure 30: Europe Solid State Relays And Isolators Volume Share (%), by Application 2025 & 2033
- Figure 31: Europe Solid State Relays And Isolators Revenue (million), by Type 2025 & 2033
- Figure 32: Europe Solid State Relays And Isolators Volume (K), by Type 2025 & 2033
- Figure 33: Europe Solid State Relays And Isolators Revenue Share (%), by Type 2025 & 2033
- Figure 34: Europe Solid State Relays And Isolators Volume Share (%), by Type 2025 & 2033
- Figure 35: Europe Solid State Relays And Isolators Revenue (million), by Country 2025 & 2033
- Figure 36: Europe Solid State Relays And Isolators Volume (K), by Country 2025 & 2033
- Figure 37: Europe Solid State Relays And Isolators Revenue Share (%), by Country 2025 & 2033
- Figure 38: Europe Solid State Relays And Isolators Volume Share (%), by Country 2025 & 2033
- Figure 39: Middle East & Africa Solid State Relays And Isolators Revenue (million), by Application 2025 & 2033
- Figure 40: Middle East & Africa Solid State Relays And Isolators Volume (K), by Application 2025 & 2033
- Figure 41: Middle East & Africa Solid State Relays And Isolators Revenue Share (%), by Application 2025 & 2033
- Figure 42: Middle East & Africa Solid State Relays And Isolators Volume Share (%), by Application 2025 & 2033
- Figure 43: Middle East & Africa Solid State Relays And Isolators Revenue (million), by Type 2025 & 2033
- Figure 44: Middle East & Africa Solid State Relays And Isolators Volume (K), by Type 2025 & 2033
- Figure 45: Middle East & Africa Solid State Relays And Isolators Revenue Share (%), by Type 2025 & 2033
- Figure 46: Middle East & Africa Solid State Relays And Isolators Volume Share (%), by Type 2025 & 2033
- Figure 47: Middle East & Africa Solid State Relays And Isolators Revenue (million), by Country 2025 & 2033
- Figure 48: Middle East & Africa Solid State Relays And Isolators Volume (K), by Country 2025 & 2033
- Figure 49: Middle East & Africa Solid State Relays And Isolators Revenue Share (%), by Country 2025 & 2033
- Figure 50: Middle East & Africa Solid State Relays And Isolators Volume Share (%), by Country 2025 & 2033
- Figure 51: Asia Pacific Solid State Relays And Isolators Revenue (million), by Application 2025 & 2033
- Figure 52: Asia Pacific Solid State Relays And Isolators Volume (K), by Application 2025 & 2033
- Figure 53: Asia Pacific Solid State Relays And Isolators Revenue Share (%), by Application 2025 & 2033
- Figure 54: Asia Pacific Solid State Relays And Isolators Volume Share (%), by Application 2025 & 2033
- Figure 55: Asia Pacific Solid State Relays And Isolators Revenue (million), by Type 2025 & 2033
- Figure 56: Asia Pacific Solid State Relays And Isolators Volume (K), by Type 2025 & 2033
- Figure 57: Asia Pacific Solid State Relays And Isolators Revenue Share (%), by Type 2025 & 2033
- Figure 58: Asia Pacific Solid State Relays And Isolators Volume Share (%), by Type 2025 & 2033
- Figure 59: Asia Pacific Solid State Relays And Isolators Revenue (million), by Country 2025 & 2033
- Figure 60: Asia Pacific Solid State Relays And Isolators Volume (K), by Country 2025 & 2033
- Figure 61: Asia Pacific Solid State Relays And Isolators Revenue Share (%), by Country 2025 & 2033
- Figure 62: Asia Pacific Solid State Relays And Isolators Volume Share (%), by Country 2025 & 2033
List of Tables
- Table 1: Global Solid State Relays And Isolators Revenue million Forecast, by Application 2020 & 2033
- Table 2: Global Solid State Relays And Isolators Volume K Forecast, by Application 2020 & 2033
- Table 3: Global Solid State Relays And Isolators Revenue million Forecast, by Type 2020 & 2033
- Table 4: Global Solid State Relays And Isolators Volume K Forecast, by Type 2020 & 2033
- Table 5: Global Solid State Relays And Isolators Revenue million Forecast, by Region 2020 & 2033
- Table 6: Global Solid State Relays And Isolators Volume K Forecast, by Region 2020 & 2033
- Table 7: Global Solid State Relays And Isolators Revenue million Forecast, by Application 2020 & 2033
- Table 8: Global Solid State Relays And Isolators Volume K Forecast, by Application 2020 & 2033
- Table 9: Global Solid State Relays And Isolators Revenue million Forecast, by Type 2020 & 2033
- Table 10: Global Solid State Relays And Isolators Volume K Forecast, by Type 2020 & 2033
- Table 11: Global Solid State Relays And Isolators Revenue million Forecast, by Country 2020 & 2033
- Table 12: Global Solid State Relays And Isolators Volume K Forecast, by Country 2020 & 2033
- Table 13: United States Solid State Relays And Isolators Revenue (million) Forecast, by Application 2020 & 2033
- Table 14: United States Solid State Relays And Isolators Volume (K) Forecast, by Application 2020 & 2033
- Table 15: Canada Solid State Relays And Isolators Revenue (million) Forecast, by Application 2020 & 2033
- Table 16: Canada Solid State Relays And Isolators Volume (K) Forecast, by Application 2020 & 2033
- Table 17: Mexico Solid State Relays And Isolators Revenue (million) Forecast, by Application 2020 & 2033
- Table 18: Mexico Solid State Relays And Isolators Volume (K) Forecast, by Application 2020 & 2033
- Table 19: Global Solid State Relays And Isolators Revenue million Forecast, by Application 2020 & 2033
- Table 20: Global Solid State Relays And Isolators Volume K Forecast, by Application 2020 & 2033
- Table 21: Global Solid State Relays And Isolators Revenue million Forecast, by Type 2020 & 2033
- Table 22: Global Solid State Relays And Isolators Volume K Forecast, by Type 2020 & 2033
- Table 23: Global Solid State Relays And Isolators Revenue million Forecast, by Country 2020 & 2033
- Table 24: Global Solid State Relays And Isolators Volume K Forecast, by Country 2020 & 2033
- Table 25: Brazil Solid State Relays And Isolators Revenue (million) Forecast, by Application 2020 & 2033
- Table 26: Brazil Solid State Relays And Isolators Volume (K) Forecast, by Application 2020 & 2033
- Table 27: Argentina Solid State Relays And Isolators Revenue (million) Forecast, by Application 2020 & 2033
- Table 28: Argentina Solid State Relays And Isolators Volume (K) Forecast, by Application 2020 & 2033
- Table 29: Rest of South America Solid State Relays And Isolators Revenue (million) Forecast, by Application 2020 & 2033
- Table 30: Rest of South America Solid State Relays And Isolators Volume (K) Forecast, by Application 2020 & 2033
- Table 31: Global Solid State Relays And Isolators Revenue million Forecast, by Application 2020 & 2033
- Table 32: Global Solid State Relays And Isolators Volume K Forecast, by Application 2020 & 2033
- Table 33: Global Solid State Relays And Isolators Revenue million Forecast, by Type 2020 & 2033
- Table 34: Global Solid State Relays And Isolators Volume K Forecast, by Type 2020 & 2033
- Table 35: Global Solid State Relays And Isolators Revenue million Forecast, by Country 2020 & 2033
- Table 36: Global Solid State Relays And Isolators Volume K Forecast, by Country 2020 & 2033
- Table 37: United Kingdom Solid State Relays And Isolators Revenue (million) Forecast, by Application 2020 & 2033
- Table 38: United Kingdom Solid State Relays And Isolators Volume (K) Forecast, by Application 2020 & 2033
- Table 39: Germany Solid State Relays And Isolators Revenue (million) Forecast, by Application 2020 & 2033
- Table 40: Germany Solid State Relays And Isolators Volume (K) Forecast, by Application 2020 & 2033
- Table 41: France Solid State Relays And Isolators Revenue (million) Forecast, by Application 2020 & 2033
- Table 42: France Solid State Relays And Isolators Volume (K) Forecast, by Application 2020 & 2033
- Table 43: Italy Solid State Relays And Isolators Revenue (million) Forecast, by Application 2020 & 2033
- Table 44: Italy Solid State Relays And Isolators Volume (K) Forecast, by Application 2020 & 2033
- Table 45: Spain Solid State Relays And Isolators Revenue (million) Forecast, by Application 2020 & 2033
- Table 46: Spain Solid State Relays And Isolators Volume (K) Forecast, by Application 2020 & 2033
- Table 47: Russia Solid State Relays And Isolators Revenue (million) Forecast, by Application 2020 & 2033
- Table 48: Russia Solid State Relays And Isolators Volume (K) Forecast, by Application 2020 & 2033
- Table 49: Benelux Solid State Relays And Isolators Revenue (million) Forecast, by Application 2020 & 2033
- Table 50: Benelux Solid State Relays And Isolators Volume (K) Forecast, by Application 2020 & 2033
- Table 51: Nordics Solid State Relays And Isolators Revenue (million) Forecast, by Application 2020 & 2033
- Table 52: Nordics Solid State Relays And Isolators Volume (K) Forecast, by Application 2020 & 2033
- Table 53: Rest of Europe Solid State Relays And Isolators Revenue (million) Forecast, by Application 2020 & 2033
- Table 54: Rest of Europe Solid State Relays And Isolators Volume (K) Forecast, by Application 2020 & 2033
- Table 55: Global Solid State Relays And Isolators Revenue million Forecast, by Application 2020 & 2033
- Table 56: Global Solid State Relays And Isolators Volume K Forecast, by Application 2020 & 2033
- Table 57: Global Solid State Relays And Isolators Revenue million Forecast, by Type 2020 & 2033
- Table 58: Global Solid State Relays And Isolators Volume K Forecast, by Type 2020 & 2033
- Table 59: Global Solid State Relays And Isolators Revenue million Forecast, by Country 2020 & 2033
- Table 60: Global Solid State Relays And Isolators Volume K Forecast, by Country 2020 & 2033
- Table 61: Turkey Solid State Relays And Isolators Revenue (million) Forecast, by Application 2020 & 2033
- Table 62: Turkey Solid State Relays And Isolators Volume (K) Forecast, by Application 2020 & 2033
- Table 63: Israel Solid State Relays And Isolators Revenue (million) Forecast, by Application 2020 & 2033
- Table 64: Israel Solid State Relays And Isolators Volume (K) Forecast, by Application 2020 & 2033
- Table 65: GCC Solid State Relays And Isolators Revenue (million) Forecast, by Application 2020 & 2033
- Table 66: GCC Solid State Relays And Isolators Volume (K) Forecast, by Application 2020 & 2033
- Table 67: North Africa Solid State Relays And Isolators Revenue (million) Forecast, by Application 2020 & 2033
- Table 68: North Africa Solid State Relays And Isolators Volume (K) Forecast, by Application 2020 & 2033
- Table 69: South Africa Solid State Relays And Isolators Revenue (million) Forecast, by Application 2020 & 2033
- Table 70: South Africa Solid State Relays And Isolators Volume (K) Forecast, by Application 2020 & 2033
- Table 71: Rest of Middle East & Africa Solid State Relays And Isolators Revenue (million) Forecast, by Application 2020 & 2033
- Table 72: Rest of Middle East & Africa Solid State Relays And Isolators Volume (K) Forecast, by Application 2020 & 2033
- Table 73: Global Solid State Relays And Isolators Revenue million Forecast, by Application 2020 & 2033
- Table 74: Global Solid State Relays And Isolators Volume K Forecast, by Application 2020 & 2033
- Table 75: Global Solid State Relays And Isolators Revenue million Forecast, by Type 2020 & 2033
- Table 76: Global Solid State Relays And Isolators Volume K Forecast, by Type 2020 & 2033
- Table 77: Global Solid State Relays And Isolators Revenue million Forecast, by Country 2020 & 2033
- Table 78: Global Solid State Relays And Isolators Volume K Forecast, by Country 2020 & 2033
- Table 79: China Solid State Relays And Isolators Revenue (million) Forecast, by Application 2020 & 2033
- Table 80: China Solid State Relays And Isolators Volume (K) Forecast, by Application 2020 & 2033
- Table 81: India Solid State Relays And Isolators Revenue (million) Forecast, by Application 2020 & 2033
- Table 82: India Solid State Relays And Isolators Volume (K) Forecast, by Application 2020 & 2033
- Table 83: Japan Solid State Relays And Isolators Revenue (million) Forecast, by Application 2020 & 2033
- Table 84: Japan Solid State Relays And Isolators Volume (K) Forecast, by Application 2020 & 2033
- Table 85: South Korea Solid State Relays And Isolators Revenue (million) Forecast, by Application 2020 & 2033
- Table 86: South Korea Solid State Relays And Isolators Volume (K) Forecast, by Application 2020 & 2033
- Table 87: ASEAN Solid State Relays And Isolators Revenue (million) Forecast, by Application 2020 & 2033
- Table 88: ASEAN Solid State Relays And Isolators Volume (K) Forecast, by Application 2020 & 2033
- Table 89: Oceania Solid State Relays And Isolators Revenue (million) Forecast, by Application 2020 & 2033
- Table 90: Oceania Solid State Relays And Isolators Volume (K) Forecast, by Application 2020 & 2033
- Table 91: Rest of Asia Pacific Solid State Relays And Isolators Revenue (million) Forecast, by Application 2020 & 2033
- Table 92: Rest of Asia Pacific Solid State Relays And Isolators Volume (K) Forecast, by Application 2020 & 2033
Frequently Asked Questions
1. What is the projected Compound Annual Growth Rate (CAGR) of the Solid State Relays And Isolators?
The projected CAGR is approximately XXX%.
2. Which companies are prominent players in the Solid State Relays And Isolators?
Key companies in the market include Toshiba, Panasonic, OMRON, Sharp Corporation, Fujitsu, Broadcom, Vishay, Sensata Technology, Infineon, Texas Instruments, Carlo gavazzi, Celduc, Schneider, Siemens, Rockwell Automation, Opto 22, GOLD SSR Relay, BRIGHT TOWARD INDUSTRIAL CO., LTD., Tianhao Electronics, COSMO Electronics.
3. What are the main segments of the Solid State Relays And Isolators?
The market segments include Application, Type.
4. Can you provide details about the market size?
The market size is estimated to be USD XXX million as of 2022.
5. What are some drivers contributing to market growth?
N/A
6. What are the notable trends driving market growth?
N/A
7. Are there any restraints impacting market growth?
N/A
8. Can you provide examples of recent developments in the market?
N/A
9. What pricing options are available for accessing the report?
Pricing options include single-user, multi-user, and enterprise licenses priced at USD 3950.00, USD 5925.00, and USD 7900.00 respectively.
10. Is the market size provided in terms of value or volume?
The market size is provided in terms of value, measured in million and volume, measured in K.
11. Are there any specific market keywords associated with the report?
Yes, the market keyword associated with the report is "Solid State Relays And Isolators," which aids in identifying and referencing the specific market segment covered.
12. How do I determine which pricing option suits my needs best?
The pricing options vary based on user requirements and access needs. Individual users may opt for single-user licenses, while businesses requiring broader access may choose multi-user or enterprise licenses for cost-effective access to the report.
13. Are there any additional resources or data provided in the Solid State Relays And Isolators report?
While the report offers comprehensive insights, it's advisable to review the specific contents or supplementary materials provided to ascertain if additional resources or data are available.
14. How can I stay updated on further developments or reports in the Solid State Relays And Isolators?
To stay informed about further developments, trends, and reports in the Solid State Relays And Isolators, consider subscribing to industry newsletters, following relevant companies and organizations, or regularly checking reputable industry news sources and publications.
Methodology
Step 1 - Identification of Relevant Samples Size from Population Database


Step 2 - Approaches for Defining Global Market Size (Value, Volume* & Price*)

Note*: In applicable scenarios
Step 3 - Data Sources
Primary Research
- Web Analytics
- Survey Reports
- Research Institute
- Latest Research Reports
- Opinion Leaders
Secondary Research
- Annual Reports
- White Paper
- Latest Press Release
- Industry Association
- Paid Database
- Investor Presentations

Step 4 - Data Triangulation
Involves using different sources of information in order to increase the validity of a study
These sources are likely to be stakeholders in a program - participants, other researchers, program staff, other community members, and so on.
Then we put all data in single framework & apply various statistical tools to find out the dynamic on the market.
During the analysis stage, feedback from the stakeholder groups would be compared to determine areas of agreement as well as areas of divergence
