

Key Insights
The global Rollover Protective Structure (ROPS) market is experiencing robust growth, projected to reach an estimated $7.4 billion in 2024 with a compound annual growth rate (CAGR) of 8.4% through 2033. This significant expansion is fueled by increasingly stringent safety regulations mandating the use of ROPS across various heavy machinery sectors, particularly in construction and agriculture. As global infrastructure development accelerates and agricultural mechanization intensifies, the demand for enhanced operator safety becomes paramount. The market is further driven by technological advancements in ROPS design, leading to lighter, more efficient, and cost-effective solutions. Leading companies in the market are investing heavily in research and development to innovate and meet the evolving safety standards, contributing to a dynamic and competitive landscape.
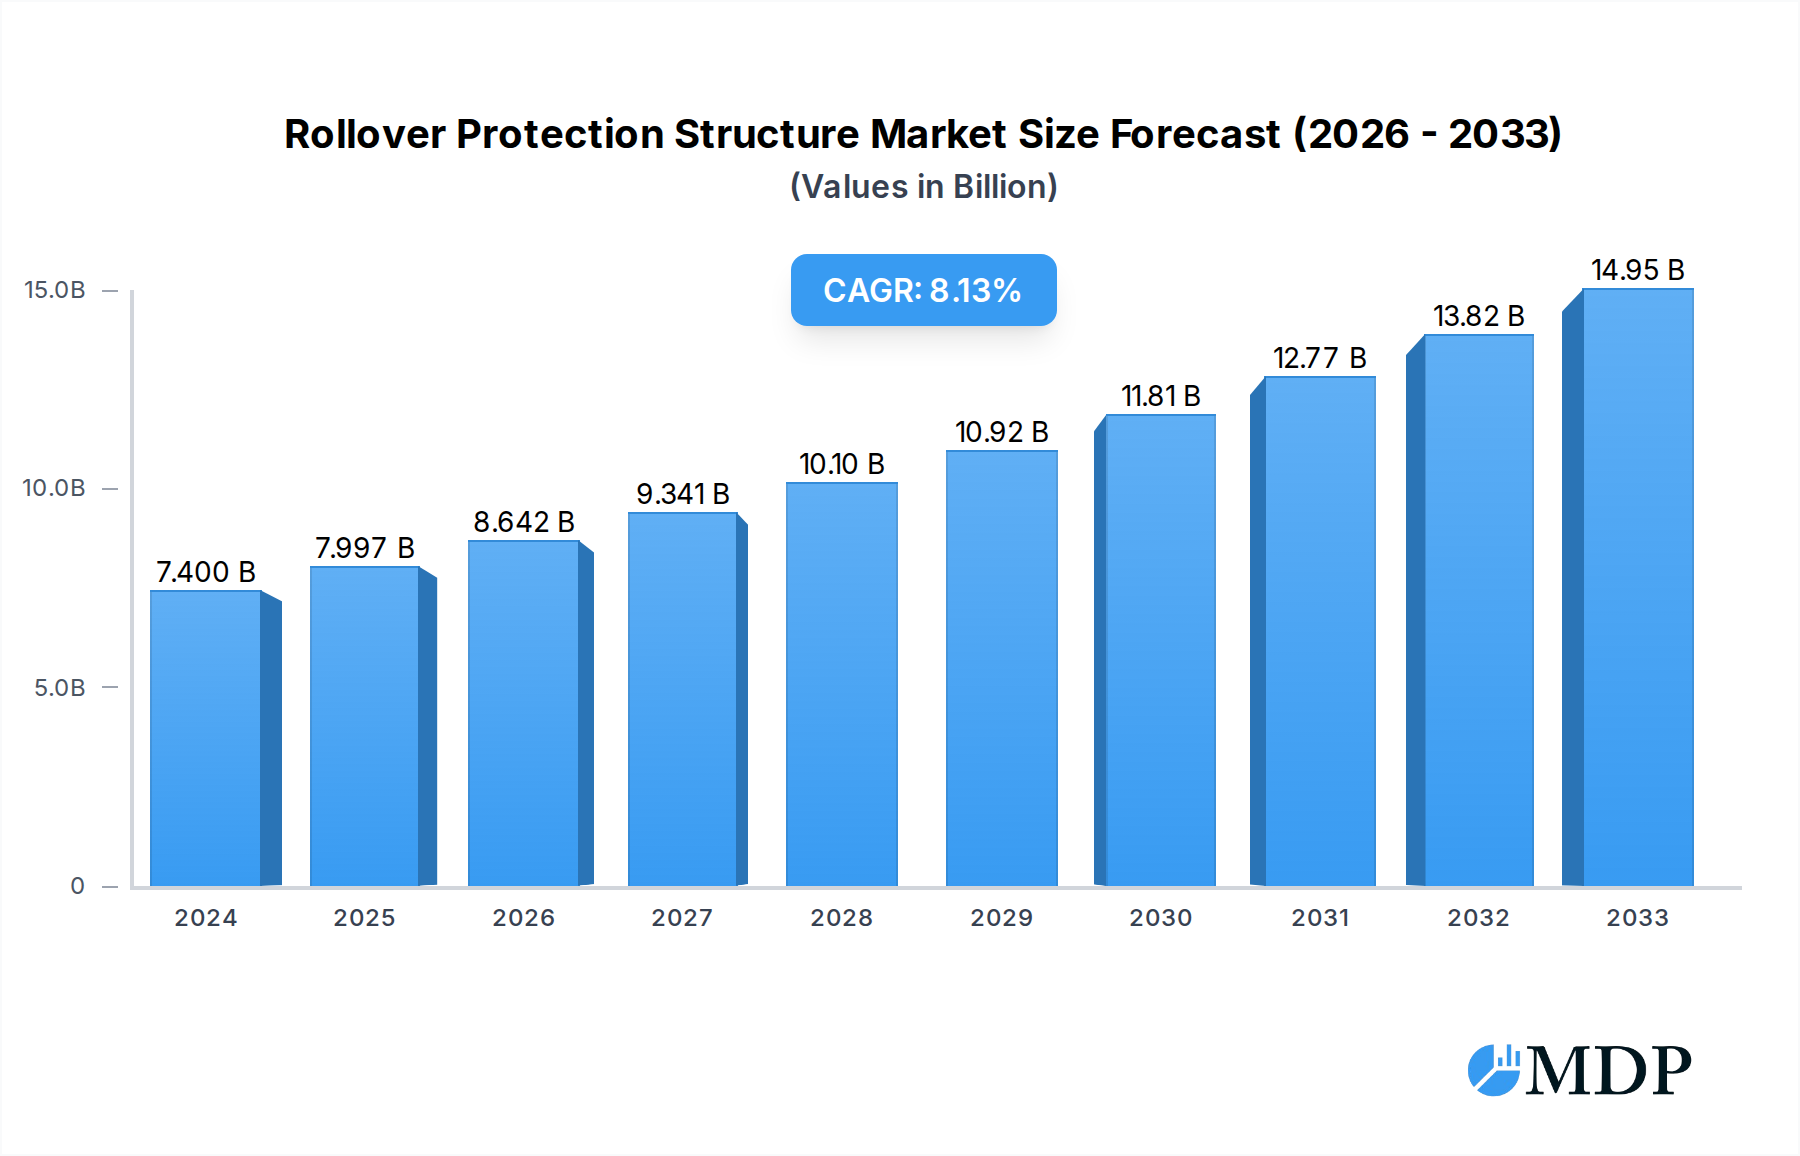
Rollover Protection Structure Market Size (In Billion)
The market's growth trajectory is also influenced by critical trends such as the development of dynamic ROPS for improved crashworthiness and the integration of advanced materials for enhanced durability and weight reduction. While the market exhibits strong upward momentum, certain restraints, such as the high initial cost of implementing ROPS for smaller machinery and the availability of less stringent safety norms in certain developing regions, present challenges. However, the overwhelming emphasis on workplace safety and the potential reduction in accident-related costs are expected to outweigh these restraints, ensuring sustained market expansion. Key segments like construction and agriculture will continue to dominate demand, with dynamic ROPS testing gaining prominence as manufacturers strive for superior safety performance.

Rollover Protection Structure Company Market Share
Unlocking Safety: The Global Rollover Protection Structure (ROPS) Market Report 2024-2033
This comprehensive report provides an in-depth analysis of the global Rollover Protection Structure (ROPS) market, offering invaluable insights for stakeholders across the construction, agriculture, and industrial sectors. Examining market dynamics, technological advancements, and future trends, this study covers the period from 2019 to 2033, with a base year of 2025 and a forecast period of 2025–2033. Gain a competitive edge with data-driven strategies and a nuanced understanding of this critical safety equipment market, valued in the billions.
Rollover Protection Structure Market Dynamics & Concentration
The global Rollover Protection Structure (ROPS) market exhibits a moderate to high concentration, with a few dominant players holding significant market share, estimated to be in the billions. Key innovation drivers include stringent safety regulations worldwide and the increasing demand for enhanced operator protection in heavy machinery. The regulatory framework is a pivotal factor, with evolving standards in regions like North America and Europe pushing manufacturers to develop advanced ROPS solutions. Product substitutes, while limited in core functionality, can include integrated cab designs offering some level of rollover protection, though dedicated ROPS systems remain the industry benchmark for heavy-duty applications. End-user trends highlight a growing preference for lighter, more ergonomic, and cost-effective ROPS solutions without compromising on safety performance. Mergers and acquisitions (M&A) activities have played a role in market consolidation, with an estimated XX M&A deals recorded in the historical period (2019-2024) as companies seek to expand their product portfolios and geographic reach. The market share of leading companies is estimated to be in the billions, reflecting the substantial revenue generated by ROPS solutions.
Rollover Protection Structure Industry Trends & Analysis
The global Rollover Protection Structure (ROPS) market is poised for robust growth, driven by an escalating emphasis on occupational safety and the increasing mechanization across key industries. The market is projected to expand at a Compound Annual Growth Rate (CAGR) of approximately XX% over the forecast period (2025–2033). Market penetration for ROPS is steadily increasing, particularly in developing economies where safety standards are being progressively adopted and enforced. Technological disruptions are at the forefront of this evolution, with advancements in materials science leading to the development of lighter yet stronger ROPS designs, enhancing fuel efficiency and operational agility. Innovations in structural engineering are also contributing to improved impact absorption capabilities and integrated operator comfort features. Consumer preferences are shifting towards custom-engineered ROPS solutions tailored to specific equipment models and operational environments, demanding greater adaptability and modularity. The competitive dynamics are characterized by a blend of established global manufacturers and regional specialists, each vying for market dominance through product innovation, strategic partnerships, and competitive pricing. The market is also witnessing a rise in demand for dynamic ROPS testing, reflecting the need for more realistic simulation of rollover events and enhanced validation of safety performance beyond static load-bearing capabilities. The overall market value is projected to reach several billion dollars by the end of the forecast period.
Leading Markets & Segments in Rollover Protection Structure
The Construction segment emerges as the dominant force within the global Rollover Protection Structure (ROPS) market, driven by extensive infrastructure development projects and a consistent demand for heavy machinery in urban and rural construction sites. Regions like North America and Europe lead in ROPS adoption due to stringent safety regulations and a mature construction industry.
- Construction:
- Key Drivers: Significant government investments in infrastructure, urbanization trends, and a high rate of heavy equipment deployment in road building, housing, and commercial projects. Increased focus on operator safety mandates higher ROPS compliance for excavators, loaders, dozers, and cranes.
- Dominance Analysis: The construction sector accounts for an estimated XX% of the total ROPS market share, with North America alone contributing billions in annual revenue due to its extensive construction activities. The demand for both dynamic and static ROPS testing is high, ensuring compliance with standards like SAE J2194 and ISO 3471.
The Agriculture sector also represents a substantial and growing market for ROPS, fueled by the global need for increased food production and the ongoing mechanization of farming practices.
- Agriculture:
- Key Drivers: Growing global population, demand for efficient agricultural output, and government initiatives promoting modern farming techniques. Tractors and other agricultural machinery are increasingly equipped with ROPS as standard, particularly in regions with a high incidence of tractor rollovers.
- Dominance Analysis: The agricultural segment is projected to grow at a CAGR of XX%, contributing billions to the overall market. Dynamic ROPS testing is becoming increasingly important for agricultural machinery to simulate real-world rollover scenarios encountered in varied terrain.
The Industrial segment, encompassing applications in mining, forestry, and material handling, further bolsters the ROPS market.
- Industrial:
- Key Drivers: Resource extraction activities, logging operations, and the need for robust machinery in demanding industrial environments. Specialized industrial equipment often requires custom-designed ROPS to meet unique operational challenges.
- Dominance Analysis: While smaller than construction or agriculture, the industrial segment represents a niche with high-value, custom ROPS solutions, contributing billions in specialized market segments.
Furthermore, the Type of testing significantly influences market trends:
Dynamic ROPS Testing:
- Key Drivers: Evolving safety standards and manufacturer commitment to providing superior protection. This method offers a more realistic simulation of rollover events, leading to more robust ROPS designs.
- Dominance Analysis: The demand for dynamic testing is steadily increasing as it provides a more comprehensive validation of ROPS performance, leading to higher quality products and reduced liability for manufacturers, representing a growing portion of the billions invested in ROPS certification.
Static ROPS Testing:
- Key Drivers: Cost-effectiveness and widespread acceptance as a baseline safety standard. It remains a crucial method for initial validation and compliance.
- Dominance Analysis: Static testing continues to be a fundamental requirement, especially for entry-level equipment and in markets where budget constraints are a significant factor. It forms the foundational layer of safety assurance, contributing billions to the overall compliance market.
The "Others" category encompasses niche applications, including specialized vehicles and equipment used in defense, emergency services, and material handling, adding further diversification to the market.
Rollover Protection Structure Product Developments
Recent product developments in the Rollover Protection Structure (ROPS) market are characterized by a focus on lightweight yet high-strength materials, such as advanced high-strength steel (AHSS) and composites, significantly reducing overall equipment weight and improving fuel efficiency. Innovations include modular ROPS designs that offer greater flexibility for retrofitting and customization across diverse machinery models. Enhanced energy-absorbing structures and integrated crumple zones are being engineered to provide superior operator protection during rollover events. Furthermore, smart ROPS systems are emerging, incorporating sensors to monitor structural integrity and provide real-time feedback to operators, thus maximizing safety performance. These advancements not only meet evolving regulatory requirements but also provide a competitive advantage for manufacturers through enhanced safety, durability, and user-centric designs.
Key Drivers of Rollover Protection Structure Growth
The global Rollover Protection Structure (ROPS) market is experiencing significant growth propelled by several key factors. Foremost among these is the increasing global emphasis on occupational health and safety regulations, mandating the use of protective structures on heavy machinery. This is further amplified by the growing mechanization of industries like construction and agriculture, particularly in developing economies, where the adoption of safer equipment is rapidly expanding. Technological advancements leading to lighter, stronger, and more cost-effective ROPS designs also play a crucial role, making these safety features more accessible. Finally, the rising awareness among end-users regarding the importance of operator safety is a powerful catalyst, driving demand for reliable ROPS solutions.
Challenges in the Rollover Protection Structure Market
Despite robust growth prospects, the Rollover Protection Structure (ROPS) market faces several significant challenges. Stringent and evolving regulatory compliance standards across different regions can create complexities and increase R&D costs for manufacturers. Supply chain disruptions, particularly for specialized materials and components, can impact production timelines and costs. The market also experiences intense competitive pressure from both established global players and emerging regional manufacturers, leading to pricing challenges. Furthermore, the initial cost of implementing ROPS can be a deterrent for smaller businesses or in price-sensitive markets, although the long-term safety benefits often outweigh this initial investment, representing potential lost revenue in the billions due to hesitant adoption.
Emerging Opportunities in Rollover Protection Structure
Several exciting opportunities are set to propel long-term growth in the Rollover Protection Structure (ROPS) market. Technological breakthroughs in smart materials and additive manufacturing (3D printing) offer potential for highly customized, lightweight, and cost-effective ROPS solutions. Strategic partnerships between ROPS manufacturers and original equipment manufacturers (OEMs) can lead to integrated safety designs from the outset, improving efficiency and market penetration. Expansion into emerging economies with increasing infrastructure development and evolving safety standards presents a vast untapped market. Furthermore, the development of reconfigurable and modular ROPS systems catering to diverse operational needs will open new avenues for revenue generation, with an estimated market expansion potential in the billions.
Leading Players in the Rollover Protection Structure Sector
- Clark Testing
- DLG
- Eurofins Expert Services
- LOCHMANN CABINS
- Technology Centre
- Truckline Services
- ADM
- TESTPLUS
- QMW
- ABT
- Full Vision
- TOP ROPS
Key Milestones in Rollover Protection Structure Industry
- 2019: Introduction of advanced high-strength steel (AHSS) in ROPS manufacturing, enhancing strength-to-weight ratios.
- 2020: Increased adoption of dynamic ROPS testing standards globally, pushing for more realistic safety simulations.
- 2021: Emergence of smart ROPS with integrated sensor technology for real-time structural monitoring.
- 2022: Major OEMs begin integrating modular ROPS solutions into new equipment lines.
- 2023: Significant investments in R&D for composite material applications in ROPS design.
- 2024: Growing trend of strategic M&A activities aimed at market consolidation and portfolio expansion.
Strategic Outlook for Rollover Protection Structure Market
The strategic outlook for the Rollover Protection Structure (ROPS) market is exceptionally positive, driven by a confluence of factors that will accelerate growth and innovation. Continued stringent regulatory enforcement and a global surge in infrastructure and agricultural development will solidify demand. The market will witness an increasing focus on the development of smart, connected ROPS systems that offer enhanced operator safety and predictive maintenance capabilities. Strategic collaborations between ROPS providers and equipment manufacturers will be crucial for seamless integration and market penetration. Furthermore, the exploration of new materials and manufacturing techniques, such as advanced composites and additive manufacturing, will unlock opportunities for lighter, stronger, and more cost-effective solutions, ensuring the continued expansion of this vital safety market, estimated to reach billions in the coming years.
Rollover Protection Structure Segmentation
-
1. Application
- 1.1. Construction
- 1.2. Agriculture
- 1.3. Industrial
- 1.4. Others
-
2. Type
- 2.1. Dynamic ROPS Testing
- 2.2. Static ROPS Testing
Rollover Protection Structure Segmentation By Geography
-
1. North America
- 1.1. United States
- 1.2. Canada
- 1.3. Mexico
-
2. South America
- 2.1. Brazil
- 2.2. Argentina
- 2.3. Rest of South America
-
3. Europe
- 3.1. United Kingdom
- 3.2. Germany
- 3.3. France
- 3.4. Italy
- 3.5. Spain
- 3.6. Russia
- 3.7. Benelux
- 3.8. Nordics
- 3.9. Rest of Europe
-
4. Middle East & Africa
- 4.1. Turkey
- 4.2. Israel
- 4.3. GCC
- 4.4. North Africa
- 4.5. South Africa
- 4.6. Rest of Middle East & Africa
-
5. Asia Pacific
- 5.1. China
- 5.2. India
- 5.3. Japan
- 5.4. South Korea
- 5.5. ASEAN
- 5.6. Oceania
- 5.7. Rest of Asia Pacific
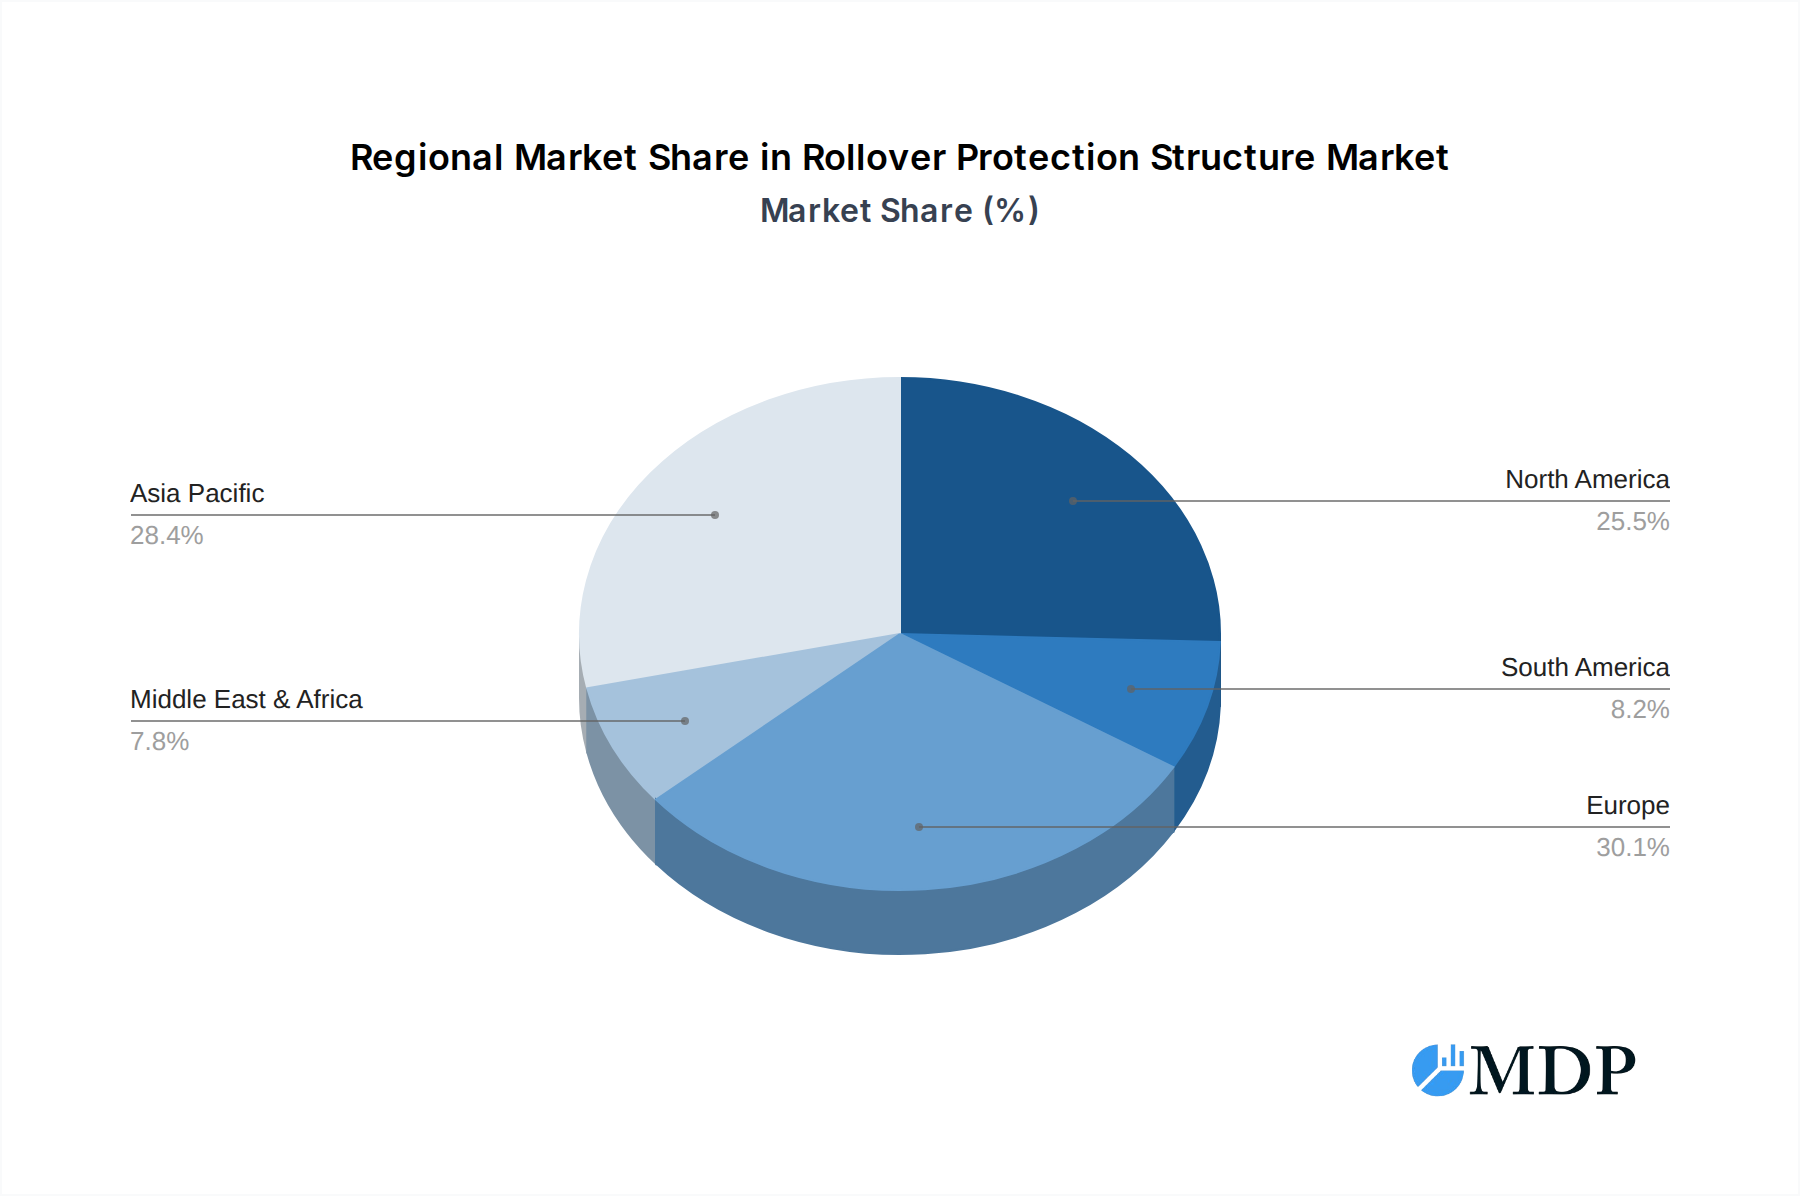
Rollover Protection Structure Regional Market Share
Geographic Coverage of Rollover Protection Structure
Rollover Protection Structure REPORT HIGHLIGHTS
| Aspects | Details |
|---|---|
| Study Period | 2020-2034 |
| Base Year | 2025 |
| Estimated Year | 2026 |
| Forecast Period | 2026-2034 |
| Historical Period | 2020-2025 |
| Growth Rate | CAGR of 8.4% from 2020-2034 |
| Segmentation |
|
Table of Contents
- 1. Introduction
- 1.1. Research Scope
- 1.2. Market Segmentation
- 1.3. Research Methodology
- 1.4. Definitions and Assumptions
- 2. Executive Summary
- 2.1. Introduction
- 3. Market Dynamics
- 3.1. Introduction
- 3.2. Market Drivers
- 3.3. Market Restrains
- 3.4. Market Trends
- 4. Market Factor Analysis
- 4.1. Porters Five Forces
- 4.2. Supply/Value Chain
- 4.3. PESTEL analysis
- 4.4. Market Entropy
- 4.5. Patent/Trademark Analysis
- 5. Global Rollover Protection Structure Analysis, Insights and Forecast, 2020-2032
- 5.1. Market Analysis, Insights and Forecast - by Application
- 5.1.1. Construction
- 5.1.2. Agriculture
- 5.1.3. Industrial
- 5.1.4. Others
- 5.2. Market Analysis, Insights and Forecast - by Type
- 5.2.1. Dynamic ROPS Testing
- 5.2.2. Static ROPS Testing
- 5.3. Market Analysis, Insights and Forecast - by Region
- 5.3.1. North America
- 5.3.2. South America
- 5.3.3. Europe
- 5.3.4. Middle East & Africa
- 5.3.5. Asia Pacific
- 5.1. Market Analysis, Insights and Forecast - by Application
- 6. North America Rollover Protection Structure Analysis, Insights and Forecast, 2020-2032
- 6.1. Market Analysis, Insights and Forecast - by Application
- 6.1.1. Construction
- 6.1.2. Agriculture
- 6.1.3. Industrial
- 6.1.4. Others
- 6.2. Market Analysis, Insights and Forecast - by Type
- 6.2.1. Dynamic ROPS Testing
- 6.2.2. Static ROPS Testing
- 6.1. Market Analysis, Insights and Forecast - by Application
- 7. South America Rollover Protection Structure Analysis, Insights and Forecast, 2020-2032
- 7.1. Market Analysis, Insights and Forecast - by Application
- 7.1.1. Construction
- 7.1.2. Agriculture
- 7.1.3. Industrial
- 7.1.4. Others
- 7.2. Market Analysis, Insights and Forecast - by Type
- 7.2.1. Dynamic ROPS Testing
- 7.2.2. Static ROPS Testing
- 7.1. Market Analysis, Insights and Forecast - by Application
- 8. Europe Rollover Protection Structure Analysis, Insights and Forecast, 2020-2032
- 8.1. Market Analysis, Insights and Forecast - by Application
- 8.1.1. Construction
- 8.1.2. Agriculture
- 8.1.3. Industrial
- 8.1.4. Others
- 8.2. Market Analysis, Insights and Forecast - by Type
- 8.2.1. Dynamic ROPS Testing
- 8.2.2. Static ROPS Testing
- 8.1. Market Analysis, Insights and Forecast - by Application
- 9. Middle East & Africa Rollover Protection Structure Analysis, Insights and Forecast, 2020-2032
- 9.1. Market Analysis, Insights and Forecast - by Application
- 9.1.1. Construction
- 9.1.2. Agriculture
- 9.1.3. Industrial
- 9.1.4. Others
- 9.2. Market Analysis, Insights and Forecast - by Type
- 9.2.1. Dynamic ROPS Testing
- 9.2.2. Static ROPS Testing
- 9.1. Market Analysis, Insights and Forecast - by Application
- 10. Asia Pacific Rollover Protection Structure Analysis, Insights and Forecast, 2020-2032
- 10.1. Market Analysis, Insights and Forecast - by Application
- 10.1.1. Construction
- 10.1.2. Agriculture
- 10.1.3. Industrial
- 10.1.4. Others
- 10.2. Market Analysis, Insights and Forecast - by Type
- 10.2.1. Dynamic ROPS Testing
- 10.2.2. Static ROPS Testing
- 10.1. Market Analysis, Insights and Forecast - by Application
- 11. Competitive Analysis
- 11.1. Global Market Share Analysis 2025
- 11.2. Company Profiles
- 11.2.1 Clark Testing
- 11.2.1.1. Overview
- 11.2.1.2. Products
- 11.2.1.3. SWOT Analysis
- 11.2.1.4. Recent Developments
- 11.2.1.5. Financials (Based on Availability)
- 11.2.2 DLG
- 11.2.2.1. Overview
- 11.2.2.2. Products
- 11.2.2.3. SWOT Analysis
- 11.2.2.4. Recent Developments
- 11.2.2.5. Financials (Based on Availability)
- 11.2.3 Eurofins Expert Services
- 11.2.3.1. Overview
- 11.2.3.2. Products
- 11.2.3.3. SWOT Analysis
- 11.2.3.4. Recent Developments
- 11.2.3.5. Financials (Based on Availability)
- 11.2.4 LOCHMANN CABINS
- 11.2.4.1. Overview
- 11.2.4.2. Products
- 11.2.4.3. SWOT Analysis
- 11.2.4.4. Recent Developments
- 11.2.4.5. Financials (Based on Availability)
- 11.2.5 Technology Centre
- 11.2.5.1. Overview
- 11.2.5.2. Products
- 11.2.5.3. SWOT Analysis
- 11.2.5.4. Recent Developments
- 11.2.5.5. Financials (Based on Availability)
- 11.2.6 Truckline Services
- 11.2.6.1. Overview
- 11.2.6.2. Products
- 11.2.6.3. SWOT Analysis
- 11.2.6.4. Recent Developments
- 11.2.6.5. Financials (Based on Availability)
- 11.2.7 ADM
- 11.2.7.1. Overview
- 11.2.7.2. Products
- 11.2.7.3. SWOT Analysis
- 11.2.7.4. Recent Developments
- 11.2.7.5. Financials (Based on Availability)
- 11.2.8 TESTPLUS
- 11.2.8.1. Overview
- 11.2.8.2. Products
- 11.2.8.3. SWOT Analysis
- 11.2.8.4. Recent Developments
- 11.2.8.5. Financials (Based on Availability)
- 11.2.9 QMW
- 11.2.9.1. Overview
- 11.2.9.2. Products
- 11.2.9.3. SWOT Analysis
- 11.2.9.4. Recent Developments
- 11.2.9.5. Financials (Based on Availability)
- 11.2.10 ABT
- 11.2.10.1. Overview
- 11.2.10.2. Products
- 11.2.10.3. SWOT Analysis
- 11.2.10.4. Recent Developments
- 11.2.10.5. Financials (Based on Availability)
- 11.2.11 Full Vision
- 11.2.11.1. Overview
- 11.2.11.2. Products
- 11.2.11.3. SWOT Analysis
- 11.2.11.4. Recent Developments
- 11.2.11.5. Financials (Based on Availability)
- 11.2.12 TOP ROPS
- 11.2.12.1. Overview
- 11.2.12.2. Products
- 11.2.12.3. SWOT Analysis
- 11.2.12.4. Recent Developments
- 11.2.12.5. Financials (Based on Availability)
- 11.2.1 Clark Testing
List of Figures
- Figure 1: Global Rollover Protection Structure Revenue Breakdown (billion, %) by Region 2025 & 2033
- Figure 2: North America Rollover Protection Structure Revenue (billion), by Application 2025 & 2033
- Figure 3: North America Rollover Protection Structure Revenue Share (%), by Application 2025 & 2033
- Figure 4: North America Rollover Protection Structure Revenue (billion), by Type 2025 & 2033
- Figure 5: North America Rollover Protection Structure Revenue Share (%), by Type 2025 & 2033
- Figure 6: North America Rollover Protection Structure Revenue (billion), by Country 2025 & 2033
- Figure 7: North America Rollover Protection Structure Revenue Share (%), by Country 2025 & 2033
- Figure 8: South America Rollover Protection Structure Revenue (billion), by Application 2025 & 2033
- Figure 9: South America Rollover Protection Structure Revenue Share (%), by Application 2025 & 2033
- Figure 10: South America Rollover Protection Structure Revenue (billion), by Type 2025 & 2033
- Figure 11: South America Rollover Protection Structure Revenue Share (%), by Type 2025 & 2033
- Figure 12: South America Rollover Protection Structure Revenue (billion), by Country 2025 & 2033
- Figure 13: South America Rollover Protection Structure Revenue Share (%), by Country 2025 & 2033
- Figure 14: Europe Rollover Protection Structure Revenue (billion), by Application 2025 & 2033
- Figure 15: Europe Rollover Protection Structure Revenue Share (%), by Application 2025 & 2033
- Figure 16: Europe Rollover Protection Structure Revenue (billion), by Type 2025 & 2033
- Figure 17: Europe Rollover Protection Structure Revenue Share (%), by Type 2025 & 2033
- Figure 18: Europe Rollover Protection Structure Revenue (billion), by Country 2025 & 2033
- Figure 19: Europe Rollover Protection Structure Revenue Share (%), by Country 2025 & 2033
- Figure 20: Middle East & Africa Rollover Protection Structure Revenue (billion), by Application 2025 & 2033
- Figure 21: Middle East & Africa Rollover Protection Structure Revenue Share (%), by Application 2025 & 2033
- Figure 22: Middle East & Africa Rollover Protection Structure Revenue (billion), by Type 2025 & 2033
- Figure 23: Middle East & Africa Rollover Protection Structure Revenue Share (%), by Type 2025 & 2033
- Figure 24: Middle East & Africa Rollover Protection Structure Revenue (billion), by Country 2025 & 2033
- Figure 25: Middle East & Africa Rollover Protection Structure Revenue Share (%), by Country 2025 & 2033
- Figure 26: Asia Pacific Rollover Protection Structure Revenue (billion), by Application 2025 & 2033
- Figure 27: Asia Pacific Rollover Protection Structure Revenue Share (%), by Application 2025 & 2033
- Figure 28: Asia Pacific Rollover Protection Structure Revenue (billion), by Type 2025 & 2033
- Figure 29: Asia Pacific Rollover Protection Structure Revenue Share (%), by Type 2025 & 2033
- Figure 30: Asia Pacific Rollover Protection Structure Revenue (billion), by Country 2025 & 2033
- Figure 31: Asia Pacific Rollover Protection Structure Revenue Share (%), by Country 2025 & 2033
List of Tables
- Table 1: Global Rollover Protection Structure Revenue billion Forecast, by Application 2020 & 2033
- Table 2: Global Rollover Protection Structure Revenue billion Forecast, by Type 2020 & 2033
- Table 3: Global Rollover Protection Structure Revenue billion Forecast, by Region 2020 & 2033
- Table 4: Global Rollover Protection Structure Revenue billion Forecast, by Application 2020 & 2033
- Table 5: Global Rollover Protection Structure Revenue billion Forecast, by Type 2020 & 2033
- Table 6: Global Rollover Protection Structure Revenue billion Forecast, by Country 2020 & 2033
- Table 7: United States Rollover Protection Structure Revenue (billion) Forecast, by Application 2020 & 2033
- Table 8: Canada Rollover Protection Structure Revenue (billion) Forecast, by Application 2020 & 2033
- Table 9: Mexico Rollover Protection Structure Revenue (billion) Forecast, by Application 2020 & 2033
- Table 10: Global Rollover Protection Structure Revenue billion Forecast, by Application 2020 & 2033
- Table 11: Global Rollover Protection Structure Revenue billion Forecast, by Type 2020 & 2033
- Table 12: Global Rollover Protection Structure Revenue billion Forecast, by Country 2020 & 2033
- Table 13: Brazil Rollover Protection Structure Revenue (billion) Forecast, by Application 2020 & 2033
- Table 14: Argentina Rollover Protection Structure Revenue (billion) Forecast, by Application 2020 & 2033
- Table 15: Rest of South America Rollover Protection Structure Revenue (billion) Forecast, by Application 2020 & 2033
- Table 16: Global Rollover Protection Structure Revenue billion Forecast, by Application 2020 & 2033
- Table 17: Global Rollover Protection Structure Revenue billion Forecast, by Type 2020 & 2033
- Table 18: Global Rollover Protection Structure Revenue billion Forecast, by Country 2020 & 2033
- Table 19: United Kingdom Rollover Protection Structure Revenue (billion) Forecast, by Application 2020 & 2033
- Table 20: Germany Rollover Protection Structure Revenue (billion) Forecast, by Application 2020 & 2033
- Table 21: France Rollover Protection Structure Revenue (billion) Forecast, by Application 2020 & 2033
- Table 22: Italy Rollover Protection Structure Revenue (billion) Forecast, by Application 2020 & 2033
- Table 23: Spain Rollover Protection Structure Revenue (billion) Forecast, by Application 2020 & 2033
- Table 24: Russia Rollover Protection Structure Revenue (billion) Forecast, by Application 2020 & 2033
- Table 25: Benelux Rollover Protection Structure Revenue (billion) Forecast, by Application 2020 & 2033
- Table 26: Nordics Rollover Protection Structure Revenue (billion) Forecast, by Application 2020 & 2033
- Table 27: Rest of Europe Rollover Protection Structure Revenue (billion) Forecast, by Application 2020 & 2033
- Table 28: Global Rollover Protection Structure Revenue billion Forecast, by Application 2020 & 2033
- Table 29: Global Rollover Protection Structure Revenue billion Forecast, by Type 2020 & 2033
- Table 30: Global Rollover Protection Structure Revenue billion Forecast, by Country 2020 & 2033
- Table 31: Turkey Rollover Protection Structure Revenue (billion) Forecast, by Application 2020 & 2033
- Table 32: Israel Rollover Protection Structure Revenue (billion) Forecast, by Application 2020 & 2033
- Table 33: GCC Rollover Protection Structure Revenue (billion) Forecast, by Application 2020 & 2033
- Table 34: North Africa Rollover Protection Structure Revenue (billion) Forecast, by Application 2020 & 2033
- Table 35: South Africa Rollover Protection Structure Revenue (billion) Forecast, by Application 2020 & 2033
- Table 36: Rest of Middle East & Africa Rollover Protection Structure Revenue (billion) Forecast, by Application 2020 & 2033
- Table 37: Global Rollover Protection Structure Revenue billion Forecast, by Application 2020 & 2033
- Table 38: Global Rollover Protection Structure Revenue billion Forecast, by Type 2020 & 2033
- Table 39: Global Rollover Protection Structure Revenue billion Forecast, by Country 2020 & 2033
- Table 40: China Rollover Protection Structure Revenue (billion) Forecast, by Application 2020 & 2033
- Table 41: India Rollover Protection Structure Revenue (billion) Forecast, by Application 2020 & 2033
- Table 42: Japan Rollover Protection Structure Revenue (billion) Forecast, by Application 2020 & 2033
- Table 43: South Korea Rollover Protection Structure Revenue (billion) Forecast, by Application 2020 & 2033
- Table 44: ASEAN Rollover Protection Structure Revenue (billion) Forecast, by Application 2020 & 2033
- Table 45: Oceania Rollover Protection Structure Revenue (billion) Forecast, by Application 2020 & 2033
- Table 46: Rest of Asia Pacific Rollover Protection Structure Revenue (billion) Forecast, by Application 2020 & 2033
Frequently Asked Questions
1. What is the projected Compound Annual Growth Rate (CAGR) of the Rollover Protection Structure?
The projected CAGR is approximately 8.4%.
2. Which companies are prominent players in the Rollover Protection Structure?
Key companies in the market include Clark Testing, DLG, Eurofins Expert Services, LOCHMANN CABINS, Technology Centre, Truckline Services, ADM, TESTPLUS, QMW, ABT, Full Vision, TOP ROPS.
3. What are the main segments of the Rollover Protection Structure?
The market segments include Application, Type.
4. Can you provide details about the market size?
The market size is estimated to be USD 6.84 billion as of 2022.
5. What are some drivers contributing to market growth?
N/A
6. What are the notable trends driving market growth?
N/A
7. Are there any restraints impacting market growth?
N/A
8. Can you provide examples of recent developments in the market?
N/A
9. What pricing options are available for accessing the report?
Pricing options include single-user, multi-user, and enterprise licenses priced at USD 4250.00, USD 6375.00, and USD 8500.00 respectively.
10. Is the market size provided in terms of value or volume?
The market size is provided in terms of value, measured in billion.
11. Are there any specific market keywords associated with the report?
Yes, the market keyword associated with the report is "Rollover Protection Structure," which aids in identifying and referencing the specific market segment covered.
12. How do I determine which pricing option suits my needs best?
The pricing options vary based on user requirements and access needs. Individual users may opt for single-user licenses, while businesses requiring broader access may choose multi-user or enterprise licenses for cost-effective access to the report.
13. Are there any additional resources or data provided in the Rollover Protection Structure report?
While the report offers comprehensive insights, it's advisable to review the specific contents or supplementary materials provided to ascertain if additional resources or data are available.
14. How can I stay updated on further developments or reports in the Rollover Protection Structure?
To stay informed about further developments, trends, and reports in the Rollover Protection Structure, consider subscribing to industry newsletters, following relevant companies and organizations, or regularly checking reputable industry news sources and publications.
Methodology
Step 1 - Identification of Relevant Samples Size from Population Database


Step 2 - Approaches for Defining Global Market Size (Value, Volume* & Price*)

Note*: In applicable scenarios
Step 3 - Data Sources
Primary Research
- Web Analytics
- Survey Reports
- Research Institute
- Latest Research Reports
- Opinion Leaders
Secondary Research
- Annual Reports
- White Paper
- Latest Press Release
- Industry Association
- Paid Database
- Investor Presentations

Step 4 - Data Triangulation
Involves using different sources of information in order to increase the validity of a study
These sources are likely to be stakeholders in a program - participants, other researchers, program staff, other community members, and so on.
Then we put all data in single framework & apply various statistical tools to find out the dynamic on the market.
During the analysis stage, feedback from the stakeholder groups would be compared to determine areas of agreement as well as areas of divergence