

Key Insights
The global Performance Tires market is poised for significant expansion, projected to reach an estimated $43.39 billion in 2025, demonstrating a robust compound annual growth rate (CAGR) of 3.04% throughout the forecast period of 2025-2033. This growth is propelled by an increasing demand for enhanced vehicle safety, superior handling capabilities, and improved fuel efficiency across both commercial and passenger vehicle segments. The burgeoning automotive industry, coupled with a rising trend in vehicle customization and the pursuit of a premium driving experience, are key drivers. Technological advancements in tire composition, tread design, and material science are continuously innovating the performance tire landscape, enabling manufacturers to meet the evolving needs of discerning consumers. Furthermore, stricter regulations surrounding tire performance and safety standards are indirectly fostering market growth by encouraging the adoption of high-performance alternatives.
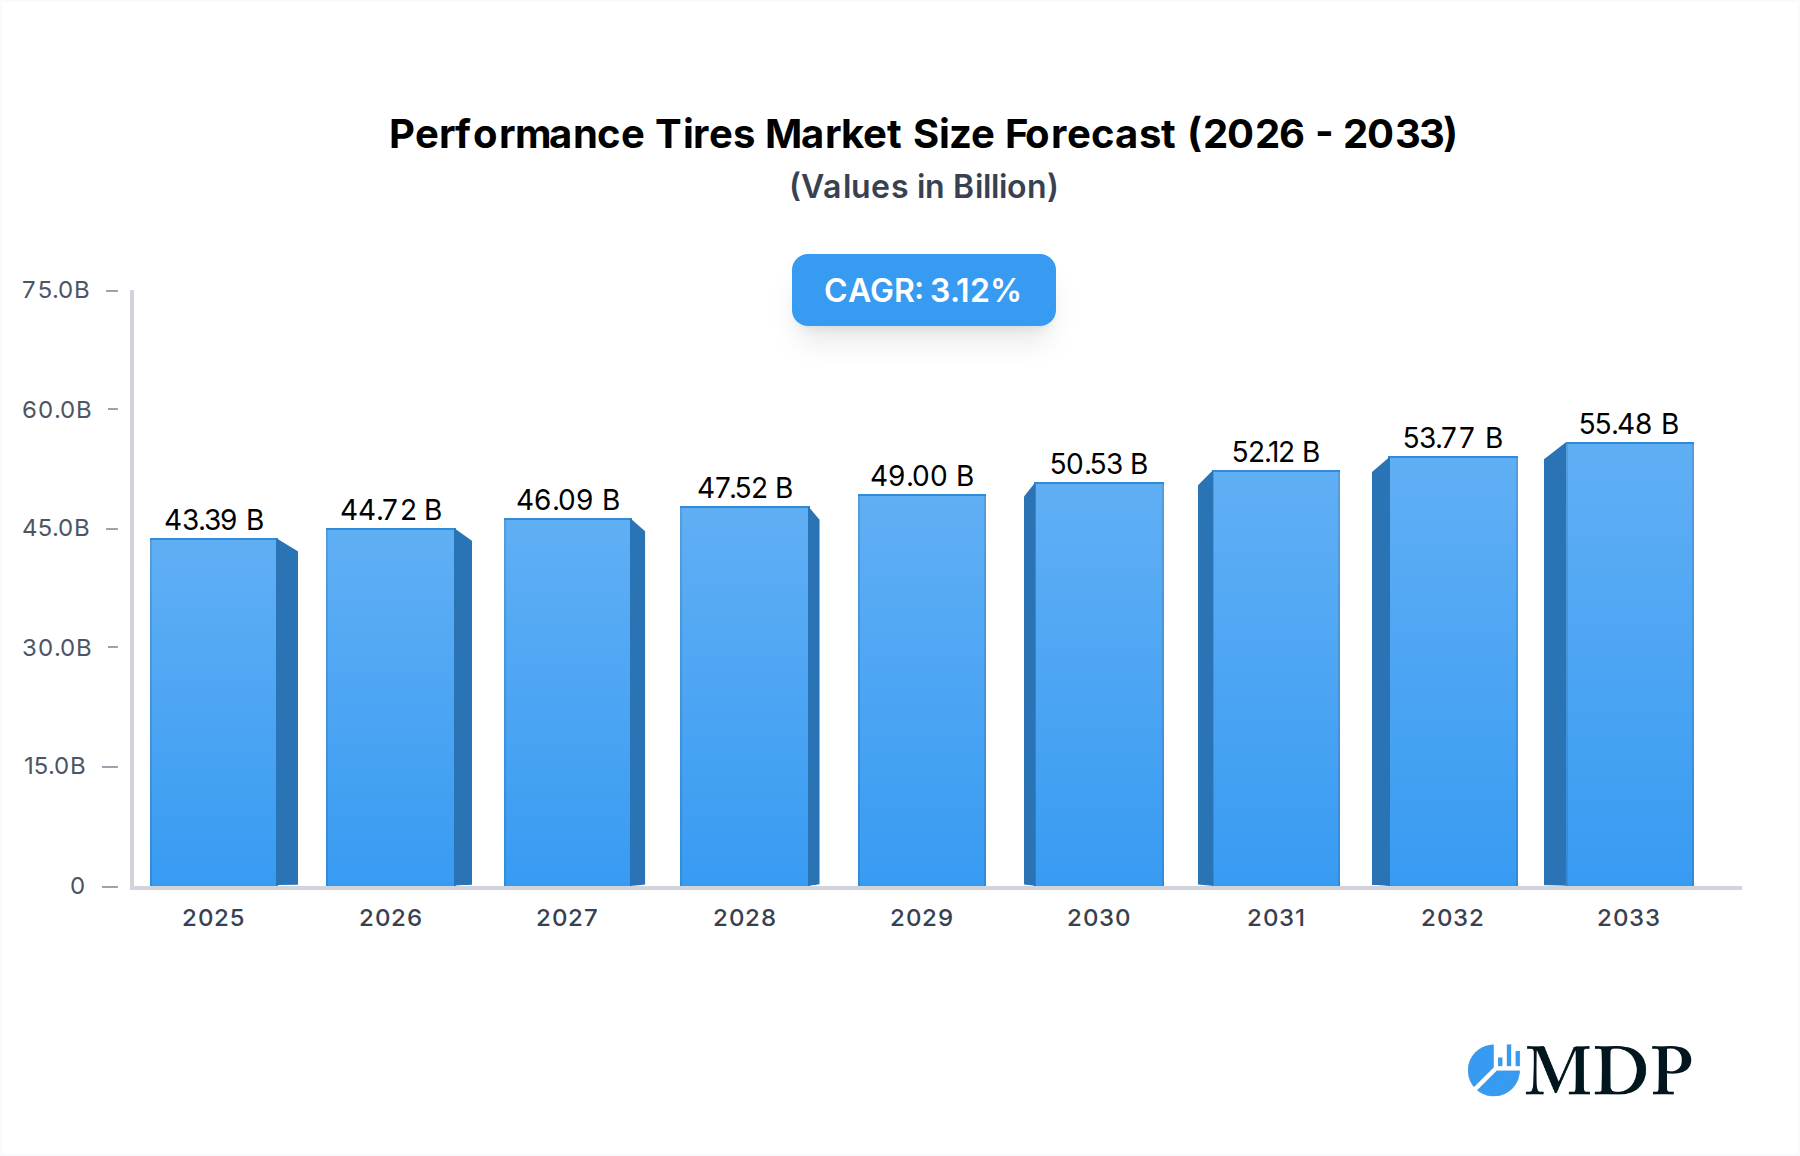
Performance Tires Market Size (In Billion)
The market's upward trajectory is further supported by the increasing adoption of performance tires in high-performance and luxury vehicle segments, alongside a growing awareness among consumers about the benefits of specialized tires. Despite its strong growth prospects, the market faces certain restraints, including the higher cost associated with performance tires compared to standard variants, which can limit widespread adoption in price-sensitive segments. Additionally, fluctuating raw material prices and the ongoing development of alternative mobility solutions like electric vehicles, which may have different tire requirements, present potential challenges. However, the overarching trend towards improved driving dynamics and safety, coupled with the continuous innovation from leading companies such as Bridgestone, Michelin, Goodyear, and Continental, is expected to drive sustained market expansion. The market is segmented by application into Commercial Vehicle and Passenger Vehicle, and by type into Inner Tire and Outer Tire, catering to diverse automotive needs.

Performance Tires Company Market Share
Performance Tires Market Research Report: Comprehensive Analysis and Future Outlook (2019–2033)
This in-depth report provides a definitive analysis of the global Performance Tires market, offering critical insights for industry stakeholders. Covering a study period from 2019 to 2033, with a base year of 2025 and a forecast period extending to 2033, this research examines historical trends, current market dynamics, and future projections. The report meticulously details market concentration, innovation drivers, regulatory frameworks, product substitutes, end-user trends, and M&A activities. It delves into industry trends, growth drivers, technological disruptions, consumer preferences, and competitive landscapes, highlighting leading markets and segments within Commercial Vehicle and Passenger Vehicle applications, and Inner Tire and Outer Tire types. Furthermore, the report explores product developments, key growth drivers, challenges, emerging opportunities, leading players, key milestones, and a strategic outlook for the Performance Tires sector. With an estimated market value of over a billion and projected CAGR, this report is an indispensable resource for strategic planning and investment decisions.
Performance Tires Market Dynamics & Concentration
The global Performance Tires market exhibits a dynamic concentration, characterized by significant innovation and evolving regulatory landscapes. Key innovation drivers include advancements in rubber compounds, tread patterns, and sustainable material integration, pushing the boundaries of tire performance for both commercial vehicle and passenger vehicle applications. Regulatory frameworks, such as emissions standards and tire labeling regulations in major markets, are increasingly influencing product development and market entry strategies. Product substitutes, while limited in direct performance equivalence, include retreaded tires and budget-friendly alternatives, posing a moderate competitive pressure. End-user trends point towards a growing demand for enhanced fuel efficiency, extended tread life, and superior handling and braking capabilities across both commercial and passenger vehicle segments. Mergers and acquisitions (M&A) activities, with an estimated count of over XX billion deals annually during the historical period, reflect strategic consolidations aimed at market share expansion and technology acquisition. Key players like Michelin, Bridgestone, and Goodyear Tires have been instrumental in shaping market concentration through significant R&D investments and strategic acquisitions. The market share distribution among top players indicates a moderate to high concentration, with a few dominant entities holding substantial portions of the global market.
Performance Tires Industry Trends & Analysis
The Performance Tires industry is experiencing robust growth, projected to achieve a Compound Annual Growth Rate (CAGR) of over XX% in the coming years. This expansion is fueled by several interconnected trends. A primary growth driver is the increasing global vehicle parc, particularly in emerging economies, which directly translates to higher demand for replacement tires. Technological advancements are revolutionizing tire design and manufacturing. Innovations in smart tires, incorporating embedded sensors for real-time monitoring of pressure, temperature, and wear, are gaining traction, offering enhanced safety and predictive maintenance capabilities for both commercial vehicle and passenger vehicle fleets. The development of eco-friendly and sustainable tire materials, such as those derived from recycled rubber and bio-based compounds, is another significant trend driven by increasing environmental consciousness and stringent regulations. Consumer preferences are shifting towards tires that offer a superior driving experience, characterized by improved grip, reduced rolling resistance for better fuel economy, and enhanced durability. This is particularly evident in the passenger vehicle segment, where performance-oriented tires are increasingly sought after. Competitive dynamics are intensifying, with established global players like Bridgestone, Michelin, and Goodyear Tires investing heavily in R&D to maintain their market leadership, while emerging players, particularly from Asia, are challenging the status quo with cost-effective and technologically advanced offerings. The market penetration of specialized performance tires is steadily increasing as vehicle manufacturers integrate them as original equipment (OE) for high-performance models. The increasing adoption of electric vehicles (EVs) also presents a unique trend, as EVs require tires with specific characteristics like low rolling resistance and superior torque handling capabilities, creating a new niche for performance tire manufacturers. The market for Inner Tires and Outer Tires, while distinct, are both influenced by these overarching industry trends, with continuous innovation focused on improving their individual performance attributes and lifespan.
Leading Markets & Segments in Performance Tires
The global Performance Tires market's dominance is multifaceted, with distinct regional and segmental leadership. North America currently stands as a leading market, driven by a mature automotive industry, a high disposable income leading to demand for premium passenger vehicles, and a substantial commercial vehicle fleet for logistics and transportation. The United States within North America, in particular, exhibits strong demand for performance tires across both Passenger Vehicle and Commercial Vehicle applications. Key drivers of this dominance include robust economic policies that support transportation and logistics infrastructure, coupled with consumer preferences for vehicles offering superior performance and safety. Furthermore, the stringent safety regulations and mandated tire standards in the US compel manufacturers to produce and market high-performance tires.
Within the Application segmentation, the Passenger Vehicle segment holds a significant share, fueled by the growing trend of vehicle personalization and the increasing ownership of high-performance and luxury vehicles. Consumers are willing to invest in tires that enhance driving dynamics, reduce braking distances, and provide a quieter, more comfortable ride. The Commercial Vehicle segment, while perhaps smaller in terms of unit volume for specialized performance tires, represents a substantial market value due to the sheer operational scale and the critical importance of tire longevity, fuel efficiency, and safety for profitability. Fleet operators are increasingly recognizing the total cost of ownership benefits derived from high-performance tires.
Considering the Types, the Outer Tire segment overwhelmingly dominates the market. This is primarily due to its direct interaction with the road surface, dictating crucial performance aspects like grip, handling, and wear. Innovations in tread compounds, sidewall construction, and aerodynamic profiles are almost exclusively focused on the outer tire. The Inner Tire segment, while less visible, plays a crucial role in maintaining tire integrity and pressure, especially in heavy-duty commercial applications. However, its market share in the context of performance-defining attributes is considerably smaller compared to the outer tire. The growth in electric vehicles also necessitates advanced outer tire designs to manage increased torque and weight, further solidifying the outer tire's lead.
Performance Tires Product Developments
Product innovation in the Performance Tires sector is primarily centered on enhancing grip, durability, and fuel efficiency. Advancements in silica-based compounds and advanced polymer technologies are leading to tires with superior wet and dry traction, reduced rolling resistance for improved mileage, and extended tread life. For the commercial vehicle segment, developments focus on robust construction to withstand heavy loads and harsh operating conditions, while passenger vehicle tires see innovations in noise reduction and ride comfort. Competitive advantages are being gained through the integration of smart tire technology, enabling real-time monitoring of tire health and performance, and the increasing use of sustainable materials to meet evolving environmental regulations and consumer demand for eco-friendly products.
Key Drivers of Performance Tires Growth
The growth of the Performance Tires market is propelled by a confluence of technological, economic, and regulatory factors. Technologically, continuous innovation in rubber compounds, tread design, and manufacturing processes leads to tires with superior performance characteristics, such as enhanced grip, reduced rolling resistance, and increased durability. Economically, rising global disposable incomes and the increasing demand for premium and performance-oriented vehicles, especially in emerging markets, directly correlate with higher sales of performance tires. Furthermore, the expansion of global logistics and transportation networks fuels the demand for high-performance commercial vehicle tires that offer improved fuel efficiency and longer service life. Regulatory frameworks, such as stringent safety standards and environmental regulations mandating lower emissions and improved fuel economy, also act as significant growth accelerators, pushing manufacturers to develop and market tires that meet these demanding criteria.
Challenges in the Performance Tires Market
Despite robust growth, the Performance Tires market faces several significant challenges. Regulatory hurdles, including varying international standards for tire safety and environmental impact, can complicate global market entry and necessitate costly product modifications. Supply chain issues, exacerbated by geopolitical events and raw material price volatility, can impact production costs and lead times, affecting profitability and market responsiveness. Intense competitive pressures from both established global brands and emerging players, particularly those offering lower-priced alternatives, create a constant need for innovation and cost management. Additionally, the high research and development costs associated with advanced tire technologies can be a barrier for smaller manufacturers.
Emerging Opportunities in Performance Tires
The Performance Tires market is ripe with emerging opportunities driven by technological breakthroughs and strategic market expansions. The rapid growth of the electric vehicle (EV) sector presents a significant opportunity, as EVs require specialized tires that can handle higher torque, heavier weight, and offer exceptionally low rolling resistance for extended battery range. Strategic partnerships between tire manufacturers and EV OEMs are becoming crucial for developing tailored tire solutions. Furthermore, advancements in sustainable materials science are opening avenues for the development of high-performance tires made from recycled and bio-based compounds, catering to growing environmental consciousness. Market expansion into developing economies, coupled with tailored product offerings that balance performance and affordability, also represents a substantial growth catalyst.
Leading Players in the Performance Tires Sector
- Bridgestone
- Toyo Tire
- Goodyear Tires
- Dunlop Tires
- Kal Tire
- Continental
- Hankook
- Nizhnekamskshina
- Nokian Tyres
- Cooper Tire
- Michelin
Key Milestones in Performance Tires Industry
- 2019: Introduction of advanced silica tread compounds leading to significant improvements in wet grip and fuel efficiency.
- 2020: Increased focus on sustainable materials and the launch of tires with a higher percentage of recycled content.
- 2021: Development of smart tire technology with embedded sensors for real-time performance monitoring gains traction.
- 2022: Stringent emission standards implemented in key regions drive demand for low-rolling-resistance performance tires.
- 2023: Major acquisitions and mergers among key players to consolidate market share and enhance technological capabilities.
- 2024: Growing adoption of performance tires as original equipment in electric vehicles due to specific performance requirements.
Strategic Outlook for Performance Tires Market
The strategic outlook for the Performance Tires market is highly promising, with continued growth anticipated. The increasing adoption of electric vehicles will necessitate the development of specialized high-performance tires, presenting a significant opportunity for innovation and market penetration. Furthermore, the growing global emphasis on sustainability will drive demand for eco-friendly performance tires, encouraging investment in research and development of advanced materials. Strategic partnerships between tire manufacturers, vehicle OEMs, and technology providers will be crucial for co-developing cutting-edge solutions. Expansion into emerging economies, coupled with a focus on localized product offerings, will also accelerate market growth. The overall market trajectory indicates a sustained upward trend driven by technological advancements, evolving consumer preferences, and supportive regulatory environments.
Performance Tires Segmentation
-
1. Application
- 1.1. Commercial Vehicle
- 1.2. Passenger Vehicle
-
2. Types
- 2.1. Inner Tire
- 2.2. Outer Tire
- 2.3. \
- 2.4. \
Performance Tires Segmentation By Geography
-
1. North America
- 1.1. United States
- 1.2. Canada
- 1.3. Mexico
-
2. South America
- 2.1. Brazil
- 2.2. Argentina
- 2.3. Rest of South America
-
3. Europe
- 3.1. United Kingdom
- 3.2. Germany
- 3.3. France
- 3.4. Italy
- 3.5. Spain
- 3.6. Russia
- 3.7. Benelux
- 3.8. Nordics
- 3.9. Rest of Europe
-
4. Middle East & Africa
- 4.1. Turkey
- 4.2. Israel
- 4.3. GCC
- 4.4. North Africa
- 4.5. South Africa
- 4.6. Rest of Middle East & Africa
-
5. Asia Pacific
- 5.1. China
- 5.2. India
- 5.3. Japan
- 5.4. South Korea
- 5.5. ASEAN
- 5.6. Oceania
- 5.7. Rest of Asia Pacific
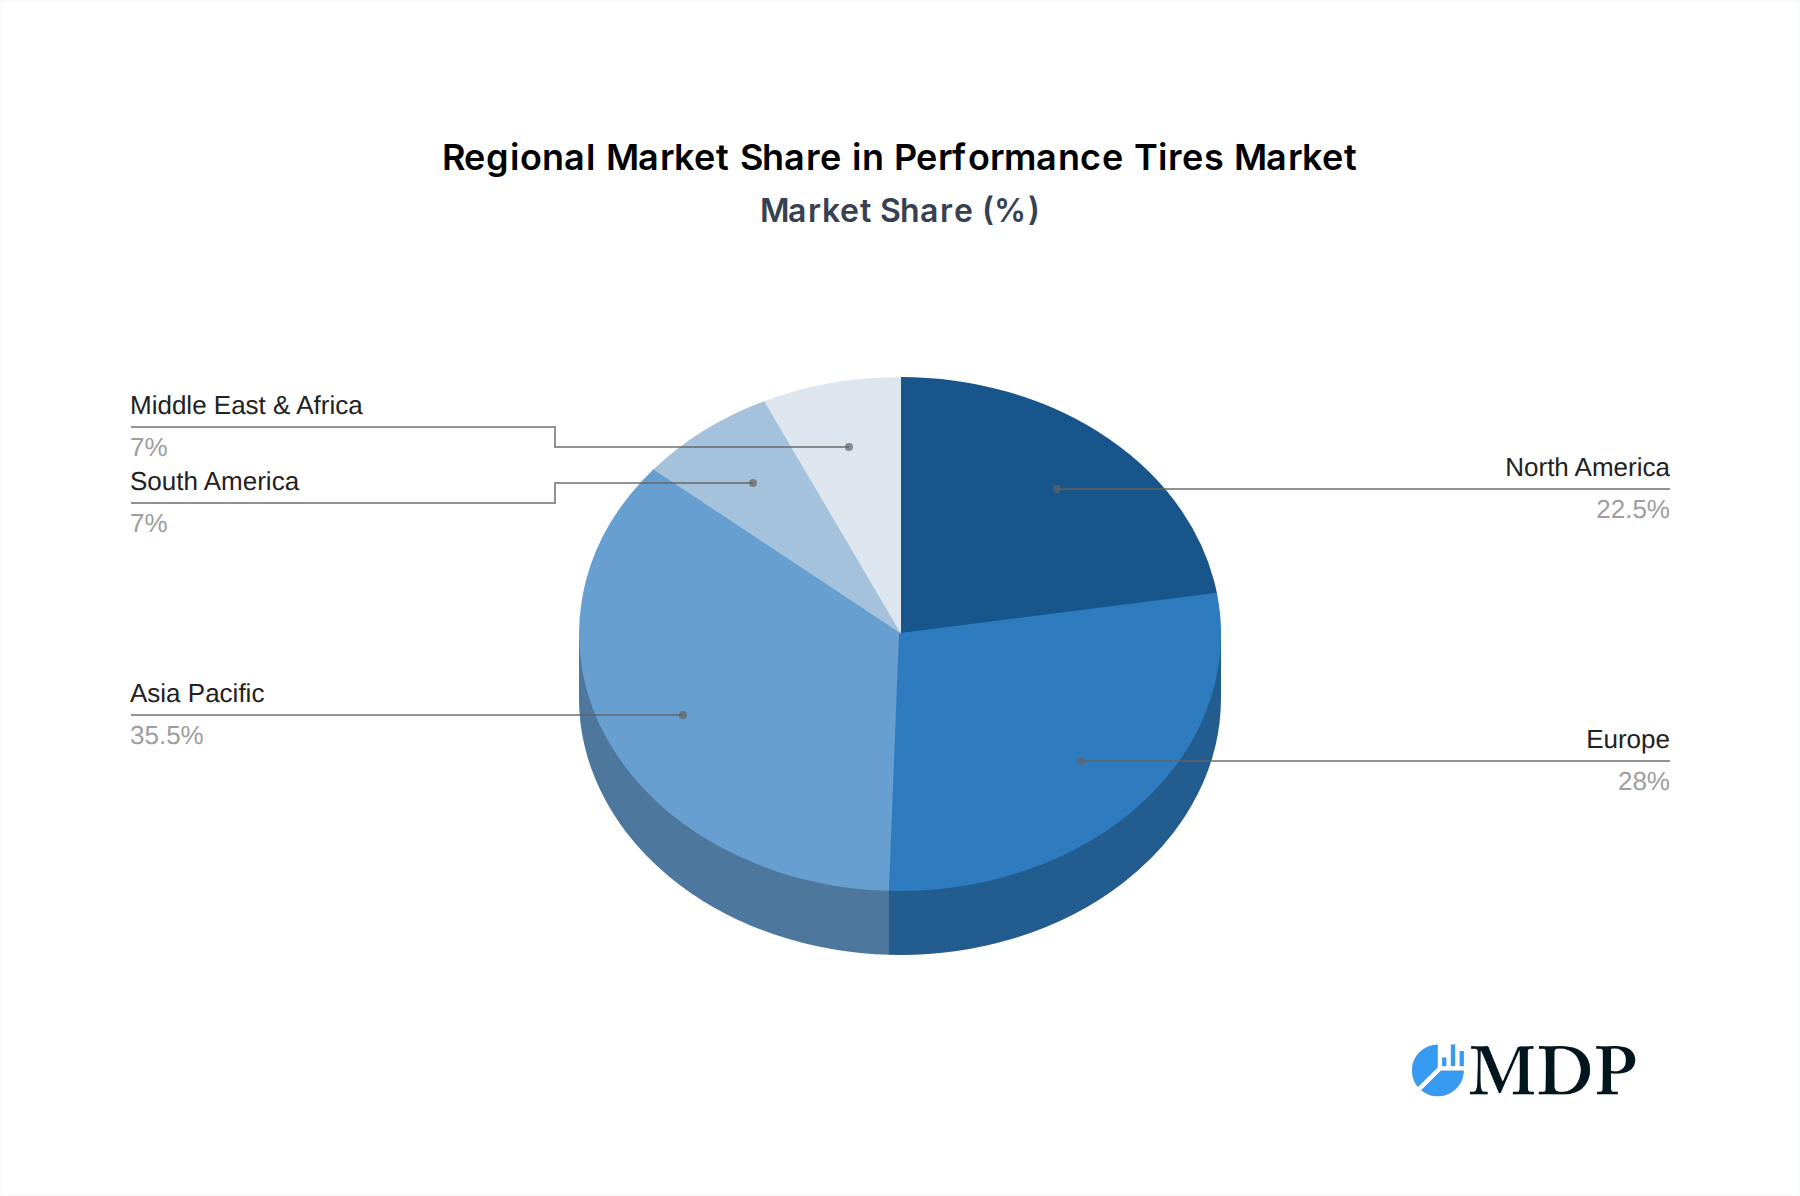
Performance Tires Regional Market Share
Geographic Coverage of Performance Tires
Performance Tires REPORT HIGHLIGHTS
| Aspects | Details |
|---|---|
| Study Period | 2020-2034 |
| Base Year | 2025 |
| Estimated Year | 2026 |
| Forecast Period | 2026-2034 |
| Historical Period | 2020-2025 |
| Growth Rate | CAGR of 3.04% from 2020-2034 |
| Segmentation |
|
Table of Contents
- 1. Introduction
- 1.1. Research Scope
- 1.2. Market Segmentation
- 1.3. Research Methodology
- 1.4. Definitions and Assumptions
- 2. Executive Summary
- 2.1. Introduction
- 3. Market Dynamics
- 3.1. Introduction
- 3.2. Market Drivers
- 3.3. Market Restrains
- 3.4. Market Trends
- 4. Market Factor Analysis
- 4.1. Porters Five Forces
- 4.2. Supply/Value Chain
- 4.3. PESTEL analysis
- 4.4. Market Entropy
- 4.5. Patent/Trademark Analysis
- 5. Global Performance Tires Analysis, Insights and Forecast, 2020-2032
- 5.1. Market Analysis, Insights and Forecast - by Application
- 5.1.1. Commercial Vehicle
- 5.1.2. Passenger Vehicle
- 5.2. Market Analysis, Insights and Forecast - by Types
- 5.2.1. Inner Tire
- 5.2.2. Outer Tire
- 5.2.3. \
- 5.2.4. \
- 5.3. Market Analysis, Insights and Forecast - by Region
- 5.3.1. North America
- 5.3.2. South America
- 5.3.3. Europe
- 5.3.4. Middle East & Africa
- 5.3.5. Asia Pacific
- 5.1. Market Analysis, Insights and Forecast - by Application
- 6. North America Performance Tires Analysis, Insights and Forecast, 2020-2032
- 6.1. Market Analysis, Insights and Forecast - by Application
- 6.1.1. Commercial Vehicle
- 6.1.2. Passenger Vehicle
- 6.2. Market Analysis, Insights and Forecast - by Types
- 6.2.1. Inner Tire
- 6.2.2. Outer Tire
- 6.2.3. \
- 6.2.4. \
- 6.1. Market Analysis, Insights and Forecast - by Application
- 7. South America Performance Tires Analysis, Insights and Forecast, 2020-2032
- 7.1. Market Analysis, Insights and Forecast - by Application
- 7.1.1. Commercial Vehicle
- 7.1.2. Passenger Vehicle
- 7.2. Market Analysis, Insights and Forecast - by Types
- 7.2.1. Inner Tire
- 7.2.2. Outer Tire
- 7.2.3. \
- 7.2.4. \
- 7.1. Market Analysis, Insights and Forecast - by Application
- 8. Europe Performance Tires Analysis, Insights and Forecast, 2020-2032
- 8.1. Market Analysis, Insights and Forecast - by Application
- 8.1.1. Commercial Vehicle
- 8.1.2. Passenger Vehicle
- 8.2. Market Analysis, Insights and Forecast - by Types
- 8.2.1. Inner Tire
- 8.2.2. Outer Tire
- 8.2.3. \
- 8.2.4. \
- 8.1. Market Analysis, Insights and Forecast - by Application
- 9. Middle East & Africa Performance Tires Analysis, Insights and Forecast, 2020-2032
- 9.1. Market Analysis, Insights and Forecast - by Application
- 9.1.1. Commercial Vehicle
- 9.1.2. Passenger Vehicle
- 9.2. Market Analysis, Insights and Forecast - by Types
- 9.2.1. Inner Tire
- 9.2.2. Outer Tire
- 9.2.3. \
- 9.2.4. \
- 9.1. Market Analysis, Insights and Forecast - by Application
- 10. Asia Pacific Performance Tires Analysis, Insights and Forecast, 2020-2032
- 10.1. Market Analysis, Insights and Forecast - by Application
- 10.1.1. Commercial Vehicle
- 10.1.2. Passenger Vehicle
- 10.2. Market Analysis, Insights and Forecast - by Types
- 10.2.1. Inner Tire
- 10.2.2. Outer Tire
- 10.2.3. \
- 10.2.4. \
- 10.1. Market Analysis, Insights and Forecast - by Application
- 11. Competitive Analysis
- 11.1. Global Market Share Analysis 2025
- 11.2. Company Profiles
- 11.2.1 Bridgestone
- 11.2.1.1. Overview
- 11.2.1.2. Products
- 11.2.1.3. SWOT Analysis
- 11.2.1.4. Recent Developments
- 11.2.1.5. Financials (Based on Availability)
- 11.2.2 Toyo Tire
- 11.2.2.1. Overview
- 11.2.2.2. Products
- 11.2.2.3. SWOT Analysis
- 11.2.2.4. Recent Developments
- 11.2.2.5. Financials (Based on Availability)
- 11.2.3 Goodyear Tires
- 11.2.3.1. Overview
- 11.2.3.2. Products
- 11.2.3.3. SWOT Analysis
- 11.2.3.4. Recent Developments
- 11.2.3.5. Financials (Based on Availability)
- 11.2.4 Dunlop Tires
- 11.2.4.1. Overview
- 11.2.4.2. Products
- 11.2.4.3. SWOT Analysis
- 11.2.4.4. Recent Developments
- 11.2.4.5. Financials (Based on Availability)
- 11.2.5 Kal Tire
- 11.2.5.1. Overview
- 11.2.5.2. Products
- 11.2.5.3. SWOT Analysis
- 11.2.5.4. Recent Developments
- 11.2.5.5. Financials (Based on Availability)
- 11.2.6 Continental
- 11.2.6.1. Overview
- 11.2.6.2. Products
- 11.2.6.3. SWOT Analysis
- 11.2.6.4. Recent Developments
- 11.2.6.5. Financials (Based on Availability)
- 11.2.7 Hankook
- 11.2.7.1. Overview
- 11.2.7.2. Products
- 11.2.7.3. SWOT Analysis
- 11.2.7.4. Recent Developments
- 11.2.7.5. Financials (Based on Availability)
- 11.2.8 Nizhnekamskshina
- 11.2.8.1. Overview
- 11.2.8.2. Products
- 11.2.8.3. SWOT Analysis
- 11.2.8.4. Recent Developments
- 11.2.8.5. Financials (Based on Availability)
- 11.2.9 Nokian Tyres
- 11.2.9.1. Overview
- 11.2.9.2. Products
- 11.2.9.3. SWOT Analysis
- 11.2.9.4. Recent Developments
- 11.2.9.5. Financials (Based on Availability)
- 11.2.10 Cooper Tire
- 11.2.10.1. Overview
- 11.2.10.2. Products
- 11.2.10.3. SWOT Analysis
- 11.2.10.4. Recent Developments
- 11.2.10.5. Financials (Based on Availability)
- 11.2.11 Michelin
- 11.2.11.1. Overview
- 11.2.11.2. Products
- 11.2.11.3. SWOT Analysis
- 11.2.11.4. Recent Developments
- 11.2.11.5. Financials (Based on Availability)
- 11.2.1 Bridgestone
List of Figures
- Figure 1: Global Performance Tires Revenue Breakdown (undefined, %) by Region 2025 & 2033
- Figure 2: North America Performance Tires Revenue (undefined), by Application 2025 & 2033
- Figure 3: North America Performance Tires Revenue Share (%), by Application 2025 & 2033
- Figure 4: North America Performance Tires Revenue (undefined), by Types 2025 & 2033
- Figure 5: North America Performance Tires Revenue Share (%), by Types 2025 & 2033
- Figure 6: North America Performance Tires Revenue (undefined), by Country 2025 & 2033
- Figure 7: North America Performance Tires Revenue Share (%), by Country 2025 & 2033
- Figure 8: South America Performance Tires Revenue (undefined), by Application 2025 & 2033
- Figure 9: South America Performance Tires Revenue Share (%), by Application 2025 & 2033
- Figure 10: South America Performance Tires Revenue (undefined), by Types 2025 & 2033
- Figure 11: South America Performance Tires Revenue Share (%), by Types 2025 & 2033
- Figure 12: South America Performance Tires Revenue (undefined), by Country 2025 & 2033
- Figure 13: South America Performance Tires Revenue Share (%), by Country 2025 & 2033
- Figure 14: Europe Performance Tires Revenue (undefined), by Application 2025 & 2033
- Figure 15: Europe Performance Tires Revenue Share (%), by Application 2025 & 2033
- Figure 16: Europe Performance Tires Revenue (undefined), by Types 2025 & 2033
- Figure 17: Europe Performance Tires Revenue Share (%), by Types 2025 & 2033
- Figure 18: Europe Performance Tires Revenue (undefined), by Country 2025 & 2033
- Figure 19: Europe Performance Tires Revenue Share (%), by Country 2025 & 2033
- Figure 20: Middle East & Africa Performance Tires Revenue (undefined), by Application 2025 & 2033
- Figure 21: Middle East & Africa Performance Tires Revenue Share (%), by Application 2025 & 2033
- Figure 22: Middle East & Africa Performance Tires Revenue (undefined), by Types 2025 & 2033
- Figure 23: Middle East & Africa Performance Tires Revenue Share (%), by Types 2025 & 2033
- Figure 24: Middle East & Africa Performance Tires Revenue (undefined), by Country 2025 & 2033
- Figure 25: Middle East & Africa Performance Tires Revenue Share (%), by Country 2025 & 2033
- Figure 26: Asia Pacific Performance Tires Revenue (undefined), by Application 2025 & 2033
- Figure 27: Asia Pacific Performance Tires Revenue Share (%), by Application 2025 & 2033
- Figure 28: Asia Pacific Performance Tires Revenue (undefined), by Types 2025 & 2033
- Figure 29: Asia Pacific Performance Tires Revenue Share (%), by Types 2025 & 2033
- Figure 30: Asia Pacific Performance Tires Revenue (undefined), by Country 2025 & 2033
- Figure 31: Asia Pacific Performance Tires Revenue Share (%), by Country 2025 & 2033
List of Tables
- Table 1: Global Performance Tires Revenue undefined Forecast, by Application 2020 & 2033
- Table 2: Global Performance Tires Revenue undefined Forecast, by Types 2020 & 2033
- Table 3: Global Performance Tires Revenue undefined Forecast, by Region 2020 & 2033
- Table 4: Global Performance Tires Revenue undefined Forecast, by Application 2020 & 2033
- Table 5: Global Performance Tires Revenue undefined Forecast, by Types 2020 & 2033
- Table 6: Global Performance Tires Revenue undefined Forecast, by Country 2020 & 2033
- Table 7: United States Performance Tires Revenue (undefined) Forecast, by Application 2020 & 2033
- Table 8: Canada Performance Tires Revenue (undefined) Forecast, by Application 2020 & 2033
- Table 9: Mexico Performance Tires Revenue (undefined) Forecast, by Application 2020 & 2033
- Table 10: Global Performance Tires Revenue undefined Forecast, by Application 2020 & 2033
- Table 11: Global Performance Tires Revenue undefined Forecast, by Types 2020 & 2033
- Table 12: Global Performance Tires Revenue undefined Forecast, by Country 2020 & 2033
- Table 13: Brazil Performance Tires Revenue (undefined) Forecast, by Application 2020 & 2033
- Table 14: Argentina Performance Tires Revenue (undefined) Forecast, by Application 2020 & 2033
- Table 15: Rest of South America Performance Tires Revenue (undefined) Forecast, by Application 2020 & 2033
- Table 16: Global Performance Tires Revenue undefined Forecast, by Application 2020 & 2033
- Table 17: Global Performance Tires Revenue undefined Forecast, by Types 2020 & 2033
- Table 18: Global Performance Tires Revenue undefined Forecast, by Country 2020 & 2033
- Table 19: United Kingdom Performance Tires Revenue (undefined) Forecast, by Application 2020 & 2033
- Table 20: Germany Performance Tires Revenue (undefined) Forecast, by Application 2020 & 2033
- Table 21: France Performance Tires Revenue (undefined) Forecast, by Application 2020 & 2033
- Table 22: Italy Performance Tires Revenue (undefined) Forecast, by Application 2020 & 2033
- Table 23: Spain Performance Tires Revenue (undefined) Forecast, by Application 2020 & 2033
- Table 24: Russia Performance Tires Revenue (undefined) Forecast, by Application 2020 & 2033
- Table 25: Benelux Performance Tires Revenue (undefined) Forecast, by Application 2020 & 2033
- Table 26: Nordics Performance Tires Revenue (undefined) Forecast, by Application 2020 & 2033
- Table 27: Rest of Europe Performance Tires Revenue (undefined) Forecast, by Application 2020 & 2033
- Table 28: Global Performance Tires Revenue undefined Forecast, by Application 2020 & 2033
- Table 29: Global Performance Tires Revenue undefined Forecast, by Types 2020 & 2033
- Table 30: Global Performance Tires Revenue undefined Forecast, by Country 2020 & 2033
- Table 31: Turkey Performance Tires Revenue (undefined) Forecast, by Application 2020 & 2033
- Table 32: Israel Performance Tires Revenue (undefined) Forecast, by Application 2020 & 2033
- Table 33: GCC Performance Tires Revenue (undefined) Forecast, by Application 2020 & 2033
- Table 34: North Africa Performance Tires Revenue (undefined) Forecast, by Application 2020 & 2033
- Table 35: South Africa Performance Tires Revenue (undefined) Forecast, by Application 2020 & 2033
- Table 36: Rest of Middle East & Africa Performance Tires Revenue (undefined) Forecast, by Application 2020 & 2033
- Table 37: Global Performance Tires Revenue undefined Forecast, by Application 2020 & 2033
- Table 38: Global Performance Tires Revenue undefined Forecast, by Types 2020 & 2033
- Table 39: Global Performance Tires Revenue undefined Forecast, by Country 2020 & 2033
- Table 40: China Performance Tires Revenue (undefined) Forecast, by Application 2020 & 2033
- Table 41: India Performance Tires Revenue (undefined) Forecast, by Application 2020 & 2033
- Table 42: Japan Performance Tires Revenue (undefined) Forecast, by Application 2020 & 2033
- Table 43: South Korea Performance Tires Revenue (undefined) Forecast, by Application 2020 & 2033
- Table 44: ASEAN Performance Tires Revenue (undefined) Forecast, by Application 2020 & 2033
- Table 45: Oceania Performance Tires Revenue (undefined) Forecast, by Application 2020 & 2033
- Table 46: Rest of Asia Pacific Performance Tires Revenue (undefined) Forecast, by Application 2020 & 2033
Frequently Asked Questions
1. What is the projected Compound Annual Growth Rate (CAGR) of the Performance Tires?
The projected CAGR is approximately 3.04%.
2. Which companies are prominent players in the Performance Tires?
Key companies in the market include Bridgestone, Toyo Tire, Goodyear Tires, Dunlop Tires, Kal Tire, Continental, Hankook, Nizhnekamskshina, Nokian Tyres, Cooper Tire, Michelin.
3. What are the main segments of the Performance Tires?
The market segments include Application, Types.
4. Can you provide details about the market size?
The market size is estimated to be USD XXX N/A as of 2022.
5. What are some drivers contributing to market growth?
N/A
6. What are the notable trends driving market growth?
N/A
7. Are there any restraints impacting market growth?
N/A
8. Can you provide examples of recent developments in the market?
N/A
9. What pricing options are available for accessing the report?
Pricing options include single-user, multi-user, and enterprise licenses priced at USD 2900.00, USD 4350.00, and USD 5800.00 respectively.
10. Is the market size provided in terms of value or volume?
The market size is provided in terms of value, measured in N/A.
11. Are there any specific market keywords associated with the report?
Yes, the market keyword associated with the report is "Performance Tires," which aids in identifying and referencing the specific market segment covered.
12. How do I determine which pricing option suits my needs best?
The pricing options vary based on user requirements and access needs. Individual users may opt for single-user licenses, while businesses requiring broader access may choose multi-user or enterprise licenses for cost-effective access to the report.
13. Are there any additional resources or data provided in the Performance Tires report?
While the report offers comprehensive insights, it's advisable to review the specific contents or supplementary materials provided to ascertain if additional resources or data are available.
14. How can I stay updated on further developments or reports in the Performance Tires?
To stay informed about further developments, trends, and reports in the Performance Tires, consider subscribing to industry newsletters, following relevant companies and organizations, or regularly checking reputable industry news sources and publications.
Methodology
Step 1 - Identification of Relevant Samples Size from Population Database


Step 2 - Approaches for Defining Global Market Size (Value, Volume* & Price*)

Note*: In applicable scenarios
Step 3 - Data Sources
Primary Research
- Web Analytics
- Survey Reports
- Research Institute
- Latest Research Reports
- Opinion Leaders
Secondary Research
- Annual Reports
- White Paper
- Latest Press Release
- Industry Association
- Paid Database
- Investor Presentations

Step 4 - Data Triangulation
Involves using different sources of information in order to increase the validity of a study
These sources are likely to be stakeholders in a program - participants, other researchers, program staff, other community members, and so on.
Then we put all data in single framework & apply various statistical tools to find out the dynamic on the market.
During the analysis stage, feedback from the stakeholder groups would be compared to determine areas of agreement as well as areas of divergence