

Key Insights
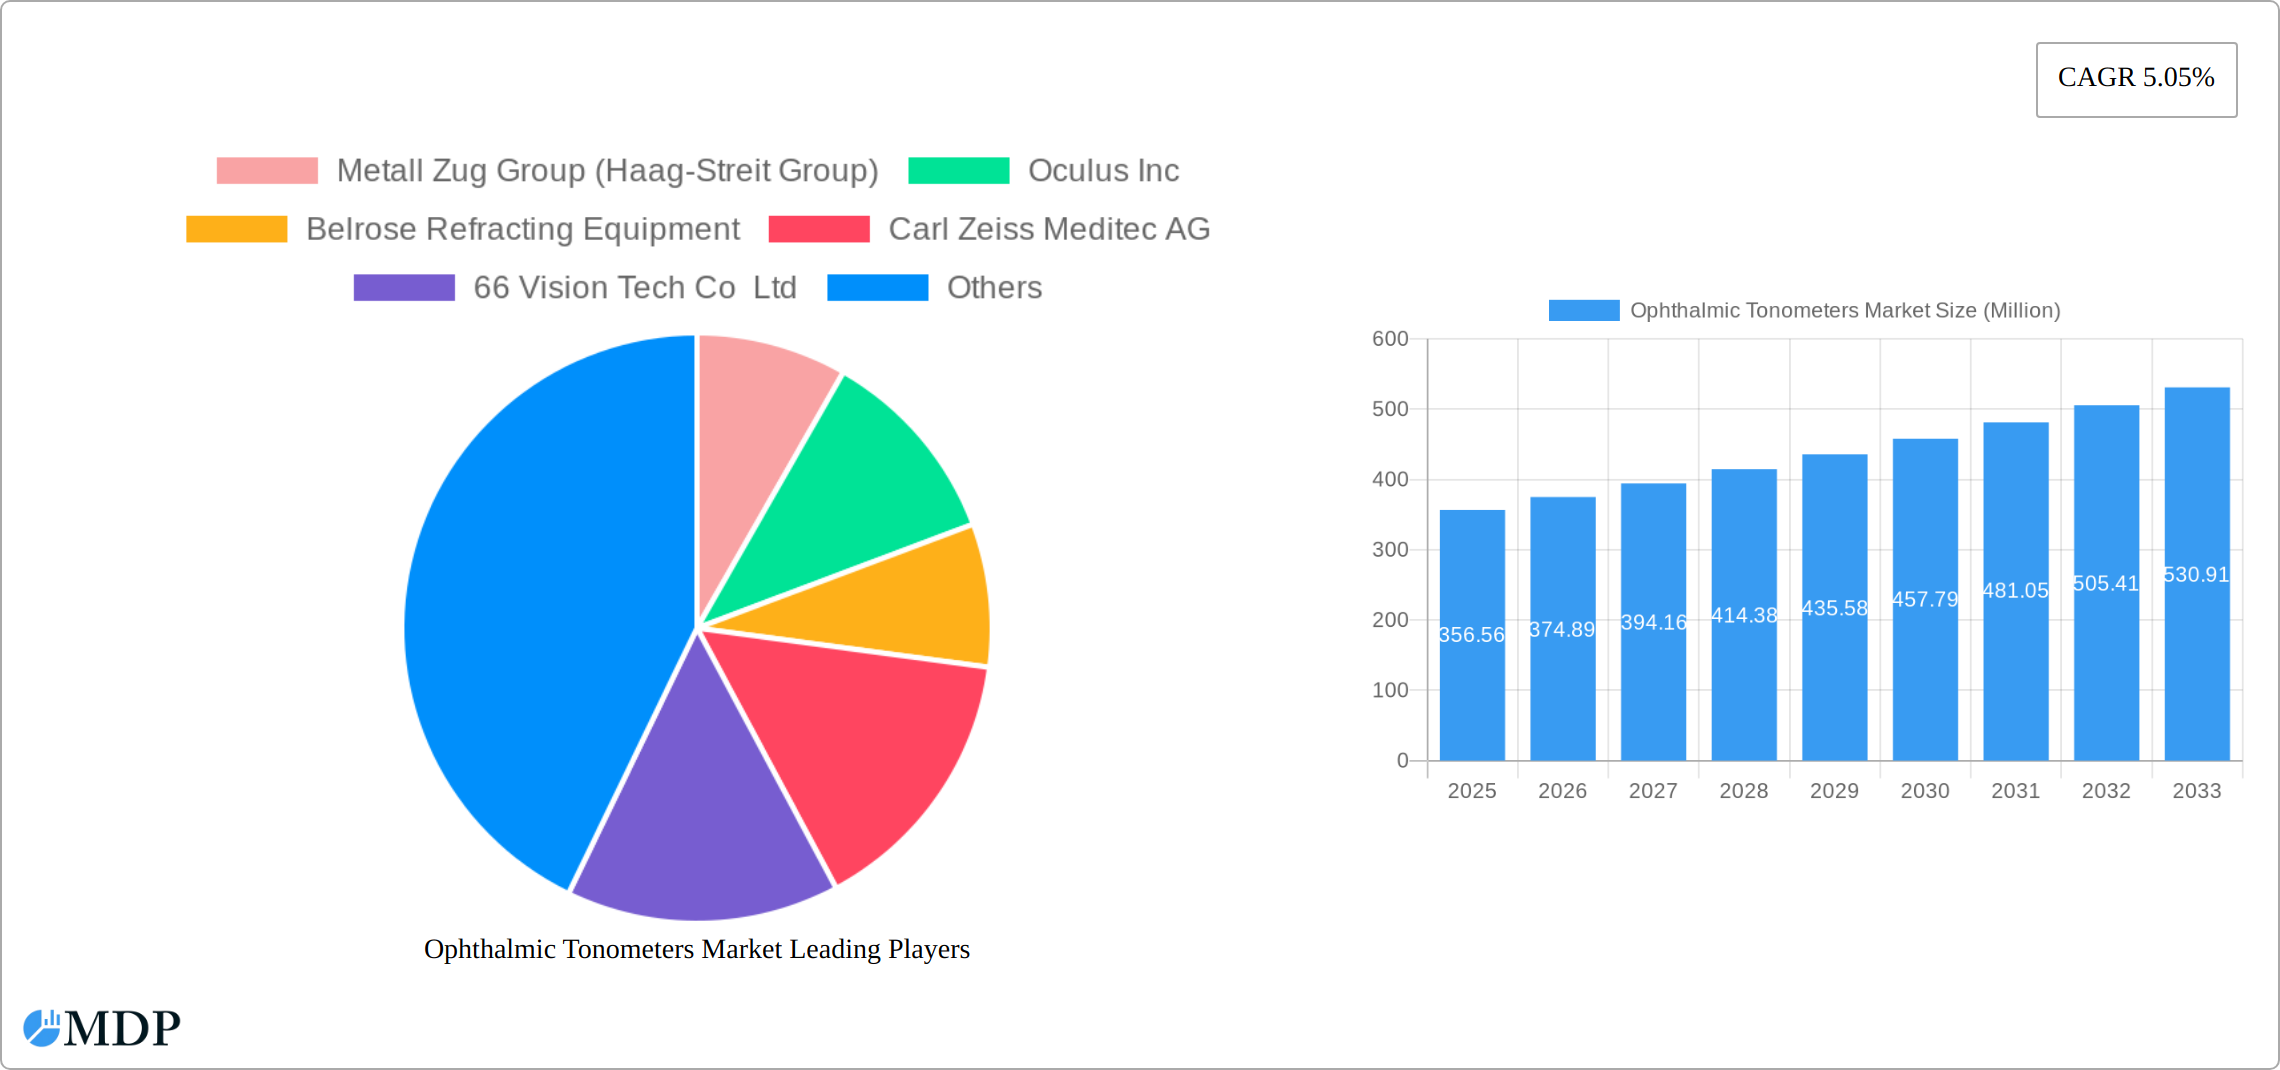
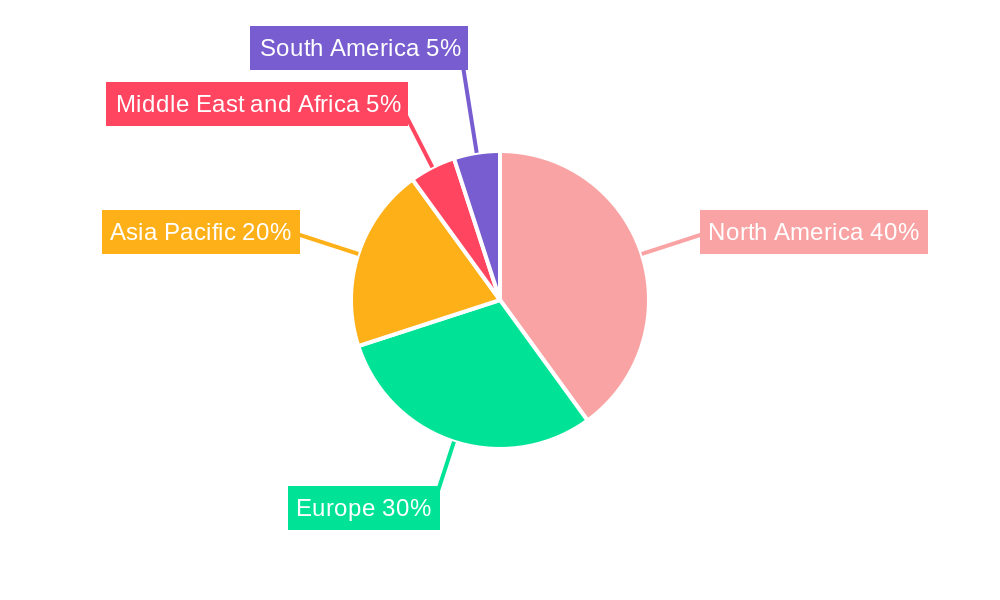
The global ophthalmic tonometers market, valued at $356.56 million in 2025, is projected to experience robust growth, driven by a rising prevalence of glaucoma and other eye diseases requiring regular intraocular pressure (IOP) monitoring. The market's Compound Annual Growth Rate (CAGR) of 5.05% from 2025 to 2033 indicates a significant expansion over the forecast period. Key drivers include technological advancements leading to more portable, accurate, and user-friendly devices, alongside increased healthcare spending globally and a growing awareness of eye health. The market is segmented by type (direct and indirect), technology (applanation, indentation, rebound, and other), portability (desktop and handheld), and end-user (hospitals and ophthalmic centers). The increasing adoption of non-contact tonometry, minimizing patient discomfort and infection risk, is a prominent trend. However, high costs associated with advanced technologies and the presence of alternative diagnostic methods pose some restraints. The North American market currently holds a significant share, driven by high healthcare expenditure and technological adoption rates, followed by Europe and Asia Pacific. The competitive landscape is characterized by the presence of established players such as Haag-Streit Group, Carl Zeiss Meditec AG, and Topcon Corporation, alongside emerging companies introducing innovative tonometry solutions. Continued technological innovation and strategic partnerships are anticipated to shape the market's future trajectory.
The substantial growth in the ophthalmic tonometers market is fueled by a growing geriatric population susceptible to glaucoma and other vision-threatening conditions. The demand for early diagnosis and effective management of these diseases is a significant factor driving market expansion. Furthermore, improvements in device portability and ease of use are making ophthalmic tonometry more accessible in diverse healthcare settings, extending beyond specialized clinics. Developing economies in Asia-Pacific are emerging as significant growth contributors, reflecting improved healthcare infrastructure and rising healthcare awareness. However, challenges like pricing and reimbursement policies in certain regions and the availability of affordable alternatives need to be addressed for sustained market growth. The market's future is likely to see increasing integration of digital technologies and telehealth platforms for remote IOP monitoring, enhancing patient care and convenience.
Ophthalmic Tonometers Market: A Comprehensive Report (2019-2033)
This in-depth report provides a comprehensive analysis of the Ophthalmic Tonometers Market, offering invaluable insights for industry stakeholders, investors, and market entrants. The study covers the period 2019-2033, with a focus on the forecast period 2025-2033, and utilizes 2025 as the base year. The report is meticulously structured to deliver actionable intelligence, encompassing market dynamics, leading players, technological advancements, and future growth opportunities within the ophthalmic diagnostics sector. The global market size is projected to reach xx Million by 2033.
Ophthalmic Tonometers Market Dynamics & Concentration
The Ophthalmic Tonometers market is characterized by a moderately concentrated competitive landscape, with key players holding significant market share. However, the presence of several smaller, specialized companies ensures a dynamic market environment. Market concentration is influenced by factors such as technological innovation, regulatory approvals, and strategic mergers & acquisitions (M&A). The increasing demand for advanced and non-invasive tonometry technologies drives innovation within the sector. Stringent regulatory frameworks govern the manufacturing and distribution of ophthalmic devices, impacting market entry and competition. The availability of substitute technologies, such as optical coherence tomography (OCT), presents a competitive challenge. However, the established reliability and cost-effectiveness of tonometry maintain its significant market position.
- Market Share: Top 5 players hold an estimated xx% market share in 2025.
- M&A Activity: A total of xx M&A deals were observed between 2019 and 2024, largely driven by the need to expand product portfolios and geographical reach.
- End-User Trends: Growing prevalence of glaucoma and other ocular diseases is driving demand for accurate and efficient tonometry solutions, particularly in developed markets with aging populations.
Ophthalmic Tonometers Market Industry Trends & Analysis
The Ophthalmic Tonometers market exhibits robust growth, driven by several converging factors. Technological advancements, particularly the rise of non-contact and rebound tonometry, are significantly improving diagnostic accuracy and patient comfort, thereby boosting market penetration. This is further amplified by the growing global awareness of glaucoma and other eye diseases, leading to increased demand for accurate and efficient diagnostic tools. The escalating prevalence of these conditions, combined with the expansion of healthcare infrastructure in developing economies, creates a fertile ground for market expansion. However, the market dynamics are also shaped by competitive pressures and the pricing strategies employed by established market players.
- CAGR (2025-2033): Projected at a significant xx%, indicating robust market expansion.
- Market Share & Growth: Applanation tonometry currently dominates the market share, while rebound tonometry demonstrates the most promising growth trajectory, reflecting a shift towards non-invasive technologies.
- Consumer Demand: A clear trend indicates rising demand for portable and user-friendly devices, especially within ophthalmic centers and point-of-care settings, emphasizing convenience and accessibility.
Leading Markets & Segments in Ophthalmic Tonometers Market
North America currently leads the market, followed by Europe and the Asia-Pacific region. This leadership is largely attributed to well-established healthcare infrastructure, higher disposable incomes, and a greater emphasis on proactive eye health. Segment analysis reveals the following:
By Type: Direct tonometers maintain a substantial market share compared to indirect tonometers due to their user-friendliness and accuracy.
By Technology: Applanation tonometry remains the dominant technology, although rebound tonometry is experiencing accelerated growth due to its non-invasive nature and benefits for patient comfort.
By Portability: Handheld tonometers are gaining popularity due to their portability and suitability for diverse healthcare settings.
By End User: Hospitals and specialized ophthalmic centers remain the primary end-users, driven by the concentration of diagnostic equipment and skilled personnel.
Key Regional Drivers:
- North America: Advanced healthcare infrastructure, high glaucoma prevalence, and favorable reimbursement policies.
- Europe: Well-developed healthcare systems, an aging population, and increasing awareness of eye health issues.
- Asia Pacific: Rapidly expanding healthcare infrastructure, rising disposable incomes, and a growing prevalence of eye diseases.
Ophthalmic Tonometers Market Product Developments
Recent years have witnessed significant advancements in ophthalmic tonometer technology. The introduction of non-contact and rebound tonometry devices has revolutionized the diagnostic process, reducing patient discomfort and improving accuracy. These innovative devices offer advantages such as faster measurements and reduced need for anesthesia. Furthermore, integration of digital imaging and data management capabilities enhances workflow efficiency and data analysis in ophthalmic practices. The trend toward miniaturization and improved portability continues to drive product innovation within this sector.
Key Drivers of Ophthalmic Tonometers Market Growth
Several factors are propelling the growth of the Ophthalmic Tonometers market. Firstly, technological advancements, such as the development of non-contact and rebound tonometers, are enhancing accuracy and patient comfort. Secondly, the rising prevalence of glaucoma and other eye diseases is creating a significant demand for reliable diagnostic tools. Thirdly, the growing healthcare infrastructure in emerging economies, coupled with increasing healthcare expenditure, is contributing to market expansion. Finally, favorable regulatory frameworks and increased healthcare awareness also play a significant role.
Challenges in the Ophthalmic Tonometers Market
Despite the significant growth potential, the Ophthalmic Tonometers market faces several challenges. High initial capital expenditure for advanced tonometry systems can be a barrier to entry for smaller healthcare facilities. The requirement for specialized training and ongoing maintenance for sophisticated devices adds complexity. Furthermore, intense competition among established players and the influx of new entrants are creating price pressures in specific market segments. Finally, stringent regulatory requirements for medical devices can hinder market entry and expansion.
Emerging Opportunities in Ophthalmic Tonometers Market
Significant opportunities lie ahead for companies operating in this market. The development of integrated diagnostic platforms that combine tonometry with other ophthalmic imaging modalities promises increased efficiency and comprehensive patient care. Strategic partnerships between tonometer manufacturers and ophthalmic imaging companies can unlock synergistic growth opportunities. Expansion into emerging markets, particularly in regions with a high prevalence of eye diseases and developing healthcare infrastructure, offers significant potential. Furthermore, the integration of artificial intelligence (AI) into tonometry systems can enhance diagnostic accuracy and data analysis.
Leading Players in the Ophthalmic Tonometers Market Sector
- Metall Zug Group (Haag-Streit Group)
- Oculus Inc
- Belrose Refracting Equipment
- Carl Zeiss Meditec AG
- 66 Vision Tech Co Ltd
- Kowa American Corporation
- Revenio Group PLC (iCare Finland OY)
- Topcon Corporation
- Nidek Co Ltd
- Canon Medical Systems Corporation
- Rexxam Co Ltd
- Tomey Corporation
- AMETEK Inc (Reichert Technologies)
- Halma plc (Keeler Ltd)
Key Milestones in Ophthalmic Tonometers Market Industry
- May 2023: Reichert Technologies launched the Tono-Vera Tonometer with ActiView Positioning System, a rebound tonometer eliminating the need for topical anesthetic. This launch significantly impacted the market by offering a more patient-friendly and convenient solution.
- November 2022: NIDEK CO., LTD launched the NT-1p Non-Contact Tono/Pachymeter, automating non-contact tonometry and pachymetry, improving efficiency and reducing measurement error. This impacted the market by introducing an advanced, fully automated solution.
Strategic Outlook for Ophthalmic Tonometers Market
The Ophthalmic Tonometers market is projected to experience sustained growth, fueled by ongoing technological advancements, the rising prevalence of eye diseases, and the expansion of healthcare infrastructure globally. Companies focused on innovation, particularly in non-contact and rebound tonometry, are well-positioned to gain a competitive advantage. Strategic partnerships, targeted marketing, and expansion into emerging markets are key growth strategies. The integration of AI and big data analytics offers significant opportunities to enhance diagnostic precision and improve data management within the ophthalmic diagnostics sector.
Ophthalmic Tonometers Market Segmentation
-
1. Technology
- 1.1. Applanation Tonometry
- 1.2. Indentation Tonometry
- 1.3. Rebound Tonometry
- 1.4. Other Technologies
-
2. Portability Type
- 2.1. Desktop
- 2.2. Handheld
-
3. End User
- 3.1. Hospitals
- 3.2. Ophthalmic Centers
-
4. Type
- 4.1. Direct
- 4.2. Indirect
Ophthalmic Tonometers Market Segmentation By Geography
-
1. North America
- 1.1. United States
- 1.2. Canada
- 1.3. Mexico
-
2. Europe
- 2.1. Germany
- 2.2. United Kingdom
- 2.3. France
- 2.4. Italy
- 2.5. Spain
- 2.6. Rest of Europe
-
3. Asia Pacific
- 3.1. China
- 3.2. Japan
- 3.3. India
- 3.4. Australia
- 3.5. South Korea
- 3.6. Rest of Asia Pacific
-
4. Middle East and Africa
- 4.1. GCC
- 4.2. South Africa
- 4.3. Rest of Middle East and Africa
-
5. South America
- 5.1. Brazil
- 5.2. Argentina
- 5.3. Rest of South America
Ophthalmic Tonometers Market REPORT HIGHLIGHTS
| Aspects | Details |
|---|---|
| Study Period | 2019-2033 |
| Base Year | 2024 |
| Estimated Year | 2025 |
| Forecast Period | 2025-2033 |
| Historical Period | 2019-2024 |
| Growth Rate | CAGR of 5.05% from 2019-2033 |
| Segmentation |
|
Table of Contents
- 1. Introduction
- 1.1. Research Scope
- 1.2. Market Segmentation
- 1.3. Research Methodology
- 1.4. Definitions and Assumptions
- 2. Executive Summary
- 2.1. Introduction
- 3. Market Dynamics
- 3.1. Introduction
- 3.2. Market Drivers
- 3.2.1. Increasing Incidence of Glaucoma; Increasing Geriatric and Diabetic Populations; Increasing Number of Eye Checkup Camps and Glaucoma Awareness Programs
- 3.3. Market Restrains
- 3.3.1. Risk of Infection with Contact Tonometers and Lack of Accuracy in Non-contact Tonometers
- 3.4. Market Trends
- 3.4.1. Applanation Tonometry Segment is Expected to Hold a Significant Share in the Market Over the Forecast Period
- 4. Market Factor Analysis
- 4.1. Porters Five Forces
- 4.2. Supply/Value Chain
- 4.3. PESTEL analysis
- 4.4. Market Entropy
- 4.5. Patent/Trademark Analysis
- 5. Global Ophthalmic Tonometers Market Analysis, Insights and Forecast, 2019-2031
- 5.1. Market Analysis, Insights and Forecast - by Technology
- 5.1.1. Applanation Tonometry
- 5.1.2. Indentation Tonometry
- 5.1.3. Rebound Tonometry
- 5.1.4. Other Technologies
- 5.2. Market Analysis, Insights and Forecast - by Portability Type
- 5.2.1. Desktop
- 5.2.2. Handheld
- 5.3. Market Analysis, Insights and Forecast - by End User
- 5.3.1. Hospitals
- 5.3.2. Ophthalmic Centers
- 5.4. Market Analysis, Insights and Forecast - by Type
- 5.4.1. Direct
- 5.4.2. Indirect
- 5.5. Market Analysis, Insights and Forecast - by Region
- 5.5.1. North America
- 5.5.2. Europe
- 5.5.3. Asia Pacific
- 5.5.4. Middle East and Africa
- 5.5.5. South America
- 5.1. Market Analysis, Insights and Forecast - by Technology
- 6. North America Ophthalmic Tonometers Market Analysis, Insights and Forecast, 2019-2031
- 6.1. Market Analysis, Insights and Forecast - by Technology
- 6.1.1. Applanation Tonometry
- 6.1.2. Indentation Tonometry
- 6.1.3. Rebound Tonometry
- 6.1.4. Other Technologies
- 6.2. Market Analysis, Insights and Forecast - by Portability Type
- 6.2.1. Desktop
- 6.2.2. Handheld
- 6.3. Market Analysis, Insights and Forecast - by End User
- 6.3.1. Hospitals
- 6.3.2. Ophthalmic Centers
- 6.4. Market Analysis, Insights and Forecast - by Type
- 6.4.1. Direct
- 6.4.2. Indirect
- 6.1. Market Analysis, Insights and Forecast - by Technology
- 7. Europe Ophthalmic Tonometers Market Analysis, Insights and Forecast, 2019-2031
- 7.1. Market Analysis, Insights and Forecast - by Technology
- 7.1.1. Applanation Tonometry
- 7.1.2. Indentation Tonometry
- 7.1.3. Rebound Tonometry
- 7.1.4. Other Technologies
- 7.2. Market Analysis, Insights and Forecast - by Portability Type
- 7.2.1. Desktop
- 7.2.2. Handheld
- 7.3. Market Analysis, Insights and Forecast - by End User
- 7.3.1. Hospitals
- 7.3.2. Ophthalmic Centers
- 7.4. Market Analysis, Insights and Forecast - by Type
- 7.4.1. Direct
- 7.4.2. Indirect
- 7.1. Market Analysis, Insights and Forecast - by Technology
- 8. Asia Pacific Ophthalmic Tonometers Market Analysis, Insights and Forecast, 2019-2031
- 8.1. Market Analysis, Insights and Forecast - by Technology
- 8.1.1. Applanation Tonometry
- 8.1.2. Indentation Tonometry
- 8.1.3. Rebound Tonometry
- 8.1.4. Other Technologies
- 8.2. Market Analysis, Insights and Forecast - by Portability Type
- 8.2.1. Desktop
- 8.2.2. Handheld
- 8.3. Market Analysis, Insights and Forecast - by End User
- 8.3.1. Hospitals
- 8.3.2. Ophthalmic Centers
- 8.4. Market Analysis, Insights and Forecast - by Type
- 8.4.1. Direct
- 8.4.2. Indirect
- 8.1. Market Analysis, Insights and Forecast - by Technology
- 9. Middle East and Africa Ophthalmic Tonometers Market Analysis, Insights and Forecast, 2019-2031
- 9.1. Market Analysis, Insights and Forecast - by Technology
- 9.1.1. Applanation Tonometry
- 9.1.2. Indentation Tonometry
- 9.1.3. Rebound Tonometry
- 9.1.4. Other Technologies
- 9.2. Market Analysis, Insights and Forecast - by Portability Type
- 9.2.1. Desktop
- 9.2.2. Handheld
- 9.3. Market Analysis, Insights and Forecast - by End User
- 9.3.1. Hospitals
- 9.3.2. Ophthalmic Centers
- 9.4. Market Analysis, Insights and Forecast - by Type
- 9.4.1. Direct
- 9.4.2. Indirect
- 9.1. Market Analysis, Insights and Forecast - by Technology
- 10. South America Ophthalmic Tonometers Market Analysis, Insights and Forecast, 2019-2031
- 10.1. Market Analysis, Insights and Forecast - by Technology
- 10.1.1. Applanation Tonometry
- 10.1.2. Indentation Tonometry
- 10.1.3. Rebound Tonometry
- 10.1.4. Other Technologies
- 10.2. Market Analysis, Insights and Forecast - by Portability Type
- 10.2.1. Desktop
- 10.2.2. Handheld
- 10.3. Market Analysis, Insights and Forecast - by End User
- 10.3.1. Hospitals
- 10.3.2. Ophthalmic Centers
- 10.4. Market Analysis, Insights and Forecast - by Type
- 10.4.1. Direct
- 10.4.2. Indirect
- 10.1. Market Analysis, Insights and Forecast - by Technology
- 11. North America Ophthalmic Tonometers Market Analysis, Insights and Forecast, 2019-2031
- 11.1. Market Analysis, Insights and Forecast - By Country/Sub-region
- 11.1.1 United States
- 11.1.2 Canada
- 11.1.3 Mexico
- 12. Europe Ophthalmic Tonometers Market Analysis, Insights and Forecast, 2019-2031
- 12.1. Market Analysis, Insights and Forecast - By Country/Sub-region
- 12.1.1 Germany
- 12.1.2 United Kingdom
- 12.1.3 France
- 12.1.4 Italy
- 12.1.5 Spain
- 12.1.6 Rest of Europe
- 13. Asia Pacific Ophthalmic Tonometers Market Analysis, Insights and Forecast, 2019-2031
- 13.1. Market Analysis, Insights and Forecast - By Country/Sub-region
- 13.1.1 China
- 13.1.2 Japan
- 13.1.3 India
- 13.1.4 Australia
- 13.1.5 South Korea
- 13.1.6 Rest of Asia Pacific
- 14. Middle East and Africa Ophthalmic Tonometers Market Analysis, Insights and Forecast, 2019-2031
- 14.1. Market Analysis, Insights and Forecast - By Country/Sub-region
- 14.1.1 GCC
- 14.1.2 South Africa
- 14.1.3 Rest of Middle East and Africa
- 15. South America Ophthalmic Tonometers Market Analysis, Insights and Forecast, 2019-2031
- 15.1. Market Analysis, Insights and Forecast - By Country/Sub-region
- 15.1.1 Brazil
- 15.1.2 Argentina
- 15.1.3 Rest of South America
- 16. Competitive Analysis
- 16.1. Global Market Share Analysis 2024
- 16.2. Company Profiles
- 16.2.1 Metall Zug Group (Haag-Streit Group)
- 16.2.1.1. Overview
- 16.2.1.2. Products
- 16.2.1.3. SWOT Analysis
- 16.2.1.4. Recent Developments
- 16.2.1.5. Financials (Based on Availability)
- 16.2.2 Oculus Inc
- 16.2.2.1. Overview
- 16.2.2.2. Products
- 16.2.2.3. SWOT Analysis
- 16.2.2.4. Recent Developments
- 16.2.2.5. Financials (Based on Availability)
- 16.2.3 Belrose Refracting Equipment
- 16.2.3.1. Overview
- 16.2.3.2. Products
- 16.2.3.3. SWOT Analysis
- 16.2.3.4. Recent Developments
- 16.2.3.5. Financials (Based on Availability)
- 16.2.4 Carl Zeiss Meditec AG
- 16.2.4.1. Overview
- 16.2.4.2. Products
- 16.2.4.3. SWOT Analysis
- 16.2.4.4. Recent Developments
- 16.2.4.5. Financials (Based on Availability)
- 16.2.5 66 Vision Tech Co Ltd
- 16.2.5.1. Overview
- 16.2.5.2. Products
- 16.2.5.3. SWOT Analysis
- 16.2.5.4. Recent Developments
- 16.2.5.5. Financials (Based on Availability)
- 16.2.6 Kowa American Corporation
- 16.2.6.1. Overview
- 16.2.6.2. Products
- 16.2.6.3. SWOT Analysis
- 16.2.6.4. Recent Developments
- 16.2.6.5. Financials (Based on Availability)
- 16.2.7 Revenio Group PLC (iCare Finland OY)
- 16.2.7.1. Overview
- 16.2.7.2. Products
- 16.2.7.3. SWOT Analysis
- 16.2.7.4. Recent Developments
- 16.2.7.5. Financials (Based on Availability)
- 16.2.8 Topcon Corporation*List Not Exhaustive
- 16.2.8.1. Overview
- 16.2.8.2. Products
- 16.2.8.3. SWOT Analysis
- 16.2.8.4. Recent Developments
- 16.2.8.5. Financials (Based on Availability)
- 16.2.9 Nidek Co Ltd
- 16.2.9.1. Overview
- 16.2.9.2. Products
- 16.2.9.3. SWOT Analysis
- 16.2.9.4. Recent Developments
- 16.2.9.5. Financials (Based on Availability)
- 16.2.10 Canon Medical Systems Corporation
- 16.2.10.1. Overview
- 16.2.10.2. Products
- 16.2.10.3. SWOT Analysis
- 16.2.10.4. Recent Developments
- 16.2.10.5. Financials (Based on Availability)
- 16.2.11 Rexxam Co Ltd
- 16.2.11.1. Overview
- 16.2.11.2. Products
- 16.2.11.3. SWOT Analysis
- 16.2.11.4. Recent Developments
- 16.2.11.5. Financials (Based on Availability)
- 16.2.12 Tomey Corporation
- 16.2.12.1. Overview
- 16.2.12.2. Products
- 16.2.12.3. SWOT Analysis
- 16.2.12.4. Recent Developments
- 16.2.12.5. Financials (Based on Availability)
- 16.2.13 AMETEK Inc (Reichert Technologies)
- 16.2.13.1. Overview
- 16.2.13.2. Products
- 16.2.13.3. SWOT Analysis
- 16.2.13.4. Recent Developments
- 16.2.13.5. Financials (Based on Availability)
- 16.2.14 Halma plc (Keeler Ltd )
- 16.2.14.1. Overview
- 16.2.14.2. Products
- 16.2.14.3. SWOT Analysis
- 16.2.14.4. Recent Developments
- 16.2.14.5. Financials (Based on Availability)
- 16.2.1 Metall Zug Group (Haag-Streit Group)
List of Figures
- Figure 1: Global Ophthalmic Tonometers Market Revenue Breakdown (Million, %) by Region 2024 & 2032
- Figure 2: North America Ophthalmic Tonometers Market Revenue (Million), by Country 2024 & 2032
- Figure 3: North America Ophthalmic Tonometers Market Revenue Share (%), by Country 2024 & 2032
- Figure 4: Europe Ophthalmic Tonometers Market Revenue (Million), by Country 2024 & 2032
- Figure 5: Europe Ophthalmic Tonometers Market Revenue Share (%), by Country 2024 & 2032
- Figure 6: Asia Pacific Ophthalmic Tonometers Market Revenue (Million), by Country 2024 & 2032
- Figure 7: Asia Pacific Ophthalmic Tonometers Market Revenue Share (%), by Country 2024 & 2032
- Figure 8: Middle East and Africa Ophthalmic Tonometers Market Revenue (Million), by Country 2024 & 2032
- Figure 9: Middle East and Africa Ophthalmic Tonometers Market Revenue Share (%), by Country 2024 & 2032
- Figure 10: South America Ophthalmic Tonometers Market Revenue (Million), by Country 2024 & 2032
- Figure 11: South America Ophthalmic Tonometers Market Revenue Share (%), by Country 2024 & 2032
- Figure 12: North America Ophthalmic Tonometers Market Revenue (Million), by Technology 2024 & 2032
- Figure 13: North America Ophthalmic Tonometers Market Revenue Share (%), by Technology 2024 & 2032
- Figure 14: North America Ophthalmic Tonometers Market Revenue (Million), by Portability Type 2024 & 2032
- Figure 15: North America Ophthalmic Tonometers Market Revenue Share (%), by Portability Type 2024 & 2032
- Figure 16: North America Ophthalmic Tonometers Market Revenue (Million), by End User 2024 & 2032
- Figure 17: North America Ophthalmic Tonometers Market Revenue Share (%), by End User 2024 & 2032
- Figure 18: North America Ophthalmic Tonometers Market Revenue (Million), by Type 2024 & 2032
- Figure 19: North America Ophthalmic Tonometers Market Revenue Share (%), by Type 2024 & 2032
- Figure 20: North America Ophthalmic Tonometers Market Revenue (Million), by Country 2024 & 2032
- Figure 21: North America Ophthalmic Tonometers Market Revenue Share (%), by Country 2024 & 2032
- Figure 22: Europe Ophthalmic Tonometers Market Revenue (Million), by Technology 2024 & 2032
- Figure 23: Europe Ophthalmic Tonometers Market Revenue Share (%), by Technology 2024 & 2032
- Figure 24: Europe Ophthalmic Tonometers Market Revenue (Million), by Portability Type 2024 & 2032
- Figure 25: Europe Ophthalmic Tonometers Market Revenue Share (%), by Portability Type 2024 & 2032
- Figure 26: Europe Ophthalmic Tonometers Market Revenue (Million), by End User 2024 & 2032
- Figure 27: Europe Ophthalmic Tonometers Market Revenue Share (%), by End User 2024 & 2032
- Figure 28: Europe Ophthalmic Tonometers Market Revenue (Million), by Type 2024 & 2032
- Figure 29: Europe Ophthalmic Tonometers Market Revenue Share (%), by Type 2024 & 2032
- Figure 30: Europe Ophthalmic Tonometers Market Revenue (Million), by Country 2024 & 2032
- Figure 31: Europe Ophthalmic Tonometers Market Revenue Share (%), by Country 2024 & 2032
- Figure 32: Asia Pacific Ophthalmic Tonometers Market Revenue (Million), by Technology 2024 & 2032
- Figure 33: Asia Pacific Ophthalmic Tonometers Market Revenue Share (%), by Technology 2024 & 2032
- Figure 34: Asia Pacific Ophthalmic Tonometers Market Revenue (Million), by Portability Type 2024 & 2032
- Figure 35: Asia Pacific Ophthalmic Tonometers Market Revenue Share (%), by Portability Type 2024 & 2032
- Figure 36: Asia Pacific Ophthalmic Tonometers Market Revenue (Million), by End User 2024 & 2032
- Figure 37: Asia Pacific Ophthalmic Tonometers Market Revenue Share (%), by End User 2024 & 2032
- Figure 38: Asia Pacific Ophthalmic Tonometers Market Revenue (Million), by Type 2024 & 2032
- Figure 39: Asia Pacific Ophthalmic Tonometers Market Revenue Share (%), by Type 2024 & 2032
- Figure 40: Asia Pacific Ophthalmic Tonometers Market Revenue (Million), by Country 2024 & 2032
- Figure 41: Asia Pacific Ophthalmic Tonometers Market Revenue Share (%), by Country 2024 & 2032
- Figure 42: Middle East and Africa Ophthalmic Tonometers Market Revenue (Million), by Technology 2024 & 2032
- Figure 43: Middle East and Africa Ophthalmic Tonometers Market Revenue Share (%), by Technology 2024 & 2032
- Figure 44: Middle East and Africa Ophthalmic Tonometers Market Revenue (Million), by Portability Type 2024 & 2032
- Figure 45: Middle East and Africa Ophthalmic Tonometers Market Revenue Share (%), by Portability Type 2024 & 2032
- Figure 46: Middle East and Africa Ophthalmic Tonometers Market Revenue (Million), by End User 2024 & 2032
- Figure 47: Middle East and Africa Ophthalmic Tonometers Market Revenue Share (%), by End User 2024 & 2032
- Figure 48: Middle East and Africa Ophthalmic Tonometers Market Revenue (Million), by Type 2024 & 2032
- Figure 49: Middle East and Africa Ophthalmic Tonometers Market Revenue Share (%), by Type 2024 & 2032
- Figure 50: Middle East and Africa Ophthalmic Tonometers Market Revenue (Million), by Country 2024 & 2032
- Figure 51: Middle East and Africa Ophthalmic Tonometers Market Revenue Share (%), by Country 2024 & 2032
- Figure 52: South America Ophthalmic Tonometers Market Revenue (Million), by Technology 2024 & 2032
- Figure 53: South America Ophthalmic Tonometers Market Revenue Share (%), by Technology 2024 & 2032
- Figure 54: South America Ophthalmic Tonometers Market Revenue (Million), by Portability Type 2024 & 2032
- Figure 55: South America Ophthalmic Tonometers Market Revenue Share (%), by Portability Type 2024 & 2032
- Figure 56: South America Ophthalmic Tonometers Market Revenue (Million), by End User 2024 & 2032
- Figure 57: South America Ophthalmic Tonometers Market Revenue Share (%), by End User 2024 & 2032
- Figure 58: South America Ophthalmic Tonometers Market Revenue (Million), by Type 2024 & 2032
- Figure 59: South America Ophthalmic Tonometers Market Revenue Share (%), by Type 2024 & 2032
- Figure 60: South America Ophthalmic Tonometers Market Revenue (Million), by Country 2024 & 2032
- Figure 61: South America Ophthalmic Tonometers Market Revenue Share (%), by Country 2024 & 2032
List of Tables
- Table 1: Global Ophthalmic Tonometers Market Revenue Million Forecast, by Region 2019 & 2032
- Table 2: Global Ophthalmic Tonometers Market Revenue Million Forecast, by Technology 2019 & 2032
- Table 3: Global Ophthalmic Tonometers Market Revenue Million Forecast, by Portability Type 2019 & 2032
- Table 4: Global Ophthalmic Tonometers Market Revenue Million Forecast, by End User 2019 & 2032
- Table 5: Global Ophthalmic Tonometers Market Revenue Million Forecast, by Type 2019 & 2032
- Table 6: Global Ophthalmic Tonometers Market Revenue Million Forecast, by Region 2019 & 2032
- Table 7: Global Ophthalmic Tonometers Market Revenue Million Forecast, by Country 2019 & 2032
- Table 8: United States Ophthalmic Tonometers Market Revenue (Million) Forecast, by Application 2019 & 2032
- Table 9: Canada Ophthalmic Tonometers Market Revenue (Million) Forecast, by Application 2019 & 2032
- Table 10: Mexico Ophthalmic Tonometers Market Revenue (Million) Forecast, by Application 2019 & 2032
- Table 11: Global Ophthalmic Tonometers Market Revenue Million Forecast, by Country 2019 & 2032
- Table 12: Germany Ophthalmic Tonometers Market Revenue (Million) Forecast, by Application 2019 & 2032
- Table 13: United Kingdom Ophthalmic Tonometers Market Revenue (Million) Forecast, by Application 2019 & 2032
- Table 14: France Ophthalmic Tonometers Market Revenue (Million) Forecast, by Application 2019 & 2032
- Table 15: Italy Ophthalmic Tonometers Market Revenue (Million) Forecast, by Application 2019 & 2032
- Table 16: Spain Ophthalmic Tonometers Market Revenue (Million) Forecast, by Application 2019 & 2032
- Table 17: Rest of Europe Ophthalmic Tonometers Market Revenue (Million) Forecast, by Application 2019 & 2032
- Table 18: Global Ophthalmic Tonometers Market Revenue Million Forecast, by Country 2019 & 2032
- Table 19: China Ophthalmic Tonometers Market Revenue (Million) Forecast, by Application 2019 & 2032
- Table 20: Japan Ophthalmic Tonometers Market Revenue (Million) Forecast, by Application 2019 & 2032
- Table 21: India Ophthalmic Tonometers Market Revenue (Million) Forecast, by Application 2019 & 2032
- Table 22: Australia Ophthalmic Tonometers Market Revenue (Million) Forecast, by Application 2019 & 2032
- Table 23: South Korea Ophthalmic Tonometers Market Revenue (Million) Forecast, by Application 2019 & 2032
- Table 24: Rest of Asia Pacific Ophthalmic Tonometers Market Revenue (Million) Forecast, by Application 2019 & 2032
- Table 25: Global Ophthalmic Tonometers Market Revenue Million Forecast, by Country 2019 & 2032
- Table 26: GCC Ophthalmic Tonometers Market Revenue (Million) Forecast, by Application 2019 & 2032
- Table 27: South Africa Ophthalmic Tonometers Market Revenue (Million) Forecast, by Application 2019 & 2032
- Table 28: Rest of Middle East and Africa Ophthalmic Tonometers Market Revenue (Million) Forecast, by Application 2019 & 2032
- Table 29: Global Ophthalmic Tonometers Market Revenue Million Forecast, by Country 2019 & 2032
- Table 30: Brazil Ophthalmic Tonometers Market Revenue (Million) Forecast, by Application 2019 & 2032
- Table 31: Argentina Ophthalmic Tonometers Market Revenue (Million) Forecast, by Application 2019 & 2032
- Table 32: Rest of South America Ophthalmic Tonometers Market Revenue (Million) Forecast, by Application 2019 & 2032
- Table 33: Global Ophthalmic Tonometers Market Revenue Million Forecast, by Technology 2019 & 2032
- Table 34: Global Ophthalmic Tonometers Market Revenue Million Forecast, by Portability Type 2019 & 2032
- Table 35: Global Ophthalmic Tonometers Market Revenue Million Forecast, by End User 2019 & 2032
- Table 36: Global Ophthalmic Tonometers Market Revenue Million Forecast, by Type 2019 & 2032
- Table 37: Global Ophthalmic Tonometers Market Revenue Million Forecast, by Country 2019 & 2032
- Table 38: United States Ophthalmic Tonometers Market Revenue (Million) Forecast, by Application 2019 & 2032
- Table 39: Canada Ophthalmic Tonometers Market Revenue (Million) Forecast, by Application 2019 & 2032
- Table 40: Mexico Ophthalmic Tonometers Market Revenue (Million) Forecast, by Application 2019 & 2032
- Table 41: Global Ophthalmic Tonometers Market Revenue Million Forecast, by Technology 2019 & 2032
- Table 42: Global Ophthalmic Tonometers Market Revenue Million Forecast, by Portability Type 2019 & 2032
- Table 43: Global Ophthalmic Tonometers Market Revenue Million Forecast, by End User 2019 & 2032
- Table 44: Global Ophthalmic Tonometers Market Revenue Million Forecast, by Type 2019 & 2032
- Table 45: Global Ophthalmic Tonometers Market Revenue Million Forecast, by Country 2019 & 2032
- Table 46: Germany Ophthalmic Tonometers Market Revenue (Million) Forecast, by Application 2019 & 2032
- Table 47: United Kingdom Ophthalmic Tonometers Market Revenue (Million) Forecast, by Application 2019 & 2032
- Table 48: France Ophthalmic Tonometers Market Revenue (Million) Forecast, by Application 2019 & 2032
- Table 49: Italy Ophthalmic Tonometers Market Revenue (Million) Forecast, by Application 2019 & 2032
- Table 50: Spain Ophthalmic Tonometers Market Revenue (Million) Forecast, by Application 2019 & 2032
- Table 51: Rest of Europe Ophthalmic Tonometers Market Revenue (Million) Forecast, by Application 2019 & 2032
- Table 52: Global Ophthalmic Tonometers Market Revenue Million Forecast, by Technology 2019 & 2032
- Table 53: Global Ophthalmic Tonometers Market Revenue Million Forecast, by Portability Type 2019 & 2032
- Table 54: Global Ophthalmic Tonometers Market Revenue Million Forecast, by End User 2019 & 2032
- Table 55: Global Ophthalmic Tonometers Market Revenue Million Forecast, by Type 2019 & 2032
- Table 56: Global Ophthalmic Tonometers Market Revenue Million Forecast, by Country 2019 & 2032
- Table 57: China Ophthalmic Tonometers Market Revenue (Million) Forecast, by Application 2019 & 2032
- Table 58: Japan Ophthalmic Tonometers Market Revenue (Million) Forecast, by Application 2019 & 2032
- Table 59: India Ophthalmic Tonometers Market Revenue (Million) Forecast, by Application 2019 & 2032
- Table 60: Australia Ophthalmic Tonometers Market Revenue (Million) Forecast, by Application 2019 & 2032
- Table 61: South Korea Ophthalmic Tonometers Market Revenue (Million) Forecast, by Application 2019 & 2032
- Table 62: Rest of Asia Pacific Ophthalmic Tonometers Market Revenue (Million) Forecast, by Application 2019 & 2032
- Table 63: Global Ophthalmic Tonometers Market Revenue Million Forecast, by Technology 2019 & 2032
- Table 64: Global Ophthalmic Tonometers Market Revenue Million Forecast, by Portability Type 2019 & 2032
- Table 65: Global Ophthalmic Tonometers Market Revenue Million Forecast, by End User 2019 & 2032
- Table 66: Global Ophthalmic Tonometers Market Revenue Million Forecast, by Type 2019 & 2032
- Table 67: Global Ophthalmic Tonometers Market Revenue Million Forecast, by Country 2019 & 2032
- Table 68: GCC Ophthalmic Tonometers Market Revenue (Million) Forecast, by Application 2019 & 2032
- Table 69: South Africa Ophthalmic Tonometers Market Revenue (Million) Forecast, by Application 2019 & 2032
- Table 70: Rest of Middle East and Africa Ophthalmic Tonometers Market Revenue (Million) Forecast, by Application 2019 & 2032
- Table 71: Global Ophthalmic Tonometers Market Revenue Million Forecast, by Technology 2019 & 2032
- Table 72: Global Ophthalmic Tonometers Market Revenue Million Forecast, by Portability Type 2019 & 2032
- Table 73: Global Ophthalmic Tonometers Market Revenue Million Forecast, by End User 2019 & 2032
- Table 74: Global Ophthalmic Tonometers Market Revenue Million Forecast, by Type 2019 & 2032
- Table 75: Global Ophthalmic Tonometers Market Revenue Million Forecast, by Country 2019 & 2032
- Table 76: Brazil Ophthalmic Tonometers Market Revenue (Million) Forecast, by Application 2019 & 2032
- Table 77: Argentina Ophthalmic Tonometers Market Revenue (Million) Forecast, by Application 2019 & 2032
- Table 78: Rest of South America Ophthalmic Tonometers Market Revenue (Million) Forecast, by Application 2019 & 2032
Frequently Asked Questions
1. What is the projected Compound Annual Growth Rate (CAGR) of the Ophthalmic Tonometers Market?
The projected CAGR is approximately 5.05%.
2. Which companies are prominent players in the Ophthalmic Tonometers Market?
Key companies in the market include Metall Zug Group (Haag-Streit Group), Oculus Inc, Belrose Refracting Equipment, Carl Zeiss Meditec AG, 66 Vision Tech Co Ltd, Kowa American Corporation, Revenio Group PLC (iCare Finland OY), Topcon Corporation*List Not Exhaustive, Nidek Co Ltd, Canon Medical Systems Corporation, Rexxam Co Ltd, Tomey Corporation, AMETEK Inc (Reichert Technologies), Halma plc (Keeler Ltd ).
3. What are the main segments of the Ophthalmic Tonometers Market?
The market segments include Technology, Portability Type, End User, Type.
4. Can you provide details about the market size?
The market size is estimated to be USD 356.56 Million as of 2022.
5. What are some drivers contributing to market growth?
Increasing Incidence of Glaucoma; Increasing Geriatric and Diabetic Populations; Increasing Number of Eye Checkup Camps and Glaucoma Awareness Programs.
6. What are the notable trends driving market growth?
Applanation Tonometry Segment is Expected to Hold a Significant Share in the Market Over the Forecast Period.
7. Are there any restraints impacting market growth?
Risk of Infection with Contact Tonometers and Lack of Accuracy in Non-contact Tonometers.
8. Can you provide examples of recent developments in the market?
May 2023: Reichert Technologies launched the Tono-Vera Tonometer with ActiView Positioning System. Tono-Vera utilizes rebound tonometer technology, which eliminates the need for topical anesthetic.
9. What pricing options are available for accessing the report?
Pricing options include single-user, multi-user, and enterprise licenses priced at USD 4750, USD 5250, and USD 8750 respectively.
10. Is the market size provided in terms of value or volume?
The market size is provided in terms of value, measured in Million.
11. Are there any specific market keywords associated with the report?
Yes, the market keyword associated with the report is "Ophthalmic Tonometers Market," which aids in identifying and referencing the specific market segment covered.
12. How do I determine which pricing option suits my needs best?
The pricing options vary based on user requirements and access needs. Individual users may opt for single-user licenses, while businesses requiring broader access may choose multi-user or enterprise licenses for cost-effective access to the report.
13. Are there any additional resources or data provided in the Ophthalmic Tonometers Market report?
While the report offers comprehensive insights, it's advisable to review the specific contents or supplementary materials provided to ascertain if additional resources or data are available.
14. How can I stay updated on further developments or reports in the Ophthalmic Tonometers Market?
To stay informed about further developments, trends, and reports in the Ophthalmic Tonometers Market, consider subscribing to industry newsletters, following relevant companies and organizations, or regularly checking reputable industry news sources and publications.
Methodology
Step 1 - Identification of Relevant Samples Size from Population Database


Step 2 - Approaches for Defining Global Market Size (Value, Volume* & Price*)

Note*: In applicable scenarios
Step 3 - Data Sources
Primary Research
- Web Analytics
- Survey Reports
- Research Institute
- Latest Research Reports
- Opinion Leaders
Secondary Research
- Annual Reports
- White Paper
- Latest Press Release
- Industry Association
- Paid Database
- Investor Presentations

Step 4 - Data Triangulation
Involves using different sources of information in order to increase the validity of a study
These sources are likely to be stakeholders in a program - participants, other researchers, program staff, other community members, and so on.
Then we put all data in single framework & apply various statistical tools to find out the dynamic on the market.
During the analysis stage, feedback from the stakeholder groups would be compared to determine areas of agreement as well as areas of divergence
