

Key Insights
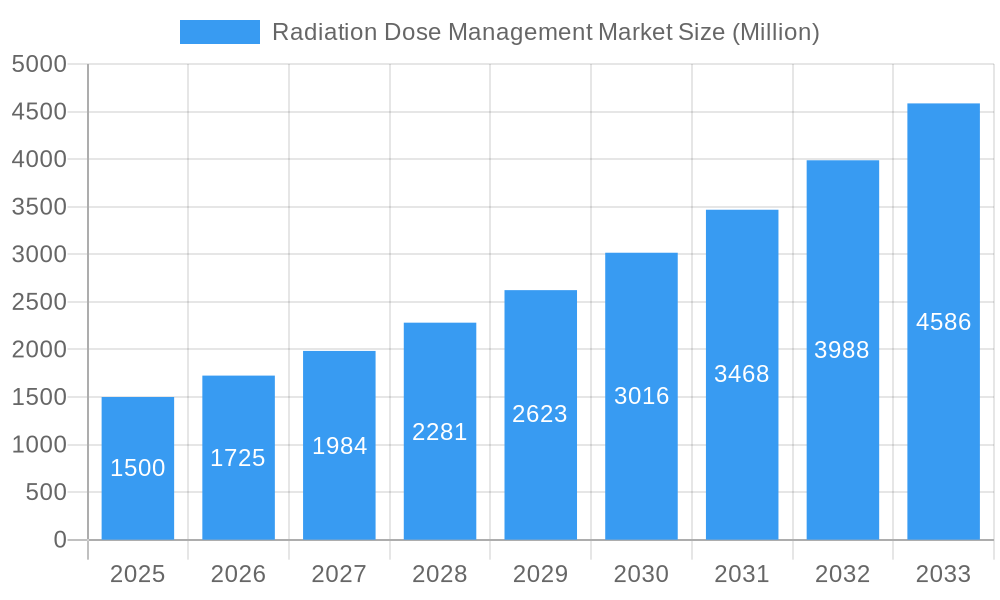
The global Radiation Dose Management Market is poised for significant expansion, projected to reach a substantial market size of approximately $1,500 million by 2025. This growth is driven by a robust Compound Annual Growth Rate (CAGR) of 15.00%, indicating a dynamic and rapidly evolving landscape. The increasing adoption of advanced imaging technologies, such as Computed Tomography (CT) and Interventional Imaging, coupled with a heightened awareness of radiation safety among healthcare providers and regulatory bodies, are primary catalysts for this surge. Furthermore, the growing prevalence of chronic diseases necessitates more frequent diagnostic imaging procedures, thereby escalating the demand for effective radiation dose management solutions. The market is witnessing a shift towards integrated solutions that seamlessly incorporate dose monitoring and optimization into existing Picture Archiving and Communication Systems (PACS) and Electronic Health Records (EHRs), offering enhanced workflow efficiency and improved patient outcomes.
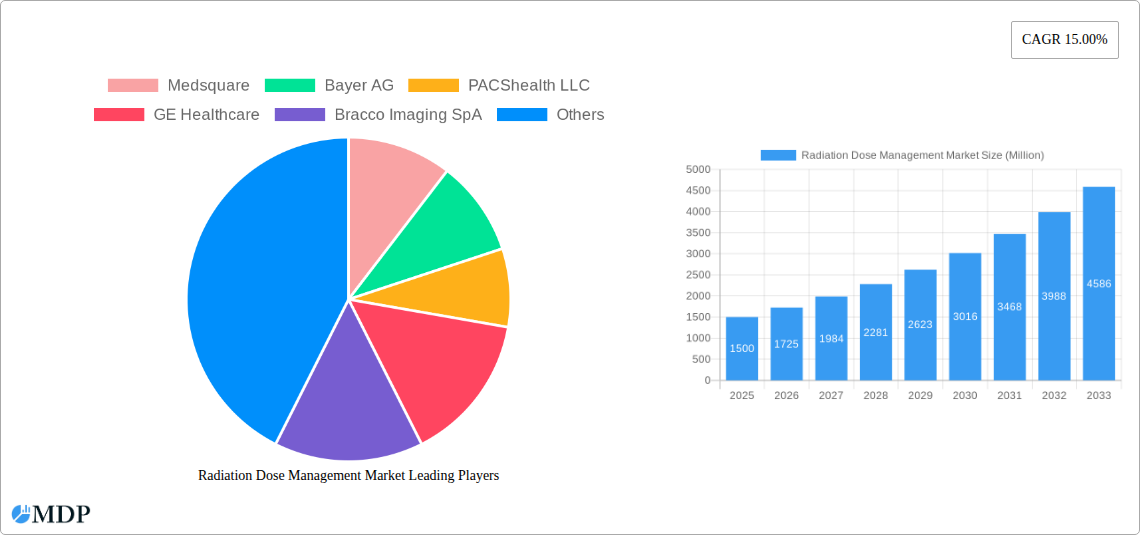
Radiation Dose Management Market Market Size (In Billion)
The market's expansion is further fueled by the increasing demand for standalone solutions, particularly in ambulatory care settings and smaller healthcare facilities that require specialized tools for radiation dose monitoring. Key trends include the development of AI-powered algorithms for real-time dose analysis and predictive modeling, alongside the growing implementation of standardized radiation dose reporting frameworks. While the market exhibits strong growth potential, certain restraints, such as the initial cost of implementation for advanced systems and the need for specialized training, may pose challenges. However, the long-term benefits of reduced radiation exposure, enhanced patient safety, and optimized resource utilization are expected to outweigh these hurdles. Key players like GE Healthcare, Philips, and Bayer AG are actively investing in research and development to offer innovative and comprehensive radiation dose management solutions, further shaping the market's trajectory across various regions, with North America and Europe currently leading in adoption.
Radiation Dose Management Market Company Market Share
Unlock the Future of Patient Safety: Comprehensive Radiation Dose Management Market Report 2025-2033
Gain a definitive edge in the rapidly evolving Radiation Dose Management Market with this in-depth, SEO-optimized report. Covering the crucial period from 2019 to 2033, with a base year of 2025, this report provides unparalleled insights into market dynamics, industry trends, leading segments, and key players. Whether you're a healthcare provider, technology innovator, investor, or regulatory body, understand the critical factors shaping patient safety and operational efficiency in medical imaging. Discover actionable strategies to navigate the complexities of radiation dose reduction, compliance, and advanced imaging technologies. This report is your indispensable guide to capitalizing on the growing demand for effective radiation dose management solutions, projecting a market size to exceed XXX Million by 2033.
Radiation Dose Management Market Market Dynamics & Concentration
The Radiation Dose Management Market is characterized by a moderate concentration, driven by continuous innovation in imaging technologies and an increasingly stringent regulatory landscape. Key market drivers include the rising awareness of the long-term health effects of radiation exposure, necessitating robust dose monitoring and control. Regulatory frameworks, such as those established by the FDA and EMA, are becoming more prescriptive, mandating compliance and driving the adoption of advanced RDM solutions. Product substitutes, while limited for core RDM functionalities, exist in the form of enhanced imaging protocols and physician training. End-user trends highlight a growing demand for integrated solutions that seamlessly incorporate dose management into existing PACS and EMR systems. Mergers and acquisitions (M&A) activity in the sector, with an estimated XX M&A deals in the historical period (2019-2024), are indicative of consolidation and strategic expansion by key players seeking to broaden their product portfolios and market reach. Companies are actively investing in R&D to develop AI-powered solutions for real-time dose optimization and predictive analytics, further intensifying competition.
Radiation Dose Management Market Industry Trends & Analysis
The Radiation Dose Management Market is poised for significant growth, driven by a confluence of technological advancements, evolving clinical practices, and a global emphasis on patient safety. The increasing prevalence of medical imaging procedures, particularly in diagnostic and interventional radiology, directly fuels the demand for effective dose management tools. Technological disruptions are at the forefront, with the integration of Artificial Intelligence (AI) and Machine Learning (ML) revolutionizing dose monitoring and optimization. These technologies enable real-time dose tracking, predictive modeling for patient-specific radiation protocols, and automated quality assurance, thereby enhancing accuracy and efficiency. Consumer preferences are shifting towards solutions that offer comprehensive dose reporting, compliance tracking, and seamless integration with existing Picture Archiving and Communication Systems (PACS) and Electronic Medical Records (EMR). The competitive landscape is intensifying, with established players and emerging innovators vying for market share through product differentiation, strategic partnerships, and aggressive marketing. The market penetration of advanced RDM solutions is steadily increasing, as healthcare institutions recognize the long-term cost benefits associated with reduced radiation exposure and improved patient outcomes. The projected Compound Annual Growth Rate (CAGR) for the Radiation Dose Management Market is estimated at XX% from 2025 to 2033, underscoring its robust expansion trajectory. The market is also witnessing a trend towards cloud-based RDM solutions, offering enhanced scalability, accessibility, and data security. Furthermore, the growing adoption of advanced imaging modalities, such as dual-energy CT and photon-counting detectors, necessitates sophisticated dose management strategies to harness their diagnostic potential while minimizing radiation exposure. The global increase in the aging population and the corresponding rise in chronic diseases contribute to the higher demand for diagnostic imaging, further propelling the RDM market forward.
Leading Markets & Segments in Radiation Dose Management Market
The Hospital segment is the dominant end-user in the Radiation Dose Management Market, driven by the high volume of imaging procedures performed and the stringent regulatory compliance requirements within these institutions. Hospitals are investing heavily in integrated solutions that provide comprehensive dose tracking, reporting, and optimization across various imaging modalities.
Products & Services:
- Integrated Solutions: These solutions, offering seamless integration with PACS and EMR systems, are experiencing the fastest growth due to their ability to streamline workflows and provide holistic patient dose information. Key drivers include the need for centralized dose data management and automated reporting for regulatory compliance.
- Standalone Solutions: While still significant, standalone solutions are facing increasing competition from integrated platforms. Their adoption is often driven by specific departmental needs or budget constraints.
Modality:
- Computed Tomography (CT): CT scanners are major contributors to radiation dose, making CT the largest segment for RDM solutions. The increasing use of advanced CT applications, such as cardiac CT and spectral CT, necessitates sophisticated dose management tools.
- Fluoroscopy and Interventional Imaging: This segment is a critical area for RDM due to the prolonged radiation exposure during procedures like angiography and interventions. Growing demand for minimally invasive procedures fuels the growth here.
- Radiography and Mammography: While generally lower doses per procedure, the sheer volume of these examinations makes them significant contributors to cumulative patient dose. Advanced dose reduction techniques and monitoring are crucial.
- Nuclear Medicine: Although employing different types of radiation, dose management in nuclear medicine focuses on radiopharmaceutical uptake and clearance, requiring specialized tracking and monitoring.
End User:
- Hospital: As mentioned, hospitals are the primary market due to their comprehensive imaging infrastructure and patient volume. Economic policies supporting healthcare infrastructure development and technological adoption within hospitals are key drivers.
- Ambulatory Care Settings: With the rise of outpatient imaging centers, this segment is showing considerable growth. Increased accessibility to imaging services and cost-effectiveness are key factors.
- Other End Users: This includes research institutions and specialized clinics, contributing to market growth through the adoption of advanced RDM for clinical trials and specialized diagnostics.
Leading Region: North America currently dominates the Radiation Dose Management Market, attributed to early adoption of advanced imaging technologies, a well-established regulatory framework, and significant healthcare expenditure. The region's strong focus on patient safety and data-driven healthcare practices further bolsters market leadership.
Radiation Dose Management Market Product Developments
Product developments in the Radiation Dose Management Market are characterized by an increasing emphasis on AI-driven analytics, real-time dose monitoring, and seamless integration into clinical workflows. Innovations are focused on providing physicians with intuitive interfaces that offer immediate feedback on radiation doses during procedures. This allows for proactive adjustments and adherence to ALARA (As Low As Reasonably Achievable) principles. Furthermore, enhanced reporting capabilities for regulatory compliance and retrospective dose analysis are key competitive advantages being developed. The trend is towards intelligent software solutions that learn from historical data to optimize future protocols, thereby improving diagnostic image quality while minimizing patient radiation exposure.
Key Drivers of Radiation Dose Management Market Growth
Several key factors are driving the growth of the Radiation Dose Management Market.
- Technological Advancements: The continuous evolution of imaging modalities, such as CT and interventional X-ray systems, with higher capabilities but also potential for increased radiation dose, necessitates advanced RDM solutions. The integration of AI and ML in RDM software offers predictive analytics and real-time dose optimization.
- Regulatory Mandates: Stringent regulations from bodies like the FDA and international health organizations are compelling healthcare providers to implement robust radiation dose monitoring and reporting systems. Compliance requirements are a significant catalyst for market adoption.
- Growing Awareness of Radiation Risks: Increased understanding of the long-term health implications of cumulative radiation exposure is driving demand for effective dose management strategies to ensure patient safety.
- Increasing Volume of Medical Imaging Procedures: The growing global demand for diagnostic and interventional imaging procedures, driven by an aging population and the prevalence of chronic diseases, directly fuels the need for comprehensive RDM solutions.
Challenges in the Radiation Dose Management Market Market
Despite its growth, the Radiation Dose Management Market faces several challenges.
- High Implementation Costs: The initial investment required for advanced RDM software, hardware integration, and staff training can be a significant barrier for smaller healthcare facilities.
- Interoperability Issues: Integrating RDM solutions with diverse and often legacy PACS and EMR systems across different healthcare providers can be complex and time-consuming.
- Lack of Standardization: The absence of universal standards for dose reporting and data exchange can hinder seamless data aggregation and analysis across multiple institutions.
- Physician Resistance to Change: Some healthcare professionals may be resistant to adopting new workflows and technologies, requiring extensive education and demonstration of benefits.
- Reimbursement Policies: Inadequate reimbursement for RDM-related services can impact the financial viability for healthcare providers to invest in these solutions.
Emerging Opportunities in Radiation Dose Management Market
Emerging opportunities in the Radiation Dose Management Market are primarily driven by technological innovation and strategic market expansion. The development and widespread adoption of AI-powered RDM systems that offer predictive analytics and personalized dose optimization present a significant growth catalyst. Strategic partnerships between RDM software providers and medical imaging equipment manufacturers are creating integrated solutions that address dose management from device inception to data analysis. Furthermore, the expanding healthcare infrastructure in emerging economies and the increasing focus on patient safety in these regions offer substantial market expansion opportunities for RDM providers. The growing trend towards value-based healthcare is also likely to drive demand for RDM solutions that demonstrably improve patient outcomes and reduce healthcare costs.
Leading Players in the Radiation Dose Management Market Sector
- Medsquare
- Bayer AG
- PACShealth LLC
- GE Healthcare
- Bracco Imaging SpA
- Koninklijke Philips N V
- Qaelum NV
- Sectra AB
- Novarad Corporation
- Fujifilm Holdings Corporation
Key Milestones in Radiation Dose Management Market Industry
- 2019: Increased regulatory scrutiny on radiation dose reduction mandates from key health organizations globally.
- 2020: Advent of AI-powered algorithms for predictive dose optimization in CT imaging.
- 2021: Major advancements in integrated RDM solutions offering seamless PACS/EMR compatibility.
- 2022: Expansion of cloud-based RDM platforms, enhancing scalability and accessibility for healthcare institutions.
- 2023: Growing focus on personalized radiation dose management strategies based on patient-specific factors.
- 2024: Increased R&D investment in AI for real-time dose monitoring and quality assurance in interventional radiology.
Strategic Outlook for Radiation Dose Management Market Market
The strategic outlook for the Radiation Dose Management Market is exceptionally robust, fueled by ongoing technological innovation and a persistent global emphasis on patient safety and regulatory compliance. The increasing integration of AI and machine learning is set to revolutionize dose management, enabling highly personalized and predictive protocols. Strategic partnerships between imaging equipment manufacturers and software developers will continue to drive the creation of comprehensive, end-to-end solutions. The expanding adoption of advanced imaging techniques across developing economies presents a significant growth accelerator, alongside the consistent demand from mature markets. Healthcare providers will increasingly prioritize RDM solutions that offer demonstrable improvements in patient outcomes, operational efficiency, and cost reduction, solidifying its position as a critical component of modern medical imaging.
Radiation Dose Management Market Segmentation
-
1. Products & Services
- 1.1. Standalone Solutions
- 1.2. Integrated Solutions
-
2. Modality
- 2.1. Computed Tomography
- 2.2. Fluoroscopy and Interventional Imaging
- 2.3. Nuclear Medicine
- 2.4. Radiography and Mammography
-
3. End User
- 3.1. Ambulatory Care Settings
- 3.2. Hospital
- 3.3. Other End Users
Radiation Dose Management Market Segmentation By Geography
-
1. North America
- 1.1. United States
- 1.2. Canada
- 1.3. Mexico
-
2. Europe
- 2.1. Germany
- 2.2. United Kingdom
- 2.3. France
- 2.4. Italy
- 2.5. Spain
- 2.6. Rest of Europe
-
3. Asia Pacific
- 3.1. China
- 3.2. Japan
- 3.3. India
- 3.4. Australia
- 3.5. South Korea
- 3.6. Rest of Asia Pacific
-
4. Middle East and Africa
- 4.1. GCC
- 4.2. South Africa
- 4.3. Rest of Middle East and Africa
-
5. South America
- 5.1. Brazil
- 5.2. Argentina
- 5.3. Rest of South America
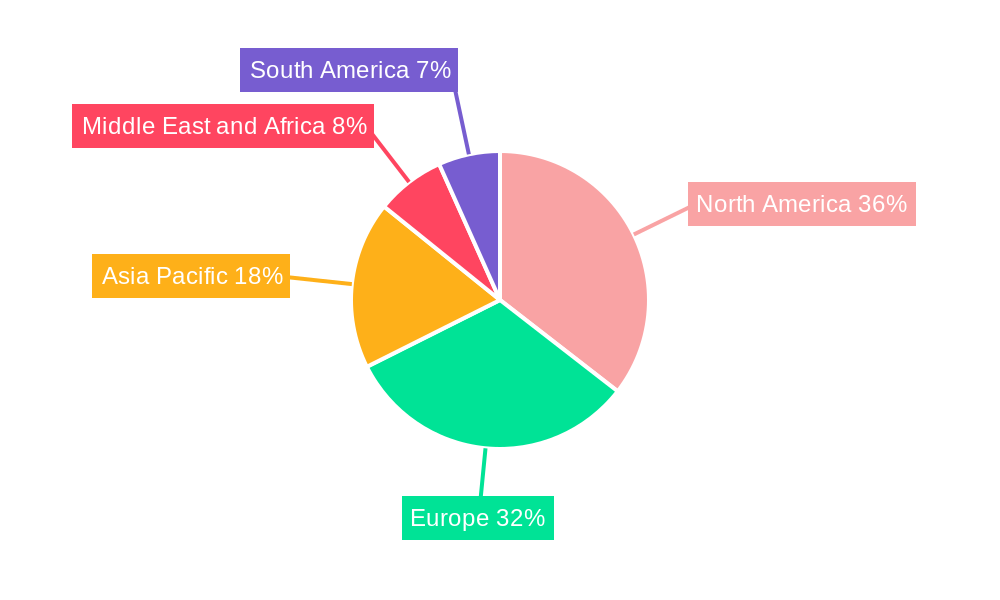
Radiation Dose Management Market Regional Market Share
Geographic Coverage of Radiation Dose Management Market
Radiation Dose Management Market REPORT HIGHLIGHTS
| Aspects | Details |
|---|---|
| Study Period | 2020-2034 |
| Base Year | 2025 |
| Estimated Year | 2026 |
| Forecast Period | 2026-2034 |
| Historical Period | 2020-2025 |
| Growth Rate | CAGR of 15.1% from 2020-2034 |
| Segmentation |
|
Table of Contents
- 1. Introduction
- 1.1. Research Scope
- 1.2. Market Segmentation
- 1.3. Research Objective
- 1.4. Definitions and Assumptions
- 2. Executive Summary
- 2.1. Market Snapshot
- 3. Market Dynamics
- 3.1. Market Drivers
- 3.2. Market Restrains
- 3.3. Market Trends
- 3.4. Market Opportunities
- 4. Market Factor Analysis
- 4.1. Porters Five Forces
- 4.1.1. Bargaining Power of Suppliers
- 4.1.2. Bargaining Power of Buyers
- 4.1.3. Threat of New Entrants
- 4.1.4. Threat of Substitutes
- 4.1.5. Competitive Rivalry
- 4.2. PESTEL analysis
- 4.3. BCG Analysis
- 4.3.1. Stars (High Growth, High Market Share)
- 4.3.2. Cash Cows (Low Growth, High Market Share)
- 4.3.3. Question Mark (High Growth, Low Market Share)
- 4.3.4. Dogs (Low Growth, Low Market Share)
- 4.4. Ansoff Matrix Analysis
- 4.5. Supply Chain Analysis
- 4.6. Regulatory Landscape
- 4.7. Current Market Potential and Opportunity Assessment (TAM–SAM–SOM Framework)
- 4.8. MDP Analyst Note
- 4.1. Porters Five Forces
- 5. Market Analysis, Insights and Forecast 2021-2033
- 5.1. Market Analysis, Insights and Forecast - by Products & Services
- 5.1.1. Standalone Solutions
- 5.1.2. Integrated Solutions
- 5.2. Market Analysis, Insights and Forecast - by Modality
- 5.2.1. Computed Tomography
- 5.2.2. Fluoroscopy and Interventional Imaging
- 5.2.3. Nuclear Medicine
- 5.2.4. Radiography and Mammography
- 5.3. Market Analysis, Insights and Forecast - by End User
- 5.3.1. Ambulatory Care Settings
- 5.3.2. Hospital
- 5.3.3. Other End Users
- 5.4. Market Analysis, Insights and Forecast - by Region
- 5.4.1. North America
- 5.4.2. Europe
- 5.4.3. Asia Pacific
- 5.4.4. Middle East and Africa
- 5.4.5. South America
- 5.1. Market Analysis, Insights and Forecast - by Products & Services
- 6. Global Radiation Dose Management Market Analysis, Insights and Forecast, 2021-2033
- 6.1. Market Analysis, Insights and Forecast - by Products & Services
- 6.1.1. Standalone Solutions
- 6.1.2. Integrated Solutions
- 6.2. Market Analysis, Insights and Forecast - by Modality
- 6.2.1. Computed Tomography
- 6.2.2. Fluoroscopy and Interventional Imaging
- 6.2.3. Nuclear Medicine
- 6.2.4. Radiography and Mammography
- 6.3. Market Analysis, Insights and Forecast - by End User
- 6.3.1. Ambulatory Care Settings
- 6.3.2. Hospital
- 6.3.3. Other End Users
- 6.1. Market Analysis, Insights and Forecast - by Products & Services
- 7. North America Radiation Dose Management Market Analysis, Insights and Forecast, 2020-2032
- 7.1. Market Analysis, Insights and Forecast - by Products & Services
- 7.1.1. Standalone Solutions
- 7.1.2. Integrated Solutions
- 7.2. Market Analysis, Insights and Forecast - by Modality
- 7.2.1. Computed Tomography
- 7.2.2. Fluoroscopy and Interventional Imaging
- 7.2.3. Nuclear Medicine
- 7.2.4. Radiography and Mammography
- 7.3. Market Analysis, Insights and Forecast - by End User
- 7.3.1. Ambulatory Care Settings
- 7.3.2. Hospital
- 7.3.3. Other End Users
- 7.1. Market Analysis, Insights and Forecast - by Products & Services
- 8. Europe Radiation Dose Management Market Analysis, Insights and Forecast, 2020-2032
- 8.1. Market Analysis, Insights and Forecast - by Products & Services
- 8.1.1. Standalone Solutions
- 8.1.2. Integrated Solutions
- 8.2. Market Analysis, Insights and Forecast - by Modality
- 8.2.1. Computed Tomography
- 8.2.2. Fluoroscopy and Interventional Imaging
- 8.2.3. Nuclear Medicine
- 8.2.4. Radiography and Mammography
- 8.3. Market Analysis, Insights and Forecast - by End User
- 8.3.1. Ambulatory Care Settings
- 8.3.2. Hospital
- 8.3.3. Other End Users
- 8.1. Market Analysis, Insights and Forecast - by Products & Services
- 9. Asia Pacific Radiation Dose Management Market Analysis, Insights and Forecast, 2020-2032
- 9.1. Market Analysis, Insights and Forecast - by Products & Services
- 9.1.1. Standalone Solutions
- 9.1.2. Integrated Solutions
- 9.2. Market Analysis, Insights and Forecast - by Modality
- 9.2.1. Computed Tomography
- 9.2.2. Fluoroscopy and Interventional Imaging
- 9.2.3. Nuclear Medicine
- 9.2.4. Radiography and Mammography
- 9.3. Market Analysis, Insights and Forecast - by End User
- 9.3.1. Ambulatory Care Settings
- 9.3.2. Hospital
- 9.3.3. Other End Users
- 9.1. Market Analysis, Insights and Forecast - by Products & Services
- 10. Middle East and Africa Radiation Dose Management Market Analysis, Insights and Forecast, 2020-2032
- 10.1. Market Analysis, Insights and Forecast - by Products & Services
- 10.1.1. Standalone Solutions
- 10.1.2. Integrated Solutions
- 10.2. Market Analysis, Insights and Forecast - by Modality
- 10.2.1. Computed Tomography
- 10.2.2. Fluoroscopy and Interventional Imaging
- 10.2.3. Nuclear Medicine
- 10.2.4. Radiography and Mammography
- 10.3. Market Analysis, Insights and Forecast - by End User
- 10.3.1. Ambulatory Care Settings
- 10.3.2. Hospital
- 10.3.3. Other End Users
- 10.1. Market Analysis, Insights and Forecast - by Products & Services
- 11. South America Radiation Dose Management Market Analysis, Insights and Forecast, 2020-2032
- 11.1. Market Analysis, Insights and Forecast - by Products & Services
- 11.1.1. Standalone Solutions
- 11.1.2. Integrated Solutions
- 11.2. Market Analysis, Insights and Forecast - by Modality
- 11.2.1. Computed Tomography
- 11.2.2. Fluoroscopy and Interventional Imaging
- 11.2.3. Nuclear Medicine
- 11.2.4. Radiography and Mammography
- 11.3. Market Analysis, Insights and Forecast - by End User
- 11.3.1. Ambulatory Care Settings
- 11.3.2. Hospital
- 11.3.3. Other End Users
- 11.1. Market Analysis, Insights and Forecast - by Products & Services
- 12. Competitive Analysis
- 12.1. Company Profiles
- 12.1.1 Medsquare
- 12.1.1.1. Company Overview
- 12.1.1.2. Products
- 12.1.1.3. Company Financials
- 12.1.1.4. SWOT Analysis
- 12.1.2 Bayer AG
- 12.1.2.1. Company Overview
- 12.1.2.2. Products
- 12.1.2.3. Company Financials
- 12.1.2.4. SWOT Analysis
- 12.1.3 PACShealth LLC
- 12.1.3.1. Company Overview
- 12.1.3.2. Products
- 12.1.3.3. Company Financials
- 12.1.3.4. SWOT Analysis
- 12.1.4 GE Healthcare
- 12.1.4.1. Company Overview
- 12.1.4.2. Products
- 12.1.4.3. Company Financials
- 12.1.4.4. SWOT Analysis
- 12.1.5 Bracco Imaging SpA
- 12.1.5.1. Company Overview
- 12.1.5.2. Products
- 12.1.5.3. Company Financials
- 12.1.5.4. SWOT Analysis
- 12.1.6 Koninklijke Philips N V
- 12.1.6.1. Company Overview
- 12.1.6.2. Products
- 12.1.6.3. Company Financials
- 12.1.6.4. SWOT Analysis
- 12.1.7 Qaelum NV
- 12.1.7.1. Company Overview
- 12.1.7.2. Products
- 12.1.7.3. Company Financials
- 12.1.7.4. SWOT Analysis
- 12.1.8 Sectra AB*List Not Exhaustive
- 12.1.8.1. Company Overview
- 12.1.8.2. Products
- 12.1.8.3. Company Financials
- 12.1.8.4. SWOT Analysis
- 12.1.9 Novarad Corporation
- 12.1.9.1. Company Overview
- 12.1.9.2. Products
- 12.1.9.3. Company Financials
- 12.1.9.4. SWOT Analysis
- 12.1.10 Fujifilm Holdings Corporation
- 12.1.10.1. Company Overview
- 12.1.10.2. Products
- 12.1.10.3. Company Financials
- 12.1.10.4. SWOT Analysis
- 12.1.1 Medsquare
- 12.2. Market Entropy
- 12.2.1 Company's Key Areas Served
- 12.2.2 Recent Developments
- 12.3. Company Market Share Analysis 2025
- 12.3.1 Top 5 Companies Market Share Analysis
- 12.3.2 Top 3 Companies Market Share Analysis
- 12.4. List of Potential Customers
- 13. Research Methodology
List of Figures
- Figure 1: Global Radiation Dose Management Market Revenue Breakdown (million, %) by Region 2025 & 2033
- Figure 2: North America Radiation Dose Management Market Revenue (million), by Products & Services 2025 & 2033
- Figure 3: North America Radiation Dose Management Market Revenue Share (%), by Products & Services 2025 & 2033
- Figure 4: North America Radiation Dose Management Market Revenue (million), by Modality 2025 & 2033
- Figure 5: North America Radiation Dose Management Market Revenue Share (%), by Modality 2025 & 2033
- Figure 6: North America Radiation Dose Management Market Revenue (million), by End User 2025 & 2033
- Figure 7: North America Radiation Dose Management Market Revenue Share (%), by End User 2025 & 2033
- Figure 8: North America Radiation Dose Management Market Revenue (million), by Country 2025 & 2033
- Figure 9: North America Radiation Dose Management Market Revenue Share (%), by Country 2025 & 2033
- Figure 10: Europe Radiation Dose Management Market Revenue (million), by Products & Services 2025 & 2033
- Figure 11: Europe Radiation Dose Management Market Revenue Share (%), by Products & Services 2025 & 2033
- Figure 12: Europe Radiation Dose Management Market Revenue (million), by Modality 2025 & 2033
- Figure 13: Europe Radiation Dose Management Market Revenue Share (%), by Modality 2025 & 2033
- Figure 14: Europe Radiation Dose Management Market Revenue (million), by End User 2025 & 2033
- Figure 15: Europe Radiation Dose Management Market Revenue Share (%), by End User 2025 & 2033
- Figure 16: Europe Radiation Dose Management Market Revenue (million), by Country 2025 & 2033
- Figure 17: Europe Radiation Dose Management Market Revenue Share (%), by Country 2025 & 2033
- Figure 18: Asia Pacific Radiation Dose Management Market Revenue (million), by Products & Services 2025 & 2033
- Figure 19: Asia Pacific Radiation Dose Management Market Revenue Share (%), by Products & Services 2025 & 2033
- Figure 20: Asia Pacific Radiation Dose Management Market Revenue (million), by Modality 2025 & 2033
- Figure 21: Asia Pacific Radiation Dose Management Market Revenue Share (%), by Modality 2025 & 2033
- Figure 22: Asia Pacific Radiation Dose Management Market Revenue (million), by End User 2025 & 2033
- Figure 23: Asia Pacific Radiation Dose Management Market Revenue Share (%), by End User 2025 & 2033
- Figure 24: Asia Pacific Radiation Dose Management Market Revenue (million), by Country 2025 & 2033
- Figure 25: Asia Pacific Radiation Dose Management Market Revenue Share (%), by Country 2025 & 2033
- Figure 26: Middle East and Africa Radiation Dose Management Market Revenue (million), by Products & Services 2025 & 2033
- Figure 27: Middle East and Africa Radiation Dose Management Market Revenue Share (%), by Products & Services 2025 & 2033
- Figure 28: Middle East and Africa Radiation Dose Management Market Revenue (million), by Modality 2025 & 2033
- Figure 29: Middle East and Africa Radiation Dose Management Market Revenue Share (%), by Modality 2025 & 2033
- Figure 30: Middle East and Africa Radiation Dose Management Market Revenue (million), by End User 2025 & 2033
- Figure 31: Middle East and Africa Radiation Dose Management Market Revenue Share (%), by End User 2025 & 2033
- Figure 32: Middle East and Africa Radiation Dose Management Market Revenue (million), by Country 2025 & 2033
- Figure 33: Middle East and Africa Radiation Dose Management Market Revenue Share (%), by Country 2025 & 2033
- Figure 34: South America Radiation Dose Management Market Revenue (million), by Products & Services 2025 & 2033
- Figure 35: South America Radiation Dose Management Market Revenue Share (%), by Products & Services 2025 & 2033
- Figure 36: South America Radiation Dose Management Market Revenue (million), by Modality 2025 & 2033
- Figure 37: South America Radiation Dose Management Market Revenue Share (%), by Modality 2025 & 2033
- Figure 38: South America Radiation Dose Management Market Revenue (million), by End User 2025 & 2033
- Figure 39: South America Radiation Dose Management Market Revenue Share (%), by End User 2025 & 2033
- Figure 40: South America Radiation Dose Management Market Revenue (million), by Country 2025 & 2033
- Figure 41: South America Radiation Dose Management Market Revenue Share (%), by Country 2025 & 2033
List of Tables
- Table 1: Global Radiation Dose Management Market Revenue million Forecast, by Products & Services 2020 & 2033
- Table 2: Global Radiation Dose Management Market Revenue million Forecast, by Modality 2020 & 2033
- Table 3: Global Radiation Dose Management Market Revenue million Forecast, by End User 2020 & 2033
- Table 4: Global Radiation Dose Management Market Revenue million Forecast, by Region 2020 & 2033
- Table 5: Global Radiation Dose Management Market Revenue million Forecast, by Products & Services 2020 & 2033
- Table 6: Global Radiation Dose Management Market Revenue million Forecast, by Modality 2020 & 2033
- Table 7: Global Radiation Dose Management Market Revenue million Forecast, by End User 2020 & 2033
- Table 8: Global Radiation Dose Management Market Revenue million Forecast, by Country 2020 & 2033
- Table 9: United States Radiation Dose Management Market Revenue (million) Forecast, by Application 2020 & 2033
- Table 10: Canada Radiation Dose Management Market Revenue (million) Forecast, by Application 2020 & 2033
- Table 11: Mexico Radiation Dose Management Market Revenue (million) Forecast, by Application 2020 & 2033
- Table 12: Global Radiation Dose Management Market Revenue million Forecast, by Products & Services 2020 & 2033
- Table 13: Global Radiation Dose Management Market Revenue million Forecast, by Modality 2020 & 2033
- Table 14: Global Radiation Dose Management Market Revenue million Forecast, by End User 2020 & 2033
- Table 15: Global Radiation Dose Management Market Revenue million Forecast, by Country 2020 & 2033
- Table 16: Germany Radiation Dose Management Market Revenue (million) Forecast, by Application 2020 & 2033
- Table 17: United Kingdom Radiation Dose Management Market Revenue (million) Forecast, by Application 2020 & 2033
- Table 18: France Radiation Dose Management Market Revenue (million) Forecast, by Application 2020 & 2033
- Table 19: Italy Radiation Dose Management Market Revenue (million) Forecast, by Application 2020 & 2033
- Table 20: Spain Radiation Dose Management Market Revenue (million) Forecast, by Application 2020 & 2033
- Table 21: Rest of Europe Radiation Dose Management Market Revenue (million) Forecast, by Application 2020 & 2033
- Table 22: Global Radiation Dose Management Market Revenue million Forecast, by Products & Services 2020 & 2033
- Table 23: Global Radiation Dose Management Market Revenue million Forecast, by Modality 2020 & 2033
- Table 24: Global Radiation Dose Management Market Revenue million Forecast, by End User 2020 & 2033
- Table 25: Global Radiation Dose Management Market Revenue million Forecast, by Country 2020 & 2033
- Table 26: China Radiation Dose Management Market Revenue (million) Forecast, by Application 2020 & 2033
- Table 27: Japan Radiation Dose Management Market Revenue (million) Forecast, by Application 2020 & 2033
- Table 28: India Radiation Dose Management Market Revenue (million) Forecast, by Application 2020 & 2033
- Table 29: Australia Radiation Dose Management Market Revenue (million) Forecast, by Application 2020 & 2033
- Table 30: South Korea Radiation Dose Management Market Revenue (million) Forecast, by Application 2020 & 2033
- Table 31: Rest of Asia Pacific Radiation Dose Management Market Revenue (million) Forecast, by Application 2020 & 2033
- Table 32: Global Radiation Dose Management Market Revenue million Forecast, by Products & Services 2020 & 2033
- Table 33: Global Radiation Dose Management Market Revenue million Forecast, by Modality 2020 & 2033
- Table 34: Global Radiation Dose Management Market Revenue million Forecast, by End User 2020 & 2033
- Table 35: Global Radiation Dose Management Market Revenue million Forecast, by Country 2020 & 2033
- Table 36: GCC Radiation Dose Management Market Revenue (million) Forecast, by Application 2020 & 2033
- Table 37: South Africa Radiation Dose Management Market Revenue (million) Forecast, by Application 2020 & 2033
- Table 38: Rest of Middle East and Africa Radiation Dose Management Market Revenue (million) Forecast, by Application 2020 & 2033
- Table 39: Global Radiation Dose Management Market Revenue million Forecast, by Products & Services 2020 & 2033
- Table 40: Global Radiation Dose Management Market Revenue million Forecast, by Modality 2020 & 2033
- Table 41: Global Radiation Dose Management Market Revenue million Forecast, by End User 2020 & 2033
- Table 42: Global Radiation Dose Management Market Revenue million Forecast, by Country 2020 & 2033
- Table 43: Brazil Radiation Dose Management Market Revenue (million) Forecast, by Application 2020 & 2033
- Table 44: Argentina Radiation Dose Management Market Revenue (million) Forecast, by Application 2020 & 2033
- Table 45: Rest of South America Radiation Dose Management Market Revenue (million) Forecast, by Application 2020 & 2033
Frequently Asked Questions
1. What is the projected Compound Annual Growth Rate (CAGR) of the Radiation Dose Management Market?
The projected CAGR is approximately 15.1%.
2. Which companies are prominent players in the Radiation Dose Management Market?
Key companies in the market include Medsquare, Bayer AG, PACShealth LLC, GE Healthcare, Bracco Imaging SpA, Koninklijke Philips N V, Qaelum NV, Sectra AB*List Not Exhaustive, Novarad Corporation, Fujifilm Holdings Corporation.
3. What are the main segments of the Radiation Dose Management Market?
The market segments include Products & Services, Modality, End User.
4. Can you provide details about the market size?
The market size is estimated to be USD 854.2 million as of 2022.
5. What are some drivers contributing to market growth?
; Rising Cases of Chronic Diseases Demanding Radiation Therapy; Increasing Concerns over Radiation Overexposure; Rising Awareness and Industry Initiatives for Radiation Dose Management.
6. What are the notable trends driving market growth?
Computed Tomography is Expected to Register Highest CAGR in the Modality Segment.
7. Are there any restraints impacting market growth?
; Low Adoption of radiation Dose Management Solutions in Emerging Countries.
8. Can you provide examples of recent developments in the market?
N/A
9. What pricing options are available for accessing the report?
Pricing options include single-user, multi-user, and enterprise licenses priced at USD 4750, USD 5250, and USD 8750 respectively.
10. Is the market size provided in terms of value or volume?
The market size is provided in terms of value, measured in million.
11. Are there any specific market keywords associated with the report?
Yes, the market keyword associated with the report is "Radiation Dose Management Market," which aids in identifying and referencing the specific market segment covered.
12. How do I determine which pricing option suits my needs best?
The pricing options vary based on user requirements and access needs. Individual users may opt for single-user licenses, while businesses requiring broader access may choose multi-user or enterprise licenses for cost-effective access to the report.
13. Are there any additional resources or data provided in the Radiation Dose Management Market report?
While the report offers comprehensive insights, it's advisable to review the specific contents or supplementary materials provided to ascertain if additional resources or data are available.
14. How can I stay updated on further developments or reports in the Radiation Dose Management Market?
To stay informed about further developments, trends, and reports in the Radiation Dose Management Market, consider subscribing to industry newsletters, following relevant companies and organizations, or regularly checking reputable industry news sources and publications.
Methodology
Step 1 - Identification of Relevant Samples Size from Population Database


Step 2 - Approaches for Defining Global Market Size (Value, Volume* & Price*)

Note*: In applicable scenarios
Step 3 - Data Sources
Primary Research
- Web Analytics
- Survey Reports
- Research Institute
- Latest Research Reports
- Opinion Leaders
Secondary Research
- Annual Reports
- White Paper
- Latest Press Release
- Industry Association
- Paid Database
- Investor Presentations

Step 4 - Data Triangulation
Involves using different sources of information in order to increase the validity of a study
These sources are likely to be stakeholders in a program - participants, other researchers, program staff, other community members, and so on.
Then we put all data in single framework & apply various statistical tools to find out the dynamic on the market.
During the analysis stage, feedback from the stakeholder groups would be compared to determine areas of agreement as well as areas of divergence