

Key Insights
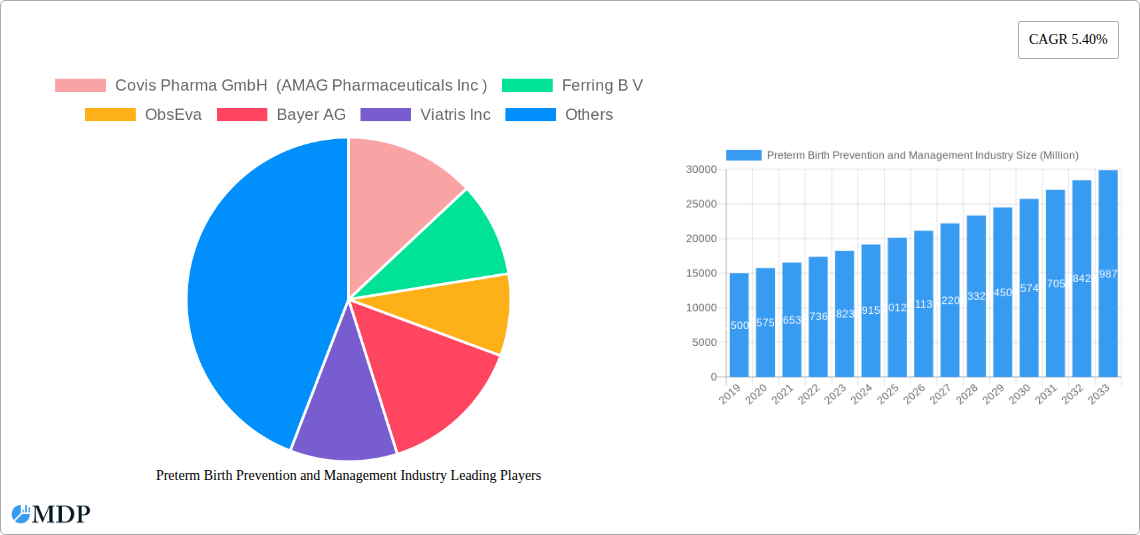
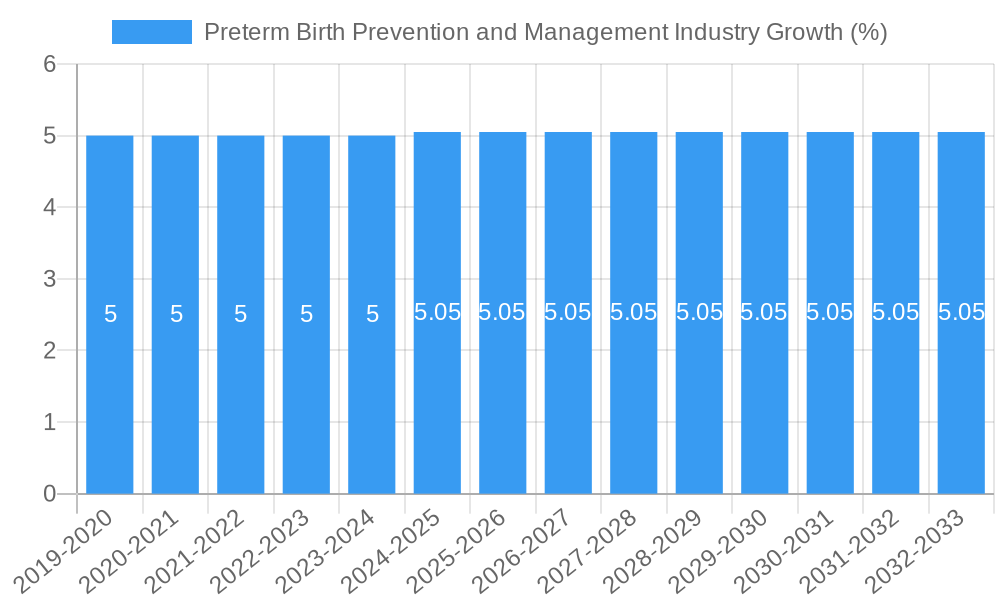
The global Preterm Birth Prevention and Management market is poised for significant expansion, projected to reach a substantial market size by 2033, driven by an estimated Compound Annual Growth Rate (CAGR) of 5.40%. This growth is underpinned by a confluence of escalating concerns over rising preterm birth rates worldwide and advancements in medical interventions. Key drivers fueling this market include increased awareness campaigns highlighting the long-term health implications of premature birth, coupled with substantial investments in research and development for novel preventative therapies and management strategies. Furthermore, the growing prevalence of risk factors such as maternal age, multiple gestations, and underlying chronic health conditions in expectant mothers contributes to a sustained demand for these specialized treatments. The market is characterized by a robust pipeline of innovative drugs and therapies, aiming to improve outcomes for both neonates and mothers, thereby solidifying its upward trajectory.
The market's expansion is further shaped by emerging trends such as the increasing adoption of personalized medicine approaches in preterm birth management, leveraging genetic and biomarker profiling for targeted interventions. Technological advancements in diagnostics and monitoring are also playing a crucial role, enabling earlier detection and more effective management of high-risk pregnancies. While the market demonstrates strong growth potential, certain restraints, such as the high cost of advanced therapies and the limited accessibility of specialized healthcare services in certain low-income regions, may temper the pace of adoption. However, the diverse segmentation across therapy types like Progesterone Therapy, Corticosteroid Therapy, and Tocolytics Therapy, alongside various routes of administration and distribution channels, indicates a dynamic and adaptive market ready to cater to a wide spectrum of needs. Companies are actively innovating to address these challenges, focusing on developing cost-effective solutions and expanding geographical reach to capitalize on the unmet needs in emerging economies.
This comprehensive report provides an in-depth analysis of the global Preterm Birth Prevention and Management Industry, offering critical insights into market dynamics, key trends, leading segments, and future growth trajectories. With a detailed study period spanning from 2019 to 2033, including a base year of 2025, an estimated year of 2025, and a forecast period from 2025 to 2033, this report is an indispensable resource for industry stakeholders, including pharmaceutical companies, research institutions, healthcare providers, and investors. We meticulously examine market concentration, innovation drivers, evolving regulatory landscapes, the impact of product substitutes, emerging end-user preferences, and significant merger and acquisition activities. Furthermore, the report delves into pivotal industry trends, market growth drivers, technological advancements, shifting consumer demands, and the competitive arena, providing a robust understanding of the forces shaping this vital sector. We also pinpoint the leading geographic markets and most impactful market segments across various therapy types (Progesterone Therapy, Corticosteroid Therapy, Tocolytics Therapy, Antibiotics Therapy, Heparin Profylaxis Therapy, Others), routes of administration (Oral, Parenteral, Vaginal), and distribution channels (Hospital Pharmacies, Retail Pharmacies, Others). Product developments, key growth drivers, market challenges, emerging opportunities, leading industry players, and critical milestones are all thoroughly explored to equip you with actionable intelligence for strategic decision-making.
Preterm Birth Prevention and Management Industry Market Dynamics & Concentration
The Preterm Birth Prevention and Management Industry exhibits a moderately concentrated market structure, with a few key players holding significant market share, estimated to be in the range of 55% to 65% collectively. Innovation remains a primary driver, fueled by ongoing research into novel therapeutic targets and drug delivery systems aimed at reducing the incidence and complications of preterm birth. Regulatory frameworks, such as those governed by the FDA and EMA, play a crucial role in product approval and market access, with stringent guidelines ensuring the safety and efficacy of treatments. The threat of product substitutes, while present in certain therapy types like antibiotics, is generally mitigated by the specificity of interventions required for preterm birth management. End-user trends are increasingly emphasizing less invasive and more targeted therapies, alongside a growing demand for better patient outcomes and reduced neonatal intensive care unit (NICU) stays. Merger and acquisition (M&A) activities in this sector have been steady, with an estimated 5 to 10 significant deals occurring annually in the historical period (2019-2024), primarily focused on acquiring innovative pipelines and expanding geographic reach.
- Market Concentration: Dominated by key pharmaceutical players with substantial R&D investments.
- Innovation Drivers: Focus on advanced drug discovery, personalized medicine approaches, and improved delivery methods.
- Regulatory Frameworks: Stringent approval processes by global health authorities.
- Product Substitutes: Limited for established, highly effective treatments, but evolving in supportive care.
- End-User Trends: Demand for improved neonatal outcomes, reduced healthcare costs, and patient convenience.
- M&A Activities: Strategic acquisitions to bolster product portfolios and R&D capabilities.
- Market Share (Leading Players): Estimated combined market share of top 3-5 companies: 55%–65%.
- M&A Deal Counts (Historical Period 2019-2024): Approximately 25-50 deals.
Preterm Birth Prevention and Management Industry Industry Trends & Analysis
The Preterm Birth Prevention and Management Industry is experiencing robust growth, driven by an increasing global awareness of prematurity as a significant public health concern and substantial advancements in neonatal care. The compound annual growth rate (CAGR) for the forecast period (2025–2033) is projected to be between 6.5% and 8.0%, reflecting a sustained upward trajectory. Technological disruptions, particularly in areas like precision medicine, bioinformatics for identifying high-risk pregnancies, and novel drug formulation, are revolutionizing treatment paradigms. Consumer preferences are shifting towards treatments that offer better safety profiles, fewer side effects, and improved efficacy, with a growing emphasis on proactive prevention strategies. Competitive dynamics are characterized by intense R&D efforts, strategic collaborations between pharmaceutical companies and research institutions, and a focus on expanding access to critical therapies in emerging markets. Market penetration is steadily increasing as healthcare systems worldwide prioritize the reduction of preterm birth rates and their associated lifelong health implications. The growing burden of preterm birth globally, with millions of infants born prematurely each year, continues to fuel the demand for effective prevention and management solutions. Furthermore, governmental initiatives and philanthropic efforts aimed at combating prematurity are providing significant impetus for market expansion and innovation. The development of advanced diagnostic tools to identify at-risk pregnancies earlier is also contributing to the proactive adoption of preventive measures. The integration of artificial intelligence in analyzing large datasets related to pregnancy outcomes is paving the way for more personalized and predictive interventions. The increasing prevalence of maternal health issues such as diabetes, hypertension, and obesity also contributes to the higher incidence of preterm births, thereby driving the demand for comprehensive management solutions.
Leading Markets & Segments in Preterm Birth Prevention and Management Industry
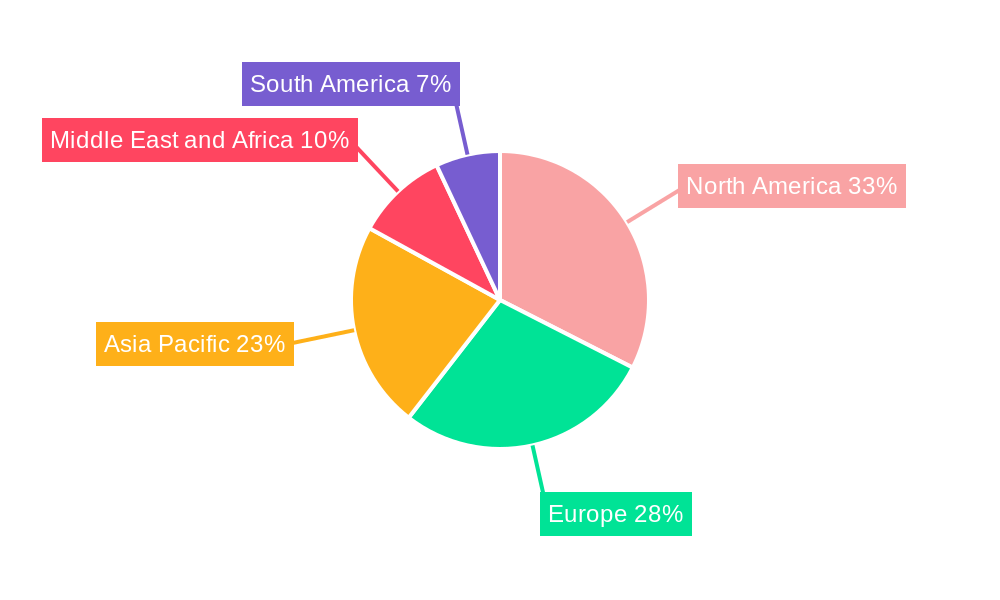
The North America region consistently leads the global Preterm Birth Prevention and Management Industry, driven by a highly developed healthcare infrastructure, substantial investments in medical research and development, and a high prevalence of premature births coupled with advanced neonatal care capabilities. Within North America, the United States stands out as the dominant country, owing to significant expenditure on healthcare, strong regulatory support for pharmaceutical innovation, and the presence of leading research institutions.
- Dominant Region: North America.
- Dominant Country: United States.
Therapy Type Dominance:
- Progesterone Therapy: Holds a significant market share, estimated at 25%–30%, due to its proven efficacy in preventing recurrent spontaneous preterm birth in certain high-risk women. The availability of multiple formulations and established clinical guidelines contributes to its widespread adoption. Key drivers include strong clinical evidence and physician preference.
- Corticosteroid Therapy: Crucial for accelerating fetal lung maturation in pregnancies at risk of preterm birth, this segment captures approximately 20%–25% of the market. Its role in reducing neonatal respiratory distress syndrome remains indispensable. Drivers include established protocols for antenatal administration and demonstrated efficacy in improving neonatal outcomes.
- Tocolytics Therapy: While often used for acute management to delay birth and allow for antenatal treatments, this segment accounts for around 15%–20% of the market. Its use is carefully managed due to potential maternal and neonatal side effects.
- Antibiotics Therapy: Primarily used for managing infections that can trigger preterm labor, this segment represents around 10%–15% of the market. Its application is critical in specific clinical scenarios.
- Heparin Profylaxis Therapy: Used in specific cases of thrombophilia or other risk factors, this segment is a smaller but important niche, accounting for approximately 5%–10%.
- Others: Encompasses emerging therapies and supportive treatments, currently holding a smaller but growing share.
Route of Administration Dominance:
- Parenteral (Injectable): Dominates due to the need for rapid and consistent drug delivery for critical interventions like corticosteroids and certain tocolytics. This route accounts for an estimated 40%–45% of the market.
- Oral: Widely used for progesterone therapy and some prophylactic antibiotics, offering convenience for long-term management and capturing around 30%–35% of the market.
- Vaginal: Increasingly utilized for specific progesterone formulations for preterm birth prevention, representing a growing segment of 20%–25%.
Distribution Channel Dominance:
- Hospital Pharmacies: Remain the primary distribution channel, accounting for an estimated 50%–60% of the market, due to the acute and inpatient nature of many preterm birth management scenarios and the specialized dispensing requirements for certain medications.
- Retail Pharmacies: Show a growing presence, particularly for oral and vaginal progesterone therapies prescribed for outpatient use, capturing around 30%–40%.
- Others: Includes specialized compounding pharmacies and direct-to-patient models, representing a smaller but evolving share.
Economic policies supporting maternal and child health, robust healthcare infrastructure, and high disposable incomes in leading markets are significant drivers for segment dominance. Advancements in drug delivery technologies and increasing physician familiarity with newer formulations further influence the adoption rates within each segment.
Preterm Birth Prevention and Management Industry Product Developments
Product developments in the Preterm Birth Prevention and Management Industry are consistently focused on enhancing efficacy, improving safety profiles, and simplifying administration. Innovations include novel formulations of existing therapeutics, such as long-acting injectable progesterone and improved vaginal delivery systems, aiming to increase patient adherence and therapeutic effectiveness. Research into novel pharmacological targets for preventing preterm labor is ongoing, with a focus on understanding the complex biological pathways leading to premature birth. The competitive advantage lies in products demonstrating superior clinical outcomes in large-scale trials, coupled with favorable safety data and cost-effectiveness for healthcare systems. Technological advancements are also enabling more personalized treatment approaches, tailoring interventions based on individual patient risk factors and genetic predispositions.
Key Drivers of Preterm Birth Prevention and Management Industry Growth
Several key drivers are propelling the growth of the Preterm Birth Prevention and Management Industry. Technologically, advancements in understanding the pathophysiology of preterm birth are leading to the development of more targeted and effective therapies. Economically, increasing healthcare expenditure globally, particularly in emerging markets, and rising awareness of the long-term costs associated with preterm birth complications are fueling investment. Regulatory bodies are also increasingly prioritizing research and development in this area, incentivizing innovation. Furthermore, growing adoption of preventative strategies, driven by better diagnostic tools and patient education, is expanding the market.
- Technological Advancements: Breakthroughs in understanding preterm birth mechanisms and developing novel therapeutics.
- Economic Factors: Increased healthcare spending and a focus on reducing long-term neonatal healthcare costs.
- Regulatory Support: Favorable policies and incentives for R&D in maternal and neonatal health.
- Preventative Strategies: Growing emphasis on early detection and intervention to reduce incidence.
Challenges in the Preterm Birth Prevention and Management Industry Market
Despite its growth potential, the Preterm Birth Prevention and Management Industry faces several challenges. Regulatory hurdles for new drug approvals can be extensive and costly, requiring rigorous clinical trials to demonstrate safety and efficacy. Supply chain disruptions, particularly for specialized medications, can impact availability. Intense competitive pressures among established players and emerging biotechs necessitate continuous innovation and strategic market positioning. Furthermore, the high cost of some advanced therapies can limit accessibility, especially in resource-constrained healthcare settings, impacting market penetration.
- Regulatory Hurdles: Lengthy and costly drug approval processes.
- Supply Chain Issues: Potential disruptions affecting availability of critical medications.
- Competitive Pressures: Intense R&D focus and market competition.
- Cost and Accessibility: High treatment costs limiting patient access.
Emerging Opportunities in Preterm Birth Prevention and Management Industry
Emerging opportunities in the Preterm Birth Prevention and Management Industry are abundant, driven by a deepening understanding of preterm birth etiology and technological innovation. Technological breakthroughs in areas like genomics and proteomics offer the potential for highly personalized prevention and treatment strategies, identifying at-risk individuals with greater accuracy. Strategic partnerships between pharmaceutical companies, academic institutions, and patient advocacy groups are accelerating research and development cycles. Market expansion into underserved regions with high preterm birth rates presents significant growth potential. Furthermore, the development of non-pharmacological interventions and improved patient education programs represent evolving avenues for market engagement and value creation.
Leading Players in the Preterm Birth Prevention and Management Industry Sector
- Covis Pharma GmbH (AMAG Pharmaceuticals Inc)
- Ferring B V
- ObsEva
- Bayer AG
- Viatris Inc
- Merck & Co Inc
- AbbVie Inc
- Takeda Pharmaceutical Company Limited
- Pfizer Inc
Key Milestones in Preterm Birth Prevention and Management Industry Industry
- September 2022: Bayer received approval from the MHLW in Japan for Eylea (aflibercept) intravitreal injection 40 mg/mL for the treatment of preterm infants with retinopathy of prematurity (ROP). This milestone broadens the therapeutic options for complications arising in preterm infants, impacting the management segment.
- June 2022: March of Dimes opened the March of Dimes Prematurity Research Center (PRC) at UC San Francisco (UCSF). The new PRC focuses on prematurity data sharing, computational drug discovery, and electronic medical record research as part of the organization's shift to speed up the pace of discovery to reduce rates of preterm birth in the United States. This initiative is expected to accelerate innovation and drive future market developments.
Strategic Outlook for Preterm Birth Prevention and Management Industry Market
The strategic outlook for the Preterm Birth Prevention and Management Industry is highly promising, driven by an increasing global focus on maternal and neonatal health. Future market potential will be shaped by continued investment in R&D for novel therapeutic agents and preventative strategies, particularly those targeting the underlying causes of preterm birth. Strategic opportunities lie in leveraging advancements in personalized medicine to offer tailored interventions based on genetic and biochemical profiling. Expanding access to proven therapies in low- and middle-income countries, where the burden of preterm birth is highest, represents a significant growth accelerator. Collaborations aimed at improving diagnostic capabilities and early identification of at-risk pregnancies will also play a crucial role in shaping the market landscape and driving sustained growth.
Preterm Birth Prevention and Management Industry Segmentation
-
1. Therapy Type
- 1.1. Progesterone Therapy
- 1.2. Corticosteroid Therapy
- 1.3. Tocolytics Therapy
- 1.4. Antibiotics Therapy
- 1.5. Heparin Profylaxis Therapy
- 1.6. Others
-
2. Route of Administration
- 2.1. Oral
- 2.2. Parenteral
- 2.3. Vaginal
-
3. Distribution Channel
- 3.1. Hospital Pharmacies
- 3.2. Retail Pharmacies
- 3.3. Others
Preterm Birth Prevention and Management Industry Segmentation By Geography
-
1. North America
- 1.1. United States
- 1.2. Canada
- 1.3. Mexico
-
2. Europe
- 2.1. Germany
- 2.2. United Kingdom
- 2.3. France
- 2.4. Italy
- 2.5. Spain
- 2.6. Rest of Europe
-
3. Asia Pacific
- 3.1. China
- 3.2. Japan
- 3.3. India
- 3.4. Australia
- 3.5. South Korea
- 3.6. Rest of Asia Pacific
-
4. Middle East and Africa
- 4.1. GCC
- 4.2. South Africa
- 4.3. Rest of Middle East and Africa
-
5. South America
- 5.1. Brazil
- 5.2. Argentina
- 5.3. Rest of South America
Preterm Birth Prevention and Management Industry REPORT HIGHLIGHTS
| Aspects | Details |
|---|---|
| Study Period | 2019-2033 |
| Base Year | 2024 |
| Estimated Year | 2025 |
| Forecast Period | 2025-2033 |
| Historical Period | 2019-2024 |
| Growth Rate | CAGR of 5.40% from 2019-2033 |
| Segmentation |
|
Table of Contents
- 1. Introduction
- 1.1. Research Scope
- 1.2. Market Segmentation
- 1.3. Research Methodology
- 1.4. Definitions and Assumptions
- 2. Executive Summary
- 2.1. Introduction
- 3. Market Dynamics
- 3.1. Introduction
- 3.2. Market Drivers
- 3.2.1. Increasing Need for Preterm Birth Prevention and Management Drugs; Growing Focus on Targeted Therapies and Standard of Care
- 3.3. Market Restrains
- 3.3.1. Adverse Effects Associated with Medication
- 3.4. Market Trends
- 3.4.1. Tocolytics Therapy Segment Holds Significant Share Over the Forecast Period
- 4. Market Factor Analysis
- 4.1. Porters Five Forces
- 4.2. Supply/Value Chain
- 4.3. PESTEL analysis
- 4.4. Market Entropy
- 4.5. Patent/Trademark Analysis
- 5. Global Preterm Birth Prevention and Management Industry Analysis, Insights and Forecast, 2019-2031
- 5.1. Market Analysis, Insights and Forecast - by Therapy Type
- 5.1.1. Progesterone Therapy
- 5.1.2. Corticosteroid Therapy
- 5.1.3. Tocolytics Therapy
- 5.1.4. Antibiotics Therapy
- 5.1.5. Heparin Profylaxis Therapy
- 5.1.6. Others
- 5.2. Market Analysis, Insights and Forecast - by Route of Administration
- 5.2.1. Oral
- 5.2.2. Parenteral
- 5.2.3. Vaginal
- 5.3. Market Analysis, Insights and Forecast - by Distribution Channel
- 5.3.1. Hospital Pharmacies
- 5.3.2. Retail Pharmacies
- 5.3.3. Others
- 5.4. Market Analysis, Insights and Forecast - by Region
- 5.4.1. North America
- 5.4.2. Europe
- 5.4.3. Asia Pacific
- 5.4.4. Middle East and Africa
- 5.4.5. South America
- 5.1. Market Analysis, Insights and Forecast - by Therapy Type
- 6. North America Preterm Birth Prevention and Management Industry Analysis, Insights and Forecast, 2019-2031
- 6.1. Market Analysis, Insights and Forecast - by Therapy Type
- 6.1.1. Progesterone Therapy
- 6.1.2. Corticosteroid Therapy
- 6.1.3. Tocolytics Therapy
- 6.1.4. Antibiotics Therapy
- 6.1.5. Heparin Profylaxis Therapy
- 6.1.6. Others
- 6.2. Market Analysis, Insights and Forecast - by Route of Administration
- 6.2.1. Oral
- 6.2.2. Parenteral
- 6.2.3. Vaginal
- 6.3. Market Analysis, Insights and Forecast - by Distribution Channel
- 6.3.1. Hospital Pharmacies
- 6.3.2. Retail Pharmacies
- 6.3.3. Others
- 6.1. Market Analysis, Insights and Forecast - by Therapy Type
- 7. Europe Preterm Birth Prevention and Management Industry Analysis, Insights and Forecast, 2019-2031
- 7.1. Market Analysis, Insights and Forecast - by Therapy Type
- 7.1.1. Progesterone Therapy
- 7.1.2. Corticosteroid Therapy
- 7.1.3. Tocolytics Therapy
- 7.1.4. Antibiotics Therapy
- 7.1.5. Heparin Profylaxis Therapy
- 7.1.6. Others
- 7.2. Market Analysis, Insights and Forecast - by Route of Administration
- 7.2.1. Oral
- 7.2.2. Parenteral
- 7.2.3. Vaginal
- 7.3. Market Analysis, Insights and Forecast - by Distribution Channel
- 7.3.1. Hospital Pharmacies
- 7.3.2. Retail Pharmacies
- 7.3.3. Others
- 7.1. Market Analysis, Insights and Forecast - by Therapy Type
- 8. Asia Pacific Preterm Birth Prevention and Management Industry Analysis, Insights and Forecast, 2019-2031
- 8.1. Market Analysis, Insights and Forecast - by Therapy Type
- 8.1.1. Progesterone Therapy
- 8.1.2. Corticosteroid Therapy
- 8.1.3. Tocolytics Therapy
- 8.1.4. Antibiotics Therapy
- 8.1.5. Heparin Profylaxis Therapy
- 8.1.6. Others
- 8.2. Market Analysis, Insights and Forecast - by Route of Administration
- 8.2.1. Oral
- 8.2.2. Parenteral
- 8.2.3. Vaginal
- 8.3. Market Analysis, Insights and Forecast - by Distribution Channel
- 8.3.1. Hospital Pharmacies
- 8.3.2. Retail Pharmacies
- 8.3.3. Others
- 8.1. Market Analysis, Insights and Forecast - by Therapy Type
- 9. Middle East and Africa Preterm Birth Prevention and Management Industry Analysis, Insights and Forecast, 2019-2031
- 9.1. Market Analysis, Insights and Forecast - by Therapy Type
- 9.1.1. Progesterone Therapy
- 9.1.2. Corticosteroid Therapy
- 9.1.3. Tocolytics Therapy
- 9.1.4. Antibiotics Therapy
- 9.1.5. Heparin Profylaxis Therapy
- 9.1.6. Others
- 9.2. Market Analysis, Insights and Forecast - by Route of Administration
- 9.2.1. Oral
- 9.2.2. Parenteral
- 9.2.3. Vaginal
- 9.3. Market Analysis, Insights and Forecast - by Distribution Channel
- 9.3.1. Hospital Pharmacies
- 9.3.2. Retail Pharmacies
- 9.3.3. Others
- 9.1. Market Analysis, Insights and Forecast - by Therapy Type
- 10. South America Preterm Birth Prevention and Management Industry Analysis, Insights and Forecast, 2019-2031
- 10.1. Market Analysis, Insights and Forecast - by Therapy Type
- 10.1.1. Progesterone Therapy
- 10.1.2. Corticosteroid Therapy
- 10.1.3. Tocolytics Therapy
- 10.1.4. Antibiotics Therapy
- 10.1.5. Heparin Profylaxis Therapy
- 10.1.6. Others
- 10.2. Market Analysis, Insights and Forecast - by Route of Administration
- 10.2.1. Oral
- 10.2.2. Parenteral
- 10.2.3. Vaginal
- 10.3. Market Analysis, Insights and Forecast - by Distribution Channel
- 10.3.1. Hospital Pharmacies
- 10.3.2. Retail Pharmacies
- 10.3.3. Others
- 10.1. Market Analysis, Insights and Forecast - by Therapy Type
- 11. North America Preterm Birth Prevention and Management Industry Analysis, Insights and Forecast, 2019-2031
- 11.1. Market Analysis, Insights and Forecast - By Country/Sub-region
- 11.1.1 United States
- 11.1.2 Canada
- 11.1.3 Mexico
- 12. Europe Preterm Birth Prevention and Management Industry Analysis, Insights and Forecast, 2019-2031
- 12.1. Market Analysis, Insights and Forecast - By Country/Sub-region
- 12.1.1 Germany
- 12.1.2 United Kingdom
- 12.1.3 France
- 12.1.4 Italy
- 12.1.5 Spain
- 12.1.6 Rest of Europe
- 13. Asia Pacific Preterm Birth Prevention and Management Industry Analysis, Insights and Forecast, 2019-2031
- 13.1. Market Analysis, Insights and Forecast - By Country/Sub-region
- 13.1.1 China
- 13.1.2 Japan
- 13.1.3 India
- 13.1.4 Australia
- 13.1.5 South Korea
- 13.1.6 Rest of Asia Pacific
- 14. Middle East and Africa Preterm Birth Prevention and Management Industry Analysis, Insights and Forecast, 2019-2031
- 14.1. Market Analysis, Insights and Forecast - By Country/Sub-region
- 14.1.1 GCC
- 14.1.2 South Africa
- 14.1.3 Rest of Middle East and Africa
- 15. South America Preterm Birth Prevention and Management Industry Analysis, Insights and Forecast, 2019-2031
- 15.1. Market Analysis, Insights and Forecast - By Country/Sub-region
- 15.1.1 Brazil
- 15.1.2 Argentina
- 15.1.3 Rest of South America
- 16. Competitive Analysis
- 16.1. Global Market Share Analysis 2024
- 16.2. Company Profiles
- 16.2.1 Covis Pharma GmbH (AMAG Pharmaceuticals Inc )
- 16.2.1.1. Overview
- 16.2.1.2. Products
- 16.2.1.3. SWOT Analysis
- 16.2.1.4. Recent Developments
- 16.2.1.5. Financials (Based on Availability)
- 16.2.2 Ferring B V
- 16.2.2.1. Overview
- 16.2.2.2. Products
- 16.2.2.3. SWOT Analysis
- 16.2.2.4. Recent Developments
- 16.2.2.5. Financials (Based on Availability)
- 16.2.3 ObsEva
- 16.2.3.1. Overview
- 16.2.3.2. Products
- 16.2.3.3. SWOT Analysis
- 16.2.3.4. Recent Developments
- 16.2.3.5. Financials (Based on Availability)
- 16.2.4 Bayer AG
- 16.2.4.1. Overview
- 16.2.4.2. Products
- 16.2.4.3. SWOT Analysis
- 16.2.4.4. Recent Developments
- 16.2.4.5. Financials (Based on Availability)
- 16.2.5 Viatris Inc
- 16.2.5.1. Overview
- 16.2.5.2. Products
- 16.2.5.3. SWOT Analysis
- 16.2.5.4. Recent Developments
- 16.2.5.5. Financials (Based on Availability)
- 16.2.6 Merck & Co Inc
- 16.2.6.1. Overview
- 16.2.6.2. Products
- 16.2.6.3. SWOT Analysis
- 16.2.6.4. Recent Developments
- 16.2.6.5. Financials (Based on Availability)
- 16.2.7 AbbVie Inc
- 16.2.7.1. Overview
- 16.2.7.2. Products
- 16.2.7.3. SWOT Analysis
- 16.2.7.4. Recent Developments
- 16.2.7.5. Financials (Based on Availability)
- 16.2.8 Takeda Pharmaceutical Company Limited
- 16.2.8.1. Overview
- 16.2.8.2. Products
- 16.2.8.3. SWOT Analysis
- 16.2.8.4. Recent Developments
- 16.2.8.5. Financials (Based on Availability)
- 16.2.9 Pfizer Inc
- 16.2.9.1. Overview
- 16.2.9.2. Products
- 16.2.9.3. SWOT Analysis
- 16.2.9.4. Recent Developments
- 16.2.9.5. Financials (Based on Availability)
- 16.2.1 Covis Pharma GmbH (AMAG Pharmaceuticals Inc )
List of Figures
- Figure 1: Global Preterm Birth Prevention and Management Industry Revenue Breakdown (Million, %) by Region 2024 & 2032
- Figure 2: Global Preterm Birth Prevention and Management Industry Volume Breakdown (K Unit, %) by Region 2024 & 2032
- Figure 3: North America Preterm Birth Prevention and Management Industry Revenue (Million), by Country 2024 & 2032
- Figure 4: North America Preterm Birth Prevention and Management Industry Volume (K Unit), by Country 2024 & 2032
- Figure 5: North America Preterm Birth Prevention and Management Industry Revenue Share (%), by Country 2024 & 2032
- Figure 6: North America Preterm Birth Prevention and Management Industry Volume Share (%), by Country 2024 & 2032
- Figure 7: Europe Preterm Birth Prevention and Management Industry Revenue (Million), by Country 2024 & 2032
- Figure 8: Europe Preterm Birth Prevention and Management Industry Volume (K Unit), by Country 2024 & 2032
- Figure 9: Europe Preterm Birth Prevention and Management Industry Revenue Share (%), by Country 2024 & 2032
- Figure 10: Europe Preterm Birth Prevention and Management Industry Volume Share (%), by Country 2024 & 2032
- Figure 11: Asia Pacific Preterm Birth Prevention and Management Industry Revenue (Million), by Country 2024 & 2032
- Figure 12: Asia Pacific Preterm Birth Prevention and Management Industry Volume (K Unit), by Country 2024 & 2032
- Figure 13: Asia Pacific Preterm Birth Prevention and Management Industry Revenue Share (%), by Country 2024 & 2032
- Figure 14: Asia Pacific Preterm Birth Prevention and Management Industry Volume Share (%), by Country 2024 & 2032
- Figure 15: Middle East and Africa Preterm Birth Prevention and Management Industry Revenue (Million), by Country 2024 & 2032
- Figure 16: Middle East and Africa Preterm Birth Prevention and Management Industry Volume (K Unit), by Country 2024 & 2032
- Figure 17: Middle East and Africa Preterm Birth Prevention and Management Industry Revenue Share (%), by Country 2024 & 2032
- Figure 18: Middle East and Africa Preterm Birth Prevention and Management Industry Volume Share (%), by Country 2024 & 2032
- Figure 19: South America Preterm Birth Prevention and Management Industry Revenue (Million), by Country 2024 & 2032
- Figure 20: South America Preterm Birth Prevention and Management Industry Volume (K Unit), by Country 2024 & 2032
- Figure 21: South America Preterm Birth Prevention and Management Industry Revenue Share (%), by Country 2024 & 2032
- Figure 22: South America Preterm Birth Prevention and Management Industry Volume Share (%), by Country 2024 & 2032
- Figure 23: North America Preterm Birth Prevention and Management Industry Revenue (Million), by Therapy Type 2024 & 2032
- Figure 24: North America Preterm Birth Prevention and Management Industry Volume (K Unit), by Therapy Type 2024 & 2032
- Figure 25: North America Preterm Birth Prevention and Management Industry Revenue Share (%), by Therapy Type 2024 & 2032
- Figure 26: North America Preterm Birth Prevention and Management Industry Volume Share (%), by Therapy Type 2024 & 2032
- Figure 27: North America Preterm Birth Prevention and Management Industry Revenue (Million), by Route of Administration 2024 & 2032
- Figure 28: North America Preterm Birth Prevention and Management Industry Volume (K Unit), by Route of Administration 2024 & 2032
- Figure 29: North America Preterm Birth Prevention and Management Industry Revenue Share (%), by Route of Administration 2024 & 2032
- Figure 30: North America Preterm Birth Prevention and Management Industry Volume Share (%), by Route of Administration 2024 & 2032
- Figure 31: North America Preterm Birth Prevention and Management Industry Revenue (Million), by Distribution Channel 2024 & 2032
- Figure 32: North America Preterm Birth Prevention and Management Industry Volume (K Unit), by Distribution Channel 2024 & 2032
- Figure 33: North America Preterm Birth Prevention and Management Industry Revenue Share (%), by Distribution Channel 2024 & 2032
- Figure 34: North America Preterm Birth Prevention and Management Industry Volume Share (%), by Distribution Channel 2024 & 2032
- Figure 35: North America Preterm Birth Prevention and Management Industry Revenue (Million), by Country 2024 & 2032
- Figure 36: North America Preterm Birth Prevention and Management Industry Volume (K Unit), by Country 2024 & 2032
- Figure 37: North America Preterm Birth Prevention and Management Industry Revenue Share (%), by Country 2024 & 2032
- Figure 38: North America Preterm Birth Prevention and Management Industry Volume Share (%), by Country 2024 & 2032
- Figure 39: Europe Preterm Birth Prevention and Management Industry Revenue (Million), by Therapy Type 2024 & 2032
- Figure 40: Europe Preterm Birth Prevention and Management Industry Volume (K Unit), by Therapy Type 2024 & 2032
- Figure 41: Europe Preterm Birth Prevention and Management Industry Revenue Share (%), by Therapy Type 2024 & 2032
- Figure 42: Europe Preterm Birth Prevention and Management Industry Volume Share (%), by Therapy Type 2024 & 2032
- Figure 43: Europe Preterm Birth Prevention and Management Industry Revenue (Million), by Route of Administration 2024 & 2032
- Figure 44: Europe Preterm Birth Prevention and Management Industry Volume (K Unit), by Route of Administration 2024 & 2032
- Figure 45: Europe Preterm Birth Prevention and Management Industry Revenue Share (%), by Route of Administration 2024 & 2032
- Figure 46: Europe Preterm Birth Prevention and Management Industry Volume Share (%), by Route of Administration 2024 & 2032
- Figure 47: Europe Preterm Birth Prevention and Management Industry Revenue (Million), by Distribution Channel 2024 & 2032
- Figure 48: Europe Preterm Birth Prevention and Management Industry Volume (K Unit), by Distribution Channel 2024 & 2032
- Figure 49: Europe Preterm Birth Prevention and Management Industry Revenue Share (%), by Distribution Channel 2024 & 2032
- Figure 50: Europe Preterm Birth Prevention and Management Industry Volume Share (%), by Distribution Channel 2024 & 2032
- Figure 51: Europe Preterm Birth Prevention and Management Industry Revenue (Million), by Country 2024 & 2032
- Figure 52: Europe Preterm Birth Prevention and Management Industry Volume (K Unit), by Country 2024 & 2032
- Figure 53: Europe Preterm Birth Prevention and Management Industry Revenue Share (%), by Country 2024 & 2032
- Figure 54: Europe Preterm Birth Prevention and Management Industry Volume Share (%), by Country 2024 & 2032
- Figure 55: Asia Pacific Preterm Birth Prevention and Management Industry Revenue (Million), by Therapy Type 2024 & 2032
- Figure 56: Asia Pacific Preterm Birth Prevention and Management Industry Volume (K Unit), by Therapy Type 2024 & 2032
- Figure 57: Asia Pacific Preterm Birth Prevention and Management Industry Revenue Share (%), by Therapy Type 2024 & 2032
- Figure 58: Asia Pacific Preterm Birth Prevention and Management Industry Volume Share (%), by Therapy Type 2024 & 2032
- Figure 59: Asia Pacific Preterm Birth Prevention and Management Industry Revenue (Million), by Route of Administration 2024 & 2032
- Figure 60: Asia Pacific Preterm Birth Prevention and Management Industry Volume (K Unit), by Route of Administration 2024 & 2032
- Figure 61: Asia Pacific Preterm Birth Prevention and Management Industry Revenue Share (%), by Route of Administration 2024 & 2032
- Figure 62: Asia Pacific Preterm Birth Prevention and Management Industry Volume Share (%), by Route of Administration 2024 & 2032
- Figure 63: Asia Pacific Preterm Birth Prevention and Management Industry Revenue (Million), by Distribution Channel 2024 & 2032
- Figure 64: Asia Pacific Preterm Birth Prevention and Management Industry Volume (K Unit), by Distribution Channel 2024 & 2032
- Figure 65: Asia Pacific Preterm Birth Prevention and Management Industry Revenue Share (%), by Distribution Channel 2024 & 2032
- Figure 66: Asia Pacific Preterm Birth Prevention and Management Industry Volume Share (%), by Distribution Channel 2024 & 2032
- Figure 67: Asia Pacific Preterm Birth Prevention and Management Industry Revenue (Million), by Country 2024 & 2032
- Figure 68: Asia Pacific Preterm Birth Prevention and Management Industry Volume (K Unit), by Country 2024 & 2032
- Figure 69: Asia Pacific Preterm Birth Prevention and Management Industry Revenue Share (%), by Country 2024 & 2032
- Figure 70: Asia Pacific Preterm Birth Prevention and Management Industry Volume Share (%), by Country 2024 & 2032
- Figure 71: Middle East and Africa Preterm Birth Prevention and Management Industry Revenue (Million), by Therapy Type 2024 & 2032
- Figure 72: Middle East and Africa Preterm Birth Prevention and Management Industry Volume (K Unit), by Therapy Type 2024 & 2032
- Figure 73: Middle East and Africa Preterm Birth Prevention and Management Industry Revenue Share (%), by Therapy Type 2024 & 2032
- Figure 74: Middle East and Africa Preterm Birth Prevention and Management Industry Volume Share (%), by Therapy Type 2024 & 2032
- Figure 75: Middle East and Africa Preterm Birth Prevention and Management Industry Revenue (Million), by Route of Administration 2024 & 2032
- Figure 76: Middle East and Africa Preterm Birth Prevention and Management Industry Volume (K Unit), by Route of Administration 2024 & 2032
- Figure 77: Middle East and Africa Preterm Birth Prevention and Management Industry Revenue Share (%), by Route of Administration 2024 & 2032
- Figure 78: Middle East and Africa Preterm Birth Prevention and Management Industry Volume Share (%), by Route of Administration 2024 & 2032
- Figure 79: Middle East and Africa Preterm Birth Prevention and Management Industry Revenue (Million), by Distribution Channel 2024 & 2032
- Figure 80: Middle East and Africa Preterm Birth Prevention and Management Industry Volume (K Unit), by Distribution Channel 2024 & 2032
- Figure 81: Middle East and Africa Preterm Birth Prevention and Management Industry Revenue Share (%), by Distribution Channel 2024 & 2032
- Figure 82: Middle East and Africa Preterm Birth Prevention and Management Industry Volume Share (%), by Distribution Channel 2024 & 2032
- Figure 83: Middle East and Africa Preterm Birth Prevention and Management Industry Revenue (Million), by Country 2024 & 2032
- Figure 84: Middle East and Africa Preterm Birth Prevention and Management Industry Volume (K Unit), by Country 2024 & 2032
- Figure 85: Middle East and Africa Preterm Birth Prevention and Management Industry Revenue Share (%), by Country 2024 & 2032
- Figure 86: Middle East and Africa Preterm Birth Prevention and Management Industry Volume Share (%), by Country 2024 & 2032
- Figure 87: South America Preterm Birth Prevention and Management Industry Revenue (Million), by Therapy Type 2024 & 2032
- Figure 88: South America Preterm Birth Prevention and Management Industry Volume (K Unit), by Therapy Type 2024 & 2032
- Figure 89: South America Preterm Birth Prevention and Management Industry Revenue Share (%), by Therapy Type 2024 & 2032
- Figure 90: South America Preterm Birth Prevention and Management Industry Volume Share (%), by Therapy Type 2024 & 2032
- Figure 91: South America Preterm Birth Prevention and Management Industry Revenue (Million), by Route of Administration 2024 & 2032
- Figure 92: South America Preterm Birth Prevention and Management Industry Volume (K Unit), by Route of Administration 2024 & 2032
- Figure 93: South America Preterm Birth Prevention and Management Industry Revenue Share (%), by Route of Administration 2024 & 2032
- Figure 94: South America Preterm Birth Prevention and Management Industry Volume Share (%), by Route of Administration 2024 & 2032
- Figure 95: South America Preterm Birth Prevention and Management Industry Revenue (Million), by Distribution Channel 2024 & 2032
- Figure 96: South America Preterm Birth Prevention and Management Industry Volume (K Unit), by Distribution Channel 2024 & 2032
- Figure 97: South America Preterm Birth Prevention and Management Industry Revenue Share (%), by Distribution Channel 2024 & 2032
- Figure 98: South America Preterm Birth Prevention and Management Industry Volume Share (%), by Distribution Channel 2024 & 2032
- Figure 99: South America Preterm Birth Prevention and Management Industry Revenue (Million), by Country 2024 & 2032
- Figure 100: South America Preterm Birth Prevention and Management Industry Volume (K Unit), by Country 2024 & 2032
- Figure 101: South America Preterm Birth Prevention and Management Industry Revenue Share (%), by Country 2024 & 2032
- Figure 102: South America Preterm Birth Prevention and Management Industry Volume Share (%), by Country 2024 & 2032
List of Tables
- Table 1: Global Preterm Birth Prevention and Management Industry Revenue Million Forecast, by Region 2019 & 2032
- Table 2: Global Preterm Birth Prevention and Management Industry Volume K Unit Forecast, by Region 2019 & 2032
- Table 3: Global Preterm Birth Prevention and Management Industry Revenue Million Forecast, by Therapy Type 2019 & 2032
- Table 4: Global Preterm Birth Prevention and Management Industry Volume K Unit Forecast, by Therapy Type 2019 & 2032
- Table 5: Global Preterm Birth Prevention and Management Industry Revenue Million Forecast, by Route of Administration 2019 & 2032
- Table 6: Global Preterm Birth Prevention and Management Industry Volume K Unit Forecast, by Route of Administration 2019 & 2032
- Table 7: Global Preterm Birth Prevention and Management Industry Revenue Million Forecast, by Distribution Channel 2019 & 2032
- Table 8: Global Preterm Birth Prevention and Management Industry Volume K Unit Forecast, by Distribution Channel 2019 & 2032
- Table 9: Global Preterm Birth Prevention and Management Industry Revenue Million Forecast, by Region 2019 & 2032
- Table 10: Global Preterm Birth Prevention and Management Industry Volume K Unit Forecast, by Region 2019 & 2032
- Table 11: Global Preterm Birth Prevention and Management Industry Revenue Million Forecast, by Country 2019 & 2032
- Table 12: Global Preterm Birth Prevention and Management Industry Volume K Unit Forecast, by Country 2019 & 2032
- Table 13: United States Preterm Birth Prevention and Management Industry Revenue (Million) Forecast, by Application 2019 & 2032
- Table 14: United States Preterm Birth Prevention and Management Industry Volume (K Unit) Forecast, by Application 2019 & 2032
- Table 15: Canada Preterm Birth Prevention and Management Industry Revenue (Million) Forecast, by Application 2019 & 2032
- Table 16: Canada Preterm Birth Prevention and Management Industry Volume (K Unit) Forecast, by Application 2019 & 2032
- Table 17: Mexico Preterm Birth Prevention and Management Industry Revenue (Million) Forecast, by Application 2019 & 2032
- Table 18: Mexico Preterm Birth Prevention and Management Industry Volume (K Unit) Forecast, by Application 2019 & 2032
- Table 19: Global Preterm Birth Prevention and Management Industry Revenue Million Forecast, by Country 2019 & 2032
- Table 20: Global Preterm Birth Prevention and Management Industry Volume K Unit Forecast, by Country 2019 & 2032
- Table 21: Germany Preterm Birth Prevention and Management Industry Revenue (Million) Forecast, by Application 2019 & 2032
- Table 22: Germany Preterm Birth Prevention and Management Industry Volume (K Unit) Forecast, by Application 2019 & 2032
- Table 23: United Kingdom Preterm Birth Prevention and Management Industry Revenue (Million) Forecast, by Application 2019 & 2032
- Table 24: United Kingdom Preterm Birth Prevention and Management Industry Volume (K Unit) Forecast, by Application 2019 & 2032
- Table 25: France Preterm Birth Prevention and Management Industry Revenue (Million) Forecast, by Application 2019 & 2032
- Table 26: France Preterm Birth Prevention and Management Industry Volume (K Unit) Forecast, by Application 2019 & 2032
- Table 27: Italy Preterm Birth Prevention and Management Industry Revenue (Million) Forecast, by Application 2019 & 2032
- Table 28: Italy Preterm Birth Prevention and Management Industry Volume (K Unit) Forecast, by Application 2019 & 2032
- Table 29: Spain Preterm Birth Prevention and Management Industry Revenue (Million) Forecast, by Application 2019 & 2032
- Table 30: Spain Preterm Birth Prevention and Management Industry Volume (K Unit) Forecast, by Application 2019 & 2032
- Table 31: Rest of Europe Preterm Birth Prevention and Management Industry Revenue (Million) Forecast, by Application 2019 & 2032
- Table 32: Rest of Europe Preterm Birth Prevention and Management Industry Volume (K Unit) Forecast, by Application 2019 & 2032
- Table 33: Global Preterm Birth Prevention and Management Industry Revenue Million Forecast, by Country 2019 & 2032
- Table 34: Global Preterm Birth Prevention and Management Industry Volume K Unit Forecast, by Country 2019 & 2032
- Table 35: China Preterm Birth Prevention and Management Industry Revenue (Million) Forecast, by Application 2019 & 2032
- Table 36: China Preterm Birth Prevention and Management Industry Volume (K Unit) Forecast, by Application 2019 & 2032
- Table 37: Japan Preterm Birth Prevention and Management Industry Revenue (Million) Forecast, by Application 2019 & 2032
- Table 38: Japan Preterm Birth Prevention and Management Industry Volume (K Unit) Forecast, by Application 2019 & 2032
- Table 39: India Preterm Birth Prevention and Management Industry Revenue (Million) Forecast, by Application 2019 & 2032
- Table 40: India Preterm Birth Prevention and Management Industry Volume (K Unit) Forecast, by Application 2019 & 2032
- Table 41: Australia Preterm Birth Prevention and Management Industry Revenue (Million) Forecast, by Application 2019 & 2032
- Table 42: Australia Preterm Birth Prevention and Management Industry Volume (K Unit) Forecast, by Application 2019 & 2032
- Table 43: South Korea Preterm Birth Prevention and Management Industry Revenue (Million) Forecast, by Application 2019 & 2032
- Table 44: South Korea Preterm Birth Prevention and Management Industry Volume (K Unit) Forecast, by Application 2019 & 2032
- Table 45: Rest of Asia Pacific Preterm Birth Prevention and Management Industry Revenue (Million) Forecast, by Application 2019 & 2032
- Table 46: Rest of Asia Pacific Preterm Birth Prevention and Management Industry Volume (K Unit) Forecast, by Application 2019 & 2032
- Table 47: Global Preterm Birth Prevention and Management Industry Revenue Million Forecast, by Country 2019 & 2032
- Table 48: Global Preterm Birth Prevention and Management Industry Volume K Unit Forecast, by Country 2019 & 2032
- Table 49: GCC Preterm Birth Prevention and Management Industry Revenue (Million) Forecast, by Application 2019 & 2032
- Table 50: GCC Preterm Birth Prevention and Management Industry Volume (K Unit) Forecast, by Application 2019 & 2032
- Table 51: South Africa Preterm Birth Prevention and Management Industry Revenue (Million) Forecast, by Application 2019 & 2032
- Table 52: South Africa Preterm Birth Prevention and Management Industry Volume (K Unit) Forecast, by Application 2019 & 2032
- Table 53: Rest of Middle East and Africa Preterm Birth Prevention and Management Industry Revenue (Million) Forecast, by Application 2019 & 2032
- Table 54: Rest of Middle East and Africa Preterm Birth Prevention and Management Industry Volume (K Unit) Forecast, by Application 2019 & 2032
- Table 55: Global Preterm Birth Prevention and Management Industry Revenue Million Forecast, by Country 2019 & 2032
- Table 56: Global Preterm Birth Prevention and Management Industry Volume K Unit Forecast, by Country 2019 & 2032
- Table 57: Brazil Preterm Birth Prevention and Management Industry Revenue (Million) Forecast, by Application 2019 & 2032
- Table 58: Brazil Preterm Birth Prevention and Management Industry Volume (K Unit) Forecast, by Application 2019 & 2032
- Table 59: Argentina Preterm Birth Prevention and Management Industry Revenue (Million) Forecast, by Application 2019 & 2032
- Table 60: Argentina Preterm Birth Prevention and Management Industry Volume (K Unit) Forecast, by Application 2019 & 2032
- Table 61: Rest of South America Preterm Birth Prevention and Management Industry Revenue (Million) Forecast, by Application 2019 & 2032
- Table 62: Rest of South America Preterm Birth Prevention and Management Industry Volume (K Unit) Forecast, by Application 2019 & 2032
- Table 63: Global Preterm Birth Prevention and Management Industry Revenue Million Forecast, by Therapy Type 2019 & 2032
- Table 64: Global Preterm Birth Prevention and Management Industry Volume K Unit Forecast, by Therapy Type 2019 & 2032
- Table 65: Global Preterm Birth Prevention and Management Industry Revenue Million Forecast, by Route of Administration 2019 & 2032
- Table 66: Global Preterm Birth Prevention and Management Industry Volume K Unit Forecast, by Route of Administration 2019 & 2032
- Table 67: Global Preterm Birth Prevention and Management Industry Revenue Million Forecast, by Distribution Channel 2019 & 2032
- Table 68: Global Preterm Birth Prevention and Management Industry Volume K Unit Forecast, by Distribution Channel 2019 & 2032
- Table 69: Global Preterm Birth Prevention and Management Industry Revenue Million Forecast, by Country 2019 & 2032
- Table 70: Global Preterm Birth Prevention and Management Industry Volume K Unit Forecast, by Country 2019 & 2032
- Table 71: United States Preterm Birth Prevention and Management Industry Revenue (Million) Forecast, by Application 2019 & 2032
- Table 72: United States Preterm Birth Prevention and Management Industry Volume (K Unit) Forecast, by Application 2019 & 2032
- Table 73: Canada Preterm Birth Prevention and Management Industry Revenue (Million) Forecast, by Application 2019 & 2032
- Table 74: Canada Preterm Birth Prevention and Management Industry Volume (K Unit) Forecast, by Application 2019 & 2032
- Table 75: Mexico Preterm Birth Prevention and Management Industry Revenue (Million) Forecast, by Application 2019 & 2032
- Table 76: Mexico Preterm Birth Prevention and Management Industry Volume (K Unit) Forecast, by Application 2019 & 2032
- Table 77: Global Preterm Birth Prevention and Management Industry Revenue Million Forecast, by Therapy Type 2019 & 2032
- Table 78: Global Preterm Birth Prevention and Management Industry Volume K Unit Forecast, by Therapy Type 2019 & 2032
- Table 79: Global Preterm Birth Prevention and Management Industry Revenue Million Forecast, by Route of Administration 2019 & 2032
- Table 80: Global Preterm Birth Prevention and Management Industry Volume K Unit Forecast, by Route of Administration 2019 & 2032
- Table 81: Global Preterm Birth Prevention and Management Industry Revenue Million Forecast, by Distribution Channel 2019 & 2032
- Table 82: Global Preterm Birth Prevention and Management Industry Volume K Unit Forecast, by Distribution Channel 2019 & 2032
- Table 83: Global Preterm Birth Prevention and Management Industry Revenue Million Forecast, by Country 2019 & 2032
- Table 84: Global Preterm Birth Prevention and Management Industry Volume K Unit Forecast, by Country 2019 & 2032
- Table 85: Germany Preterm Birth Prevention and Management Industry Revenue (Million) Forecast, by Application 2019 & 2032
- Table 86: Germany Preterm Birth Prevention and Management Industry Volume (K Unit) Forecast, by Application 2019 & 2032
- Table 87: United Kingdom Preterm Birth Prevention and Management Industry Revenue (Million) Forecast, by Application 2019 & 2032
- Table 88: United Kingdom Preterm Birth Prevention and Management Industry Volume (K Unit) Forecast, by Application 2019 & 2032
- Table 89: France Preterm Birth Prevention and Management Industry Revenue (Million) Forecast, by Application 2019 & 2032
- Table 90: France Preterm Birth Prevention and Management Industry Volume (K Unit) Forecast, by Application 2019 & 2032
- Table 91: Italy Preterm Birth Prevention and Management Industry Revenue (Million) Forecast, by Application 2019 & 2032
- Table 92: Italy Preterm Birth Prevention and Management Industry Volume (K Unit) Forecast, by Application 2019 & 2032
- Table 93: Spain Preterm Birth Prevention and Management Industry Revenue (Million) Forecast, by Application 2019 & 2032
- Table 94: Spain Preterm Birth Prevention and Management Industry Volume (K Unit) Forecast, by Application 2019 & 2032
- Table 95: Rest of Europe Preterm Birth Prevention and Management Industry Revenue (Million) Forecast, by Application 2019 & 2032
- Table 96: Rest of Europe Preterm Birth Prevention and Management Industry Volume (K Unit) Forecast, by Application 2019 & 2032
- Table 97: Global Preterm Birth Prevention and Management Industry Revenue Million Forecast, by Therapy Type 2019 & 2032
- Table 98: Global Preterm Birth Prevention and Management Industry Volume K Unit Forecast, by Therapy Type 2019 & 2032
- Table 99: Global Preterm Birth Prevention and Management Industry Revenue Million Forecast, by Route of Administration 2019 & 2032
- Table 100: Global Preterm Birth Prevention and Management Industry Volume K Unit Forecast, by Route of Administration 2019 & 2032
- Table 101: Global Preterm Birth Prevention and Management Industry Revenue Million Forecast, by Distribution Channel 2019 & 2032
- Table 102: Global Preterm Birth Prevention and Management Industry Volume K Unit Forecast, by Distribution Channel 2019 & 2032
- Table 103: Global Preterm Birth Prevention and Management Industry Revenue Million Forecast, by Country 2019 & 2032
- Table 104: Global Preterm Birth Prevention and Management Industry Volume K Unit Forecast, by Country 2019 & 2032
- Table 105: China Preterm Birth Prevention and Management Industry Revenue (Million) Forecast, by Application 2019 & 2032
- Table 106: China Preterm Birth Prevention and Management Industry Volume (K Unit) Forecast, by Application 2019 & 2032
- Table 107: Japan Preterm Birth Prevention and Management Industry Revenue (Million) Forecast, by Application 2019 & 2032
- Table 108: Japan Preterm Birth Prevention and Management Industry Volume (K Unit) Forecast, by Application 2019 & 2032
- Table 109: India Preterm Birth Prevention and Management Industry Revenue (Million) Forecast, by Application 2019 & 2032
- Table 110: India Preterm Birth Prevention and Management Industry Volume (K Unit) Forecast, by Application 2019 & 2032
- Table 111: Australia Preterm Birth Prevention and Management Industry Revenue (Million) Forecast, by Application 2019 & 2032
- Table 112: Australia Preterm Birth Prevention and Management Industry Volume (K Unit) Forecast, by Application 2019 & 2032
- Table 113: South Korea Preterm Birth Prevention and Management Industry Revenue (Million) Forecast, by Application 2019 & 2032
- Table 114: South Korea Preterm Birth Prevention and Management Industry Volume (K Unit) Forecast, by Application 2019 & 2032
- Table 115: Rest of Asia Pacific Preterm Birth Prevention and Management Industry Revenue (Million) Forecast, by Application 2019 & 2032
- Table 116: Rest of Asia Pacific Preterm Birth Prevention and Management Industry Volume (K Unit) Forecast, by Application 2019 & 2032
- Table 117: Global Preterm Birth Prevention and Management Industry Revenue Million Forecast, by Therapy Type 2019 & 2032
- Table 118: Global Preterm Birth Prevention and Management Industry Volume K Unit Forecast, by Therapy Type 2019 & 2032
- Table 119: Global Preterm Birth Prevention and Management Industry Revenue Million Forecast, by Route of Administration 2019 & 2032
- Table 120: Global Preterm Birth Prevention and Management Industry Volume K Unit Forecast, by Route of Administration 2019 & 2032
- Table 121: Global Preterm Birth Prevention and Management Industry Revenue Million Forecast, by Distribution Channel 2019 & 2032
- Table 122: Global Preterm Birth Prevention and Management Industry Volume K Unit Forecast, by Distribution Channel 2019 & 2032
- Table 123: Global Preterm Birth Prevention and Management Industry Revenue Million Forecast, by Country 2019 & 2032
- Table 124: Global Preterm Birth Prevention and Management Industry Volume K Unit Forecast, by Country 2019 & 2032
- Table 125: GCC Preterm Birth Prevention and Management Industry Revenue (Million) Forecast, by Application 2019 & 2032
- Table 126: GCC Preterm Birth Prevention and Management Industry Volume (K Unit) Forecast, by Application 2019 & 2032
- Table 127: South Africa Preterm Birth Prevention and Management Industry Revenue (Million) Forecast, by Application 2019 & 2032
- Table 128: South Africa Preterm Birth Prevention and Management Industry Volume (K Unit) Forecast, by Application 2019 & 2032
- Table 129: Rest of Middle East and Africa Preterm Birth Prevention and Management Industry Revenue (Million) Forecast, by Application 2019 & 2032
- Table 130: Rest of Middle East and Africa Preterm Birth Prevention and Management Industry Volume (K Unit) Forecast, by Application 2019 & 2032
- Table 131: Global Preterm Birth Prevention and Management Industry Revenue Million Forecast, by Therapy Type 2019 & 2032
- Table 132: Global Preterm Birth Prevention and Management Industry Volume K Unit Forecast, by Therapy Type 2019 & 2032
- Table 133: Global Preterm Birth Prevention and Management Industry Revenue Million Forecast, by Route of Administration 2019 & 2032
- Table 134: Global Preterm Birth Prevention and Management Industry Volume K Unit Forecast, by Route of Administration 2019 & 2032
- Table 135: Global Preterm Birth Prevention and Management Industry Revenue Million Forecast, by Distribution Channel 2019 & 2032
- Table 136: Global Preterm Birth Prevention and Management Industry Volume K Unit Forecast, by Distribution Channel 2019 & 2032
- Table 137: Global Preterm Birth Prevention and Management Industry Revenue Million Forecast, by Country 2019 & 2032
- Table 138: Global Preterm Birth Prevention and Management Industry Volume K Unit Forecast, by Country 2019 & 2032
- Table 139: Brazil Preterm Birth Prevention and Management Industry Revenue (Million) Forecast, by Application 2019 & 2032
- Table 140: Brazil Preterm Birth Prevention and Management Industry Volume (K Unit) Forecast, by Application 2019 & 2032
- Table 141: Argentina Preterm Birth Prevention and Management Industry Revenue (Million) Forecast, by Application 2019 & 2032
- Table 142: Argentina Preterm Birth Prevention and Management Industry Volume (K Unit) Forecast, by Application 2019 & 2032
- Table 143: Rest of South America Preterm Birth Prevention and Management Industry Revenue (Million) Forecast, by Application 2019 & 2032
- Table 144: Rest of South America Preterm Birth Prevention and Management Industry Volume (K Unit) Forecast, by Application 2019 & 2032
Frequently Asked Questions
1. What is the projected Compound Annual Growth Rate (CAGR) of the Preterm Birth Prevention and Management Industry?
The projected CAGR is approximately 5.40%.
2. Which companies are prominent players in the Preterm Birth Prevention and Management Industry?
Key companies in the market include Covis Pharma GmbH (AMAG Pharmaceuticals Inc ), Ferring B V, ObsEva, Bayer AG, Viatris Inc, Merck & Co Inc, AbbVie Inc, Takeda Pharmaceutical Company Limited, Pfizer Inc.
3. What are the main segments of the Preterm Birth Prevention and Management Industry?
The market segments include Therapy Type, Route of Administration, Distribution Channel.
4. Can you provide details about the market size?
The market size is estimated to be USD XX Million as of 2022.
5. What are some drivers contributing to market growth?
Increasing Need for Preterm Birth Prevention and Management Drugs; Growing Focus on Targeted Therapies and Standard of Care.
6. What are the notable trends driving market growth?
Tocolytics Therapy Segment Holds Significant Share Over the Forecast Period.
7. Are there any restraints impacting market growth?
Adverse Effects Associated with Medication.
8. Can you provide examples of recent developments in the market?
In September 2022, Bayer received approval from the MHLW in Japan for Eylea (aflibercept) intravitreal injection 40 mg/mL for the treatment of preterm infants with retinopathy of prematurity (ROP).
9. What pricing options are available for accessing the report?
Pricing options include single-user, multi-user, and enterprise licenses priced at USD 4750, USD 5250, and USD 8750 respectively.
10. Is the market size provided in terms of value or volume?
The market size is provided in terms of value, measured in Million and volume, measured in K Unit.
11. Are there any specific market keywords associated with the report?
Yes, the market keyword associated with the report is "Preterm Birth Prevention and Management Industry," which aids in identifying and referencing the specific market segment covered.
12. How do I determine which pricing option suits my needs best?
The pricing options vary based on user requirements and access needs. Individual users may opt for single-user licenses, while businesses requiring broader access may choose multi-user or enterprise licenses for cost-effective access to the report.
13. Are there any additional resources or data provided in the Preterm Birth Prevention and Management Industry report?
While the report offers comprehensive insights, it's advisable to review the specific contents or supplementary materials provided to ascertain if additional resources or data are available.
14. How can I stay updated on further developments or reports in the Preterm Birth Prevention and Management Industry?
To stay informed about further developments, trends, and reports in the Preterm Birth Prevention and Management Industry, consider subscribing to industry newsletters, following relevant companies and organizations, or regularly checking reputable industry news sources and publications.
Methodology
Step 1 - Identification of Relevant Samples Size from Population Database


Step 2 - Approaches for Defining Global Market Size (Value, Volume* & Price*)

Note*: In applicable scenarios
Step 3 - Data Sources
Primary Research
- Web Analytics
- Survey Reports
- Research Institute
- Latest Research Reports
- Opinion Leaders
Secondary Research
- Annual Reports
- White Paper
- Latest Press Release
- Industry Association
- Paid Database
- Investor Presentations

Step 4 - Data Triangulation
Involves using different sources of information in order to increase the validity of a study
These sources are likely to be stakeholders in a program - participants, other researchers, program staff, other community members, and so on.
Then we put all data in single framework & apply various statistical tools to find out the dynamic on the market.
During the analysis stage, feedback from the stakeholder groups would be compared to determine areas of agreement as well as areas of divergence
