

Key Insights
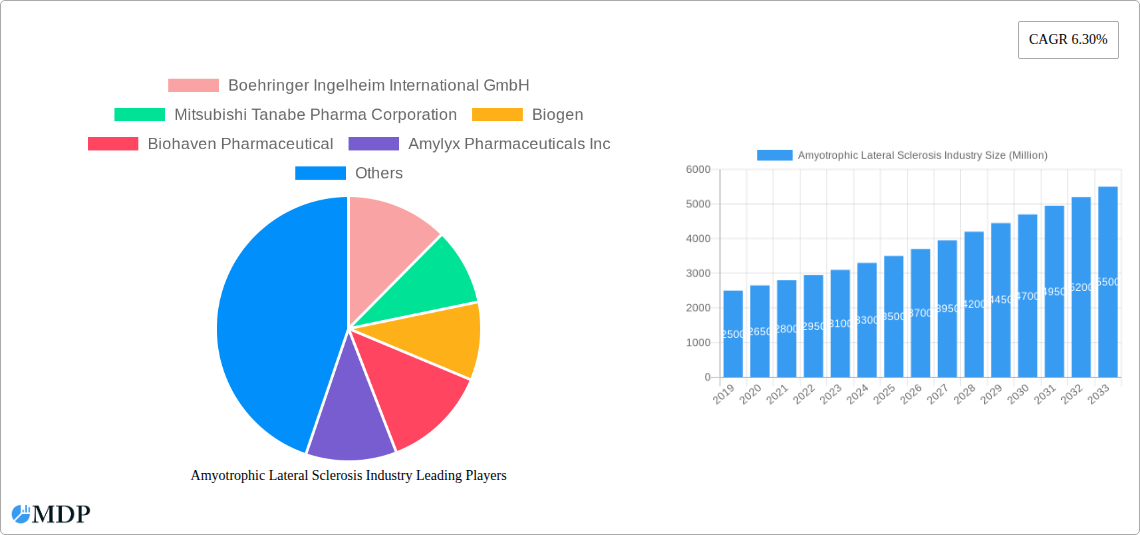
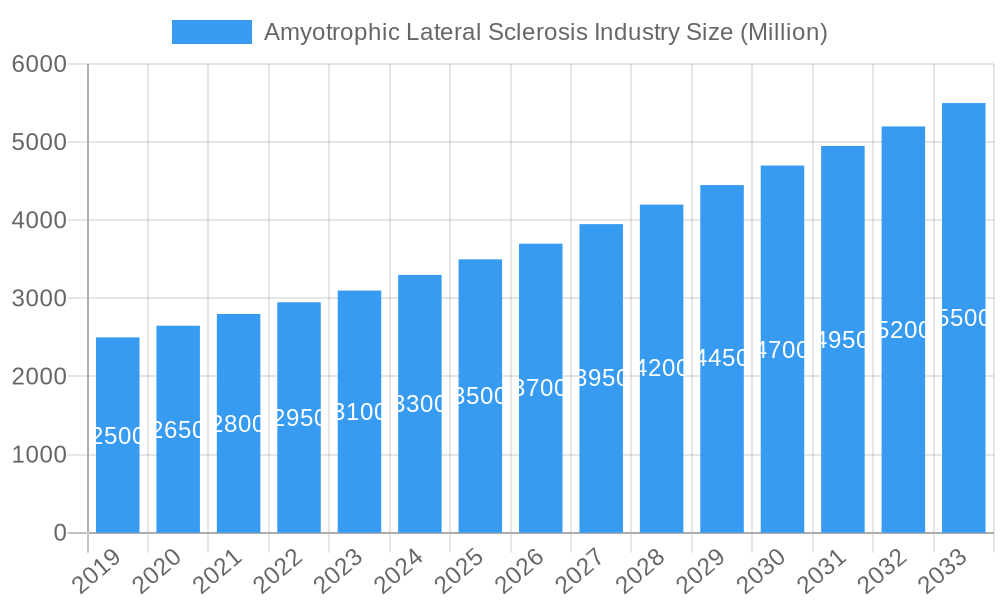
The Amyotrophic Lateral Sclerosis (ALS) market is experiencing significant expansion, projected to reach $8.77 billion by 2025, with a robust compound annual growth rate (CAGR) of 13.84% through 2033. This growth is propelled by accelerated therapeutic research and development, including novel drug discovery and innovative treatment modalities. Increasing global prevalence of neurodegenerative diseases, heightened awareness, and enhanced diagnostic capabilities further fuel market expansion. A dynamic pipeline of investigational therapies, from gene to cell-based treatments, is set to broaden therapeutic options and address critical unmet needs, thereby stimulating market demand. Leading industry players such as Boehringer Ingelheim, Biogen, and Mitsubishi Tanabe Pharma are heavily investing in R&D to pioneer breakthrough treatments.
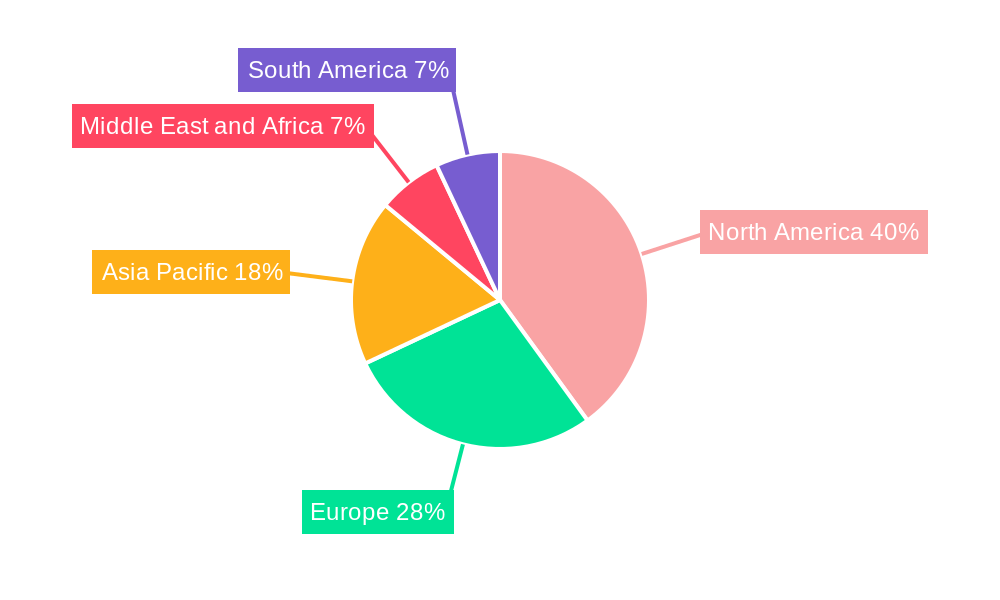
Amyotrophic Lateral Sclerosis Industry Market Size (In Billion)
Market segmentation highlights key focus areas. "Medication" is expected to lead in treatment types, reflecting current pharmaceutical interventions. However, "Others," encompassing emerging gene and cell therapies, anticipates rapid growth as these innovative approaches gain traction and regulatory approvals. "Hospital Pharmacies" currently lead distribution channels due to the specialized nature of ALS care, with "Retail Pharmacies" also facilitating wider patient access. Geographically, North America, led by the United States, is projected to hold the largest market share, attributed to substantial healthcare expenditure and a strong research ecosystem. Europe and the Asia Pacific region are also poised for significant growth, driven by escalating healthcare investments and rising incidence rates. Challenges, including the high cost of novel therapies and complex regulatory pathways, may present potential restraints, underscoring the need for continued efforts to ensure patient accessibility and affordability.
Amyotrophic Lateral Sclerosis Industry Company Market Share
Gain comprehensive insights into the rapidly evolving Amyotrophic Lateral Sclerosis (ALS) market. This report, covering 2019-2033 with a base year of 2025, offers in-depth analysis of market dynamics, key trends, leading segments, and strategic outlook. With an estimated market size of $8.77 billion in 2025, the ALS market is set for substantial growth, driven by therapeutic advancements, increased research initiatives, and a deeper understanding of this debilitating neurodegenerative disease.
Amyotrophic Lateral Sclerosis Industry Market Dynamics & Concentration
The Amyotrophic Lateral Sclerosis (ALS) industry is characterized by a dynamic and evolving market concentration. Innovation drivers are primarily fueled by intensive research and development efforts aimed at discovering effective treatments and cures. The regulatory frameworks, though often stringent due to the critical nature of neurological diseases, are adapting to facilitate the approval of promising new therapies. Product substitutes are currently limited, with a strong emphasis on disease-modifying treatments and supportive care. End-user trends highlight a growing demand for personalized medicine and patient-centric care models. Mergers and acquisition (M&A) activities are moderately present, reflecting strategic moves to consolidate market presence and acquire promising pipeline assets. The market share distribution among key players is relatively fragmented, with emerging companies showing significant potential. The number of M&A deals, while not in the millions, signifies strategic consolidations and partnerships.
- Market Concentration: Moderately fragmented with key players and emerging biotechs.
- Innovation Drivers: Novel drug discovery, gene therapy, stem cell research, and biomarker identification.
- Regulatory Frameworks: FDA, EMA, Health Canada, and other national health agencies play a crucial role.
- Product Substitutes: Primarily supportive care and existing approved medications; research into new modalities is ongoing.
- End-User Trends: Increasing demand for patient support programs, home-based care, and access to clinical trials.
- M&A Activities: Strategic acquisitions of early-stage companies and licensing agreements to expand drug portfolios.
Amyotrophic Lateral Sclerosis Industry Industry Trends & Analysis
The Amyotrophic Lateral Sclerosis (ALS) industry is experiencing a transformative period, driven by a confluence of scientific breakthroughs, increasing global awareness, and a growing pipeline of potential therapies. The market growth drivers are predominantly rooted in the unmet medical need for effective treatments that can slow disease progression or reverse its effects. Technological disruptions, particularly in the realm of gene editing, advanced drug delivery systems, and sophisticated diagnostic tools, are opening new avenues for therapeutic intervention. Consumer preferences are increasingly shifting towards more accessible clinical trial participation and therapies that improve quality of life for patients. Competitive dynamics are intensifying as both established pharmaceutical giants and nimble biotechnology startups vie for dominance in this crucial therapeutic area. The market penetration of advanced therapies is expected to rise as more drugs gain regulatory approval and become widely available. The compound annual growth rate (CAGR) for the ALS market is projected to be significant, driven by these evolving trends. The market is characterized by substantial investment in R&D, with a focus on understanding the complex genetic and molecular underpinnings of ALS. The increasing prevalence of aging populations worldwide also contributes to a higher incidence of neurodegenerative diseases, including ALS, thereby expanding the potential patient pool. Furthermore, government initiatives and non-profit organizations are playing a pivotal role in funding research and advocating for patient access to innovative treatments, further fueling market expansion. The development of companion diagnostics and personalized treatment approaches are also becoming critical trends, enabling more targeted and effective interventions for ALS patients. The industry is also witnessing a growing emphasis on multi-disciplinary care models, integrating neurology, physical therapy, occupational therapy, and speech therapy to provide comprehensive patient support. The increasing number of clinical trials and the faster pace of drug development are expected to bring more novel therapeutic options to the market in the coming years, directly impacting market growth and penetration.
Amyotrophic Lateral Sclerosis Industry Leading Markets & Segments in Amyotrophic Lateral Sclerosis Industry
The Amyotrophic Lateral Sclerosis (ALS) industry exhibits distinct regional dominance and segment preferences, offering crucial insights for market strategists. North America, particularly the United States, stands as the dominant region due to robust R&D infrastructure, significant healthcare spending, and a proactive regulatory environment that has facilitated the approval of key ALS therapies. Economic policies that incentivize pharmaceutical research and development, coupled with advanced healthcare infrastructure, further solidify its leading position. Within treatment types, the Medication segment is paramount, encompassing approved drugs and promising pipeline candidates designed to slow disease progression or manage symptoms. The Others segment, which includes advanced therapies like gene therapy and stem cell treatments, is rapidly gaining traction and represents a significant future growth area.
In terms of distribution channels, Hospital Pharmacies are the primary point of access for many ALS treatments, especially those administered intravenously or requiring specialized monitoring and management. Retail Pharmacies are increasingly important for oral medications and supportive care products. The Others category, encompassing specialized infusion centers and direct-to-patient delivery services, is also growing.
Key drivers for dominance in these segments include:
- North America:
- High prevalence of neurological research centers and academic institutions.
- Favorable reimbursement policies for innovative treatments.
- Strong patient advocacy groups driving research funding and awareness.
- Treatment Type: Medication:
- Established efficacy of approved drugs in managing symptoms and slowing progression.
- Ongoing clinical trials for new pharmacological interventions.
- Distribution Channel: Hospital Pharmacies:
- Necessity for specialized administration and patient monitoring for certain ALS therapies.
- Integration with hospital-based multidisciplinary care teams.
Amyotrophic Lateral Sclerosis Industry Product Developments
Product developments in the Amyotrophic Lateral Sclerosis (ALS) industry are characterized by a relentless pursuit of novel therapeutic modalities. Innovations are focused on targeting the underlying mechanisms of neurodegeneration, with significant advancements in gene therapy, RNA-targeting approaches, and stem cell-based regenerative medicine. Companies are leveraging cutting-edge technologies to develop drugs that can slow disease progression, alleviate symptoms, and potentially offer a path towards remission. The competitive advantage lies in the ability to demonstrate clinical efficacy, safety, and a favorable side-effect profile. Market fit is achieved by addressing critical unmet patient needs and providing tangible improvements in quality of life.
Key Drivers of Amyotrophic Lateral Sclerosis Industry Growth
The Amyotrophic Lateral Sclerosis (ALS) industry growth is propelled by several critical factors. Technological advancements in genomics, proteomics, and molecular biology are unlocking deeper insights into ALS pathogenesis, paving the way for targeted therapies. Economic factors, including increased government funding for rare disease research and growing private investment in biotech, are providing essential capital for drug development. Regulatory bodies are also becoming more receptive to novel therapeutic approaches for unmet medical needs, expediting the review and approval process for promising ALS treatments. For instance, the recent approvals of innovative drugs highlight this trend.
- Technological Advancements: Gene editing, RNA interference, and stem cell therapies.
- Increased R&D Investment: Growing funding from government agencies, VCs, and pharmaceutical companies.
- Favorable Regulatory Landscape: Streamlined approval pathways for orphan drugs and rare disease treatments.
- Growing Patient Registries and Data Sharing: Facilitating research and understanding of disease progression.
Challenges in the Amyotrophic Lateral Sclerosis Industry Market
Despite promising advancements, the Amyotrophic Lateral Sclerosis (ALS) industry faces significant challenges. Regulatory hurdles, though evolving, can still be complex and time-consuming for novel therapies. The high cost of drug development and the relatively small patient population in some regions pose economic challenges for pharmaceutical companies, impacting profitability and investment. Supply chain complexities, particularly for specialized biologics and gene therapies, can also lead to accessibility issues. Furthermore, the inherent difficulty in developing effective treatments for such a complex and heterogeneous disease remains a primary scientific barrier.
- High Drug Development Costs: Significant investment required with no guarantee of success.
- Complex Regulatory Pathways: Stringent approval processes for novel and potentially curative treatments.
- Supply Chain and Manufacturing: Challenges in scaling up production of advanced therapies.
- Disease Heterogeneity: Variability in disease progression and response to treatment.
Emerging Opportunities in Amyotrophic Lateral Sclerosis Industry
Emerging opportunities in the Amyotrophic Lateral Sclerosis (ALS) industry are largely driven by groundbreaking technological breakthroughs and strategic market expansion. The development of precision medicine approaches, leveraging genetic profiling to tailor treatments to individual patients, presents a significant avenue for growth. Strategic partnerships between academic research institutions and pharmaceutical companies are accelerating the translation of laboratory discoveries into clinical applications. Furthermore, market expansion into underserved geographical regions and the exploration of novel therapeutic delivery methods are poised to unlock new patient populations and revenue streams.
Leading Players in the Amyotrophic Lateral Sclerosis Industry Sector
- Boehringer Ingelheim International GmbH
- Mitsubishi Tanabe Pharma Corporation
- Biogen
- Biohaven Pharmaceutical
- Amylyx Pharmaceuticals Inc
- BrainStorm Cell Limited
- Ionis Pharmaceuticals
- CORESTEM Inc
- ANNEXON INC
- AbbVie Inc
- CRISPR Therapeutics
- Sun Pharmaceutical Industries Ltd
- AB Science
- Otsuka Pharmaceutical Co Ltd
Key Milestones in Amyotrophic Lateral Sclerosis Industry Industry
- June 2022: Canada approved Amylyx Pharmaceuticals Inc.'s new drug ALBRIOZA (also known as AMX0035) for amyotrophic lateral sclerosis.
- May 2022: Mitsubishi Tanabe Pharma America received the United States Food and Drug Administration Approval for RADICAVA ORS (edaravone) for the Treatment of amyotrophic lateral sclerosis.
Strategic Outlook for Amyotrophic Lateral Sclerosis Industry Market
The strategic outlook for the Amyotrophic Lateral Sclerosis (ALS) industry market is highly promising, driven by ongoing innovation and a deepening understanding of the disease. Growth accelerators include the continued development of next-generation therapies, such as gene editing and personalized RNA therapeutics, which offer the potential for disease modification. Strategic opportunities lie in fostering collaborations between biotech firms and large pharmaceutical companies to expedite clinical trials and broaden market access. Furthermore, the increasing focus on early diagnosis and intervention, coupled with the expansion of patient support programs, will contribute to sustained market growth and improved patient outcomes.
Amyotrophic Lateral Sclerosis Industry Segmentation
-
1. Treatment Type
- 1.1. Medication
- 1.2. Others
-
2. Distribution Channel
- 2.1. Hospital Pharmacies
- 2.2. Retail Pharmacies
- 2.3. Others
Amyotrophic Lateral Sclerosis Industry Segmentation By Geography
-
1. North America
- 1.1. United States
- 1.2. Canada
- 1.3. Mexico
-
2. Europe
- 2.1. Germany
- 2.2. United Kingdom
- 2.3. France
- 2.4. Italy
- 2.5. Spain
- 2.6. Rest of Europe
-
3. Asia Pacific
- 3.1. China
- 3.2. Japan
- 3.3. India
- 3.4. Australia
- 3.5. South Korea
- 3.6. Rest of Asia Pacific
-
4. Middle East and Africa
- 4.1. GCC
- 4.2. South Africa
- 4.3. Rest of Middle East and Africa
-
5. South America
- 5.1. Brazil
- 5.2. Argentina
- 5.3. Rest of South America
Amyotrophic Lateral Sclerosis Industry Regional Market Share
Geographic Coverage of Amyotrophic Lateral Sclerosis Industry
Amyotrophic Lateral Sclerosis Industry REPORT HIGHLIGHTS
| Aspects | Details |
|---|---|
| Study Period | 2020-2034 |
| Base Year | 2025 |
| Estimated Year | 2026 |
| Forecast Period | 2026-2034 |
| Historical Period | 2020-2025 |
| Growth Rate | CAGR of 13.84% from 2020-2034 |
| Segmentation |
|
Table of Contents
- 1. Introduction
- 1.1. Research Scope
- 1.2. Market Segmentation
- 1.3. Research Objective
- 1.4. Definitions and Assumptions
- 2. Executive Summary
- 2.1. Market Snapshot
- 3. Market Dynamics
- 3.1. Market Drivers
- 3.2. Market Restrains
- 3.3. Market Trends
- 3.4. Market Opportunities
- 4. Market Factor Analysis
- 4.1. Porters Five Forces
- 4.1.1. Bargaining Power of Suppliers
- 4.1.2. Bargaining Power of Buyers
- 4.1.3. Threat of New Entrants
- 4.1.4. Threat of Substitutes
- 4.1.5. Competitive Rivalry
- 4.2. PESTEL analysis
- 4.3. BCG Analysis
- 4.3.1. Stars (High Growth, High Market Share)
- 4.3.2. Cash Cows (Low Growth, High Market Share)
- 4.3.3. Question Mark (High Growth, Low Market Share)
- 4.3.4. Dogs (Low Growth, Low Market Share)
- 4.4. Ansoff Matrix Analysis
- 4.5. Supply Chain Analysis
- 4.6. Regulatory Landscape
- 4.7. Current Market Potential and Opportunity Assessment (TAM–SAM–SOM Framework)
- 4.8. MDP Analyst Note
- 4.1. Porters Five Forces
- 5. Market Analysis, Insights and Forecast 2021-2033
- 5.1. Market Analysis, Insights and Forecast - by Treatment Type
- 5.1.1. Medication
- 5.1.2. Others
- 5.2. Market Analysis, Insights and Forecast - by Distribution Channel
- 5.2.1. Hospital Pharmacies
- 5.2.2. Retail Pharmacies
- 5.2.3. Others
- 5.3. Market Analysis, Insights and Forecast - by Region
- 5.3.1. North America
- 5.3.2. Europe
- 5.3.3. Asia Pacific
- 5.3.4. Middle East and Africa
- 5.3.5. South America
- 5.1. Market Analysis, Insights and Forecast - by Treatment Type
- 6. Global Amyotrophic Lateral Sclerosis Industry Analysis, Insights and Forecast, 2021-2033
- 6.1. Market Analysis, Insights and Forecast - by Treatment Type
- 6.1.1. Medication
- 6.1.2. Others
- 6.2. Market Analysis, Insights and Forecast - by Distribution Channel
- 6.2.1. Hospital Pharmacies
- 6.2.2. Retail Pharmacies
- 6.2.3. Others
- 6.1. Market Analysis, Insights and Forecast - by Treatment Type
- 7. North America Amyotrophic Lateral Sclerosis Industry Analysis, Insights and Forecast, 2020-2032
- 7.1. Market Analysis, Insights and Forecast - by Treatment Type
- 7.1.1. Medication
- 7.1.2. Others
- 7.2. Market Analysis, Insights and Forecast - by Distribution Channel
- 7.2.1. Hospital Pharmacies
- 7.2.2. Retail Pharmacies
- 7.2.3. Others
- 7.1. Market Analysis, Insights and Forecast - by Treatment Type
- 8. Europe Amyotrophic Lateral Sclerosis Industry Analysis, Insights and Forecast, 2020-2032
- 8.1. Market Analysis, Insights and Forecast - by Treatment Type
- 8.1.1. Medication
- 8.1.2. Others
- 8.2. Market Analysis, Insights and Forecast - by Distribution Channel
- 8.2.1. Hospital Pharmacies
- 8.2.2. Retail Pharmacies
- 8.2.3. Others
- 8.1. Market Analysis, Insights and Forecast - by Treatment Type
- 9. Asia Pacific Amyotrophic Lateral Sclerosis Industry Analysis, Insights and Forecast, 2020-2032
- 9.1. Market Analysis, Insights and Forecast - by Treatment Type
- 9.1.1. Medication
- 9.1.2. Others
- 9.2. Market Analysis, Insights and Forecast - by Distribution Channel
- 9.2.1. Hospital Pharmacies
- 9.2.2. Retail Pharmacies
- 9.2.3. Others
- 9.1. Market Analysis, Insights and Forecast - by Treatment Type
- 10. Middle East and Africa Amyotrophic Lateral Sclerosis Industry Analysis, Insights and Forecast, 2020-2032
- 10.1. Market Analysis, Insights and Forecast - by Treatment Type
- 10.1.1. Medication
- 10.1.2. Others
- 10.2. Market Analysis, Insights and Forecast - by Distribution Channel
- 10.2.1. Hospital Pharmacies
- 10.2.2. Retail Pharmacies
- 10.2.3. Others
- 10.1. Market Analysis, Insights and Forecast - by Treatment Type
- 11. South America Amyotrophic Lateral Sclerosis Industry Analysis, Insights and Forecast, 2020-2032
- 11.1. Market Analysis, Insights and Forecast - by Treatment Type
- 11.1.1. Medication
- 11.1.2. Others
- 11.2. Market Analysis, Insights and Forecast - by Distribution Channel
- 11.2.1. Hospital Pharmacies
- 11.2.2. Retail Pharmacies
- 11.2.3. Others
- 11.1. Market Analysis, Insights and Forecast - by Treatment Type
- 12. Competitive Analysis
- 12.1. Company Profiles
- 12.1.1 Boehringer Ingelheim International GmbH
- 12.1.1.1. Company Overview
- 12.1.1.2. Products
- 12.1.1.3. Company Financials
- 12.1.1.4. SWOT Analysis
- 12.1.2 Mitsubishi Tanabe Pharma Corporation
- 12.1.2.1. Company Overview
- 12.1.2.2. Products
- 12.1.2.3. Company Financials
- 12.1.2.4. SWOT Analysis
- 12.1.3 Biogen
- 12.1.3.1. Company Overview
- 12.1.3.2. Products
- 12.1.3.3. Company Financials
- 12.1.3.4. SWOT Analysis
- 12.1.4 Biohaven Pharmaceutical
- 12.1.4.1. Company Overview
- 12.1.4.2. Products
- 12.1.4.3. Company Financials
- 12.1.4.4. SWOT Analysis
- 12.1.5 Amylyx Pharmaceuticals Inc
- 12.1.5.1. Company Overview
- 12.1.5.2. Products
- 12.1.5.3. Company Financials
- 12.1.5.4. SWOT Analysis
- 12.1.6 BrainStorm Cell Limited
- 12.1.6.1. Company Overview
- 12.1.6.2. Products
- 12.1.6.3. Company Financials
- 12.1.6.4. SWOT Analysis
- 12.1.7 Ionis Pharmaceuticals
- 12.1.7.1. Company Overview
- 12.1.7.2. Products
- 12.1.7.3. Company Financials
- 12.1.7.4. SWOT Analysis
- 12.1.8 CORESTEM Inc
- 12.1.8.1. Company Overview
- 12.1.8.2. Products
- 12.1.8.3. Company Financials
- 12.1.8.4. SWOT Analysis
- 12.1.9 ANNEXON INC
- 12.1.9.1. Company Overview
- 12.1.9.2. Products
- 12.1.9.3. Company Financials
- 12.1.9.4. SWOT Analysis
- 12.1.10 AbbVie Inc
- 12.1.10.1. Company Overview
- 12.1.10.2. Products
- 12.1.10.3. Company Financials
- 12.1.10.4. SWOT Analysis
- 12.1.11 CRISPR Therapeutics
- 12.1.11.1. Company Overview
- 12.1.11.2. Products
- 12.1.11.3. Company Financials
- 12.1.11.4. SWOT Analysis
- 12.1.12 Sun Pharmaceutical Industries Ltd
- 12.1.12.1. Company Overview
- 12.1.12.2. Products
- 12.1.12.3. Company Financials
- 12.1.12.4. SWOT Analysis
- 12.1.13 AB Science
- 12.1.13.1. Company Overview
- 12.1.13.2. Products
- 12.1.13.3. Company Financials
- 12.1.13.4. SWOT Analysis
- 12.1.14 Otsuka Pharmaceutical Co Ltd
- 12.1.14.1. Company Overview
- 12.1.14.2. Products
- 12.1.14.3. Company Financials
- 12.1.14.4. SWOT Analysis
- 12.1.1 Boehringer Ingelheim International GmbH
- 12.2. Market Entropy
- 12.2.1 Company's Key Areas Served
- 12.2.2 Recent Developments
- 12.3. Company Market Share Analysis 2025
- 12.3.1 Top 5 Companies Market Share Analysis
- 12.3.2 Top 3 Companies Market Share Analysis
- 12.4. List of Potential Customers
- 13. Research Methodology
List of Figures
- Figure 1: Global Amyotrophic Lateral Sclerosis Industry Revenue Breakdown (billion, %) by Region 2025 & 2033
- Figure 2: Global Amyotrophic Lateral Sclerosis Industry Volume Breakdown (K Unit, %) by Region 2025 & 2033
- Figure 3: North America Amyotrophic Lateral Sclerosis Industry Revenue (billion), by Treatment Type 2025 & 2033
- Figure 4: North America Amyotrophic Lateral Sclerosis Industry Volume (K Unit), by Treatment Type 2025 & 2033
- Figure 5: North America Amyotrophic Lateral Sclerosis Industry Revenue Share (%), by Treatment Type 2025 & 2033
- Figure 6: North America Amyotrophic Lateral Sclerosis Industry Volume Share (%), by Treatment Type 2025 & 2033
- Figure 7: North America Amyotrophic Lateral Sclerosis Industry Revenue (billion), by Distribution Channel 2025 & 2033
- Figure 8: North America Amyotrophic Lateral Sclerosis Industry Volume (K Unit), by Distribution Channel 2025 & 2033
- Figure 9: North America Amyotrophic Lateral Sclerosis Industry Revenue Share (%), by Distribution Channel 2025 & 2033
- Figure 10: North America Amyotrophic Lateral Sclerosis Industry Volume Share (%), by Distribution Channel 2025 & 2033
- Figure 11: North America Amyotrophic Lateral Sclerosis Industry Revenue (billion), by Country 2025 & 2033
- Figure 12: North America Amyotrophic Lateral Sclerosis Industry Volume (K Unit), by Country 2025 & 2033
- Figure 13: North America Amyotrophic Lateral Sclerosis Industry Revenue Share (%), by Country 2025 & 2033
- Figure 14: North America Amyotrophic Lateral Sclerosis Industry Volume Share (%), by Country 2025 & 2033
- Figure 15: Europe Amyotrophic Lateral Sclerosis Industry Revenue (billion), by Treatment Type 2025 & 2033
- Figure 16: Europe Amyotrophic Lateral Sclerosis Industry Volume (K Unit), by Treatment Type 2025 & 2033
- Figure 17: Europe Amyotrophic Lateral Sclerosis Industry Revenue Share (%), by Treatment Type 2025 & 2033
- Figure 18: Europe Amyotrophic Lateral Sclerosis Industry Volume Share (%), by Treatment Type 2025 & 2033
- Figure 19: Europe Amyotrophic Lateral Sclerosis Industry Revenue (billion), by Distribution Channel 2025 & 2033
- Figure 20: Europe Amyotrophic Lateral Sclerosis Industry Volume (K Unit), by Distribution Channel 2025 & 2033
- Figure 21: Europe Amyotrophic Lateral Sclerosis Industry Revenue Share (%), by Distribution Channel 2025 & 2033
- Figure 22: Europe Amyotrophic Lateral Sclerosis Industry Volume Share (%), by Distribution Channel 2025 & 2033
- Figure 23: Europe Amyotrophic Lateral Sclerosis Industry Revenue (billion), by Country 2025 & 2033
- Figure 24: Europe Amyotrophic Lateral Sclerosis Industry Volume (K Unit), by Country 2025 & 2033
- Figure 25: Europe Amyotrophic Lateral Sclerosis Industry Revenue Share (%), by Country 2025 & 2033
- Figure 26: Europe Amyotrophic Lateral Sclerosis Industry Volume Share (%), by Country 2025 & 2033
- Figure 27: Asia Pacific Amyotrophic Lateral Sclerosis Industry Revenue (billion), by Treatment Type 2025 & 2033
- Figure 28: Asia Pacific Amyotrophic Lateral Sclerosis Industry Volume (K Unit), by Treatment Type 2025 & 2033
- Figure 29: Asia Pacific Amyotrophic Lateral Sclerosis Industry Revenue Share (%), by Treatment Type 2025 & 2033
- Figure 30: Asia Pacific Amyotrophic Lateral Sclerosis Industry Volume Share (%), by Treatment Type 2025 & 2033
- Figure 31: Asia Pacific Amyotrophic Lateral Sclerosis Industry Revenue (billion), by Distribution Channel 2025 & 2033
- Figure 32: Asia Pacific Amyotrophic Lateral Sclerosis Industry Volume (K Unit), by Distribution Channel 2025 & 2033
- Figure 33: Asia Pacific Amyotrophic Lateral Sclerosis Industry Revenue Share (%), by Distribution Channel 2025 & 2033
- Figure 34: Asia Pacific Amyotrophic Lateral Sclerosis Industry Volume Share (%), by Distribution Channel 2025 & 2033
- Figure 35: Asia Pacific Amyotrophic Lateral Sclerosis Industry Revenue (billion), by Country 2025 & 2033
- Figure 36: Asia Pacific Amyotrophic Lateral Sclerosis Industry Volume (K Unit), by Country 2025 & 2033
- Figure 37: Asia Pacific Amyotrophic Lateral Sclerosis Industry Revenue Share (%), by Country 2025 & 2033
- Figure 38: Asia Pacific Amyotrophic Lateral Sclerosis Industry Volume Share (%), by Country 2025 & 2033
- Figure 39: Middle East and Africa Amyotrophic Lateral Sclerosis Industry Revenue (billion), by Treatment Type 2025 & 2033
- Figure 40: Middle East and Africa Amyotrophic Lateral Sclerosis Industry Volume (K Unit), by Treatment Type 2025 & 2033
- Figure 41: Middle East and Africa Amyotrophic Lateral Sclerosis Industry Revenue Share (%), by Treatment Type 2025 & 2033
- Figure 42: Middle East and Africa Amyotrophic Lateral Sclerosis Industry Volume Share (%), by Treatment Type 2025 & 2033
- Figure 43: Middle East and Africa Amyotrophic Lateral Sclerosis Industry Revenue (billion), by Distribution Channel 2025 & 2033
- Figure 44: Middle East and Africa Amyotrophic Lateral Sclerosis Industry Volume (K Unit), by Distribution Channel 2025 & 2033
- Figure 45: Middle East and Africa Amyotrophic Lateral Sclerosis Industry Revenue Share (%), by Distribution Channel 2025 & 2033
- Figure 46: Middle East and Africa Amyotrophic Lateral Sclerosis Industry Volume Share (%), by Distribution Channel 2025 & 2033
- Figure 47: Middle East and Africa Amyotrophic Lateral Sclerosis Industry Revenue (billion), by Country 2025 & 2033
- Figure 48: Middle East and Africa Amyotrophic Lateral Sclerosis Industry Volume (K Unit), by Country 2025 & 2033
- Figure 49: Middle East and Africa Amyotrophic Lateral Sclerosis Industry Revenue Share (%), by Country 2025 & 2033
- Figure 50: Middle East and Africa Amyotrophic Lateral Sclerosis Industry Volume Share (%), by Country 2025 & 2033
- Figure 51: South America Amyotrophic Lateral Sclerosis Industry Revenue (billion), by Treatment Type 2025 & 2033
- Figure 52: South America Amyotrophic Lateral Sclerosis Industry Volume (K Unit), by Treatment Type 2025 & 2033
- Figure 53: South America Amyotrophic Lateral Sclerosis Industry Revenue Share (%), by Treatment Type 2025 & 2033
- Figure 54: South America Amyotrophic Lateral Sclerosis Industry Volume Share (%), by Treatment Type 2025 & 2033
- Figure 55: South America Amyotrophic Lateral Sclerosis Industry Revenue (billion), by Distribution Channel 2025 & 2033
- Figure 56: South America Amyotrophic Lateral Sclerosis Industry Volume (K Unit), by Distribution Channel 2025 & 2033
- Figure 57: South America Amyotrophic Lateral Sclerosis Industry Revenue Share (%), by Distribution Channel 2025 & 2033
- Figure 58: South America Amyotrophic Lateral Sclerosis Industry Volume Share (%), by Distribution Channel 2025 & 2033
- Figure 59: South America Amyotrophic Lateral Sclerosis Industry Revenue (billion), by Country 2025 & 2033
- Figure 60: South America Amyotrophic Lateral Sclerosis Industry Volume (K Unit), by Country 2025 & 2033
- Figure 61: South America Amyotrophic Lateral Sclerosis Industry Revenue Share (%), by Country 2025 & 2033
- Figure 62: South America Amyotrophic Lateral Sclerosis Industry Volume Share (%), by Country 2025 & 2033
List of Tables
- Table 1: Global Amyotrophic Lateral Sclerosis Industry Revenue billion Forecast, by Treatment Type 2020 & 2033
- Table 2: Global Amyotrophic Lateral Sclerosis Industry Volume K Unit Forecast, by Treatment Type 2020 & 2033
- Table 3: Global Amyotrophic Lateral Sclerosis Industry Revenue billion Forecast, by Distribution Channel 2020 & 2033
- Table 4: Global Amyotrophic Lateral Sclerosis Industry Volume K Unit Forecast, by Distribution Channel 2020 & 2033
- Table 5: Global Amyotrophic Lateral Sclerosis Industry Revenue billion Forecast, by Region 2020 & 2033
- Table 6: Global Amyotrophic Lateral Sclerosis Industry Volume K Unit Forecast, by Region 2020 & 2033
- Table 7: Global Amyotrophic Lateral Sclerosis Industry Revenue billion Forecast, by Treatment Type 2020 & 2033
- Table 8: Global Amyotrophic Lateral Sclerosis Industry Volume K Unit Forecast, by Treatment Type 2020 & 2033
- Table 9: Global Amyotrophic Lateral Sclerosis Industry Revenue billion Forecast, by Distribution Channel 2020 & 2033
- Table 10: Global Amyotrophic Lateral Sclerosis Industry Volume K Unit Forecast, by Distribution Channel 2020 & 2033
- Table 11: Global Amyotrophic Lateral Sclerosis Industry Revenue billion Forecast, by Country 2020 & 2033
- Table 12: Global Amyotrophic Lateral Sclerosis Industry Volume K Unit Forecast, by Country 2020 & 2033
- Table 13: United States Amyotrophic Lateral Sclerosis Industry Revenue (billion) Forecast, by Application 2020 & 2033
- Table 14: United States Amyotrophic Lateral Sclerosis Industry Volume (K Unit) Forecast, by Application 2020 & 2033
- Table 15: Canada Amyotrophic Lateral Sclerosis Industry Revenue (billion) Forecast, by Application 2020 & 2033
- Table 16: Canada Amyotrophic Lateral Sclerosis Industry Volume (K Unit) Forecast, by Application 2020 & 2033
- Table 17: Mexico Amyotrophic Lateral Sclerosis Industry Revenue (billion) Forecast, by Application 2020 & 2033
- Table 18: Mexico Amyotrophic Lateral Sclerosis Industry Volume (K Unit) Forecast, by Application 2020 & 2033
- Table 19: Global Amyotrophic Lateral Sclerosis Industry Revenue billion Forecast, by Treatment Type 2020 & 2033
- Table 20: Global Amyotrophic Lateral Sclerosis Industry Volume K Unit Forecast, by Treatment Type 2020 & 2033
- Table 21: Global Amyotrophic Lateral Sclerosis Industry Revenue billion Forecast, by Distribution Channel 2020 & 2033
- Table 22: Global Amyotrophic Lateral Sclerosis Industry Volume K Unit Forecast, by Distribution Channel 2020 & 2033
- Table 23: Global Amyotrophic Lateral Sclerosis Industry Revenue billion Forecast, by Country 2020 & 2033
- Table 24: Global Amyotrophic Lateral Sclerosis Industry Volume K Unit Forecast, by Country 2020 & 2033
- Table 25: Germany Amyotrophic Lateral Sclerosis Industry Revenue (billion) Forecast, by Application 2020 & 2033
- Table 26: Germany Amyotrophic Lateral Sclerosis Industry Volume (K Unit) Forecast, by Application 2020 & 2033
- Table 27: United Kingdom Amyotrophic Lateral Sclerosis Industry Revenue (billion) Forecast, by Application 2020 & 2033
- Table 28: United Kingdom Amyotrophic Lateral Sclerosis Industry Volume (K Unit) Forecast, by Application 2020 & 2033
- Table 29: France Amyotrophic Lateral Sclerosis Industry Revenue (billion) Forecast, by Application 2020 & 2033
- Table 30: France Amyotrophic Lateral Sclerosis Industry Volume (K Unit) Forecast, by Application 2020 & 2033
- Table 31: Italy Amyotrophic Lateral Sclerosis Industry Revenue (billion) Forecast, by Application 2020 & 2033
- Table 32: Italy Amyotrophic Lateral Sclerosis Industry Volume (K Unit) Forecast, by Application 2020 & 2033
- Table 33: Spain Amyotrophic Lateral Sclerosis Industry Revenue (billion) Forecast, by Application 2020 & 2033
- Table 34: Spain Amyotrophic Lateral Sclerosis Industry Volume (K Unit) Forecast, by Application 2020 & 2033
- Table 35: Rest of Europe Amyotrophic Lateral Sclerosis Industry Revenue (billion) Forecast, by Application 2020 & 2033
- Table 36: Rest of Europe Amyotrophic Lateral Sclerosis Industry Volume (K Unit) Forecast, by Application 2020 & 2033
- Table 37: Global Amyotrophic Lateral Sclerosis Industry Revenue billion Forecast, by Treatment Type 2020 & 2033
- Table 38: Global Amyotrophic Lateral Sclerosis Industry Volume K Unit Forecast, by Treatment Type 2020 & 2033
- Table 39: Global Amyotrophic Lateral Sclerosis Industry Revenue billion Forecast, by Distribution Channel 2020 & 2033
- Table 40: Global Amyotrophic Lateral Sclerosis Industry Volume K Unit Forecast, by Distribution Channel 2020 & 2033
- Table 41: Global Amyotrophic Lateral Sclerosis Industry Revenue billion Forecast, by Country 2020 & 2033
- Table 42: Global Amyotrophic Lateral Sclerosis Industry Volume K Unit Forecast, by Country 2020 & 2033
- Table 43: China Amyotrophic Lateral Sclerosis Industry Revenue (billion) Forecast, by Application 2020 & 2033
- Table 44: China Amyotrophic Lateral Sclerosis Industry Volume (K Unit) Forecast, by Application 2020 & 2033
- Table 45: Japan Amyotrophic Lateral Sclerosis Industry Revenue (billion) Forecast, by Application 2020 & 2033
- Table 46: Japan Amyotrophic Lateral Sclerosis Industry Volume (K Unit) Forecast, by Application 2020 & 2033
- Table 47: India Amyotrophic Lateral Sclerosis Industry Revenue (billion) Forecast, by Application 2020 & 2033
- Table 48: India Amyotrophic Lateral Sclerosis Industry Volume (K Unit) Forecast, by Application 2020 & 2033
- Table 49: Australia Amyotrophic Lateral Sclerosis Industry Revenue (billion) Forecast, by Application 2020 & 2033
- Table 50: Australia Amyotrophic Lateral Sclerosis Industry Volume (K Unit) Forecast, by Application 2020 & 2033
- Table 51: South Korea Amyotrophic Lateral Sclerosis Industry Revenue (billion) Forecast, by Application 2020 & 2033
- Table 52: South Korea Amyotrophic Lateral Sclerosis Industry Volume (K Unit) Forecast, by Application 2020 & 2033
- Table 53: Rest of Asia Pacific Amyotrophic Lateral Sclerosis Industry Revenue (billion) Forecast, by Application 2020 & 2033
- Table 54: Rest of Asia Pacific Amyotrophic Lateral Sclerosis Industry Volume (K Unit) Forecast, by Application 2020 & 2033
- Table 55: Global Amyotrophic Lateral Sclerosis Industry Revenue billion Forecast, by Treatment Type 2020 & 2033
- Table 56: Global Amyotrophic Lateral Sclerosis Industry Volume K Unit Forecast, by Treatment Type 2020 & 2033
- Table 57: Global Amyotrophic Lateral Sclerosis Industry Revenue billion Forecast, by Distribution Channel 2020 & 2033
- Table 58: Global Amyotrophic Lateral Sclerosis Industry Volume K Unit Forecast, by Distribution Channel 2020 & 2033
- Table 59: Global Amyotrophic Lateral Sclerosis Industry Revenue billion Forecast, by Country 2020 & 2033
- Table 60: Global Amyotrophic Lateral Sclerosis Industry Volume K Unit Forecast, by Country 2020 & 2033
- Table 61: GCC Amyotrophic Lateral Sclerosis Industry Revenue (billion) Forecast, by Application 2020 & 2033
- Table 62: GCC Amyotrophic Lateral Sclerosis Industry Volume (K Unit) Forecast, by Application 2020 & 2033
- Table 63: South Africa Amyotrophic Lateral Sclerosis Industry Revenue (billion) Forecast, by Application 2020 & 2033
- Table 64: South Africa Amyotrophic Lateral Sclerosis Industry Volume (K Unit) Forecast, by Application 2020 & 2033
- Table 65: Rest of Middle East and Africa Amyotrophic Lateral Sclerosis Industry Revenue (billion) Forecast, by Application 2020 & 2033
- Table 66: Rest of Middle East and Africa Amyotrophic Lateral Sclerosis Industry Volume (K Unit) Forecast, by Application 2020 & 2033
- Table 67: Global Amyotrophic Lateral Sclerosis Industry Revenue billion Forecast, by Treatment Type 2020 & 2033
- Table 68: Global Amyotrophic Lateral Sclerosis Industry Volume K Unit Forecast, by Treatment Type 2020 & 2033
- Table 69: Global Amyotrophic Lateral Sclerosis Industry Revenue billion Forecast, by Distribution Channel 2020 & 2033
- Table 70: Global Amyotrophic Lateral Sclerosis Industry Volume K Unit Forecast, by Distribution Channel 2020 & 2033
- Table 71: Global Amyotrophic Lateral Sclerosis Industry Revenue billion Forecast, by Country 2020 & 2033
- Table 72: Global Amyotrophic Lateral Sclerosis Industry Volume K Unit Forecast, by Country 2020 & 2033
- Table 73: Brazil Amyotrophic Lateral Sclerosis Industry Revenue (billion) Forecast, by Application 2020 & 2033
- Table 74: Brazil Amyotrophic Lateral Sclerosis Industry Volume (K Unit) Forecast, by Application 2020 & 2033
- Table 75: Argentina Amyotrophic Lateral Sclerosis Industry Revenue (billion) Forecast, by Application 2020 & 2033
- Table 76: Argentina Amyotrophic Lateral Sclerosis Industry Volume (K Unit) Forecast, by Application 2020 & 2033
- Table 77: Rest of South America Amyotrophic Lateral Sclerosis Industry Revenue (billion) Forecast, by Application 2020 & 2033
- Table 78: Rest of South America Amyotrophic Lateral Sclerosis Industry Volume (K Unit) Forecast, by Application 2020 & 2033
Frequently Asked Questions
1. What is the projected Compound Annual Growth Rate (CAGR) of the Amyotrophic Lateral Sclerosis Industry?
The projected CAGR is approximately 13.84%.
2. Which companies are prominent players in the Amyotrophic Lateral Sclerosis Industry?
Key companies in the market include Boehringer Ingelheim International GmbH, Mitsubishi Tanabe Pharma Corporation, Biogen, Biohaven Pharmaceutical, Amylyx Pharmaceuticals Inc, BrainStorm Cell Limited, Ionis Pharmaceuticals, CORESTEM Inc, ANNEXON INC , AbbVie Inc, CRISPR Therapeutics, Sun Pharmaceutical Industries Ltd, AB Science, Otsuka Pharmaceutical Co Ltd.
3. What are the main segments of the Amyotrophic Lateral Sclerosis Industry?
The market segments include Treatment Type, Distribution Channel.
4. Can you provide details about the market size?
The market size is estimated to be USD 8.77 billion as of 2022.
5. What are some drivers contributing to market growth?
Rising Prevalence of Amyotrophic Lateral Sclerosis; Growing Geriatric Population.
6. What are the notable trends driving market growth?
Medications Are Expected To Witness Healthy Growth Over the Forecast Period.
7. Are there any restraints impacting market growth?
High Cost of Treatment.
8. Can you provide examples of recent developments in the market?
In June 2022, Canada approved Amylyx Pharmaceuticals Inc.'s new drug ALBRIOZA (also known as AMX0035) for amyotrophic lateral sclerosis.
9. What pricing options are available for accessing the report?
Pricing options include single-user, multi-user, and enterprise licenses priced at USD 4750, USD 5250, and USD 8750 respectively.
10. Is the market size provided in terms of value or volume?
The market size is provided in terms of value, measured in billion and volume, measured in K Unit.
11. Are there any specific market keywords associated with the report?
Yes, the market keyword associated with the report is "Amyotrophic Lateral Sclerosis Industry," which aids in identifying and referencing the specific market segment covered.
12. How do I determine which pricing option suits my needs best?
The pricing options vary based on user requirements and access needs. Individual users may opt for single-user licenses, while businesses requiring broader access may choose multi-user or enterprise licenses for cost-effective access to the report.
13. Are there any additional resources or data provided in the Amyotrophic Lateral Sclerosis Industry report?
While the report offers comprehensive insights, it's advisable to review the specific contents or supplementary materials provided to ascertain if additional resources or data are available.
14. How can I stay updated on further developments or reports in the Amyotrophic Lateral Sclerosis Industry?
To stay informed about further developments, trends, and reports in the Amyotrophic Lateral Sclerosis Industry, consider subscribing to industry newsletters, following relevant companies and organizations, or regularly checking reputable industry news sources and publications.
Methodology
Step 1 - Identification of Relevant Samples Size from Population Database


Step 2 - Approaches for Defining Global Market Size (Value, Volume* & Price*)

Note*: In applicable scenarios
Step 3 - Data Sources
Primary Research
- Web Analytics
- Survey Reports
- Research Institute
- Latest Research Reports
- Opinion Leaders
Secondary Research
- Annual Reports
- White Paper
- Latest Press Release
- Industry Association
- Paid Database
- Investor Presentations

Step 4 - Data Triangulation
Involves using different sources of information in order to increase the validity of a study
These sources are likely to be stakeholders in a program - participants, other researchers, program staff, other community members, and so on.
Then we put all data in single framework & apply various statistical tools to find out the dynamic on the market.
During the analysis stage, feedback from the stakeholder groups would be compared to determine areas of agreement as well as areas of divergence