

Key Insights
The Artemisinin Combination Therapy (ACT) market is projected to reach a size of 386.4 million by 2025, growing at a CAGR of 6.69%. This expansion is driven by the increasing global malaria burden, particularly in endemic regions of Africa and Asia, and the critical need for effective treatments. Growing malaria cases, coupled with enhanced government and international aid initiatives for malaria eradication, are significant market drivers. The introduction and adoption of advanced ACT formulations with improved efficacy and reduced resistance potential are also contributing to market growth. Public health organizations and healthcare providers are promoting ACTs as the primary treatment for uncomplicated Plasmodium falciparum malaria, further increasing demand. Heightened public awareness of the benefits of timely and effective malaria treatment also supports market expansion.
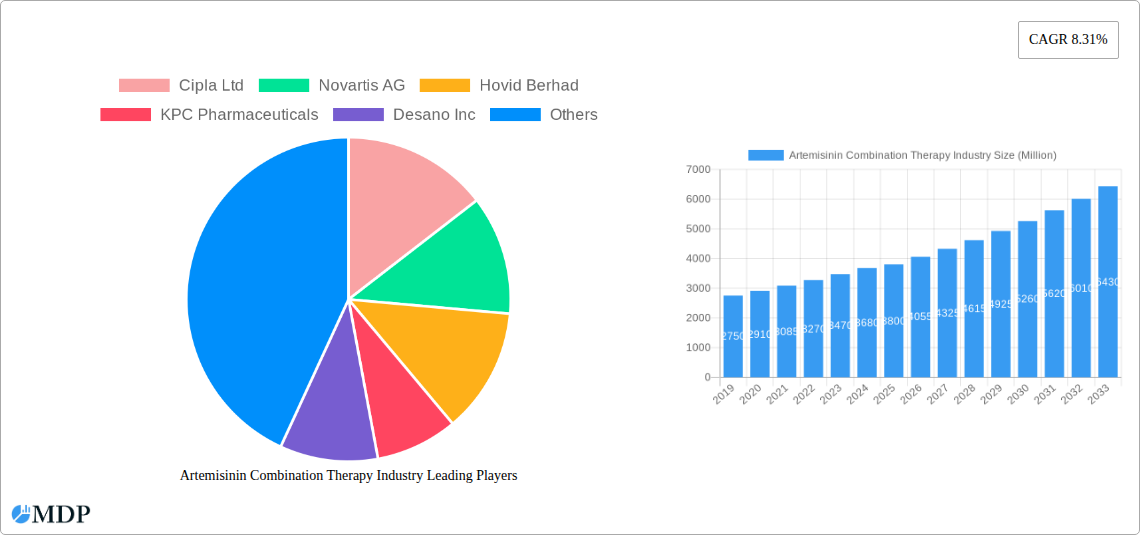
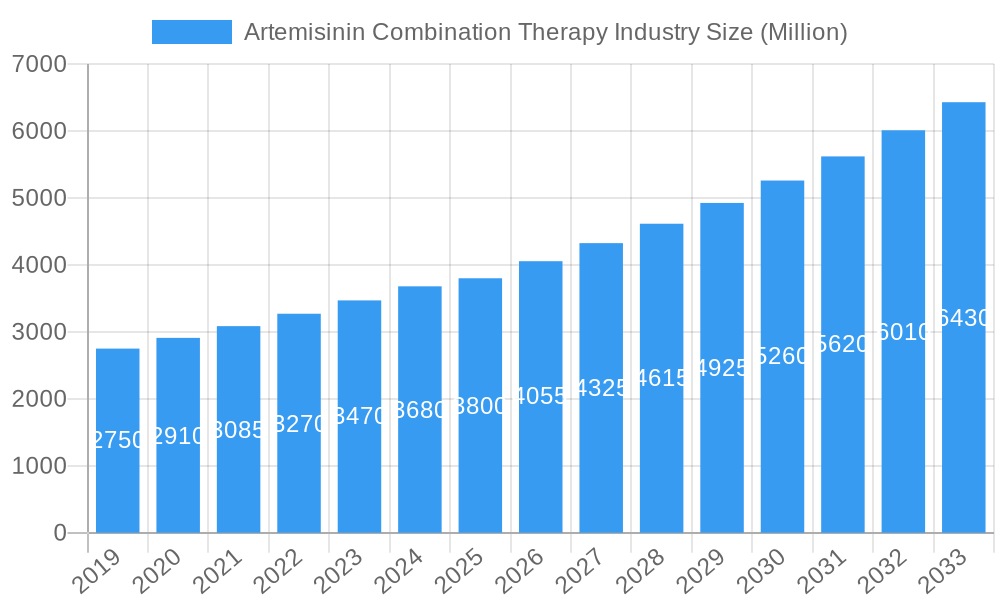
Artemisinin Combination Therapy Industry Market Size (In Million)
Challenges include the emergence of drug resistance, though mitigated by combination therapies and surveillance programs. The cost of advanced ACT formulations can impede adoption in low-income nations, and ensuring consistent supply chains in remote areas poses logistical hurdles. However, advancements in manufacturing, government subsidies, and pharmaceutical companies' efforts to develop affordable ACTs are expected to address these issues. Key segments like Artemether-Lumefantrine and Artesunate-Amodiaquine are anticipated to lead due to proven efficacy and widespread use. Asia Pacific and Africa are expected to remain the dominant markets, driven by high malaria prevalence.
Artemisinin Combination Therapy Industry Company Market Share
Artemisinin Combination Therapy (ACT) Market Report: Comprehensive Analysis and Future Outlook (2019-2033)
Unlock critical insights into the global Artemisinin Combination Therapy (ACT) market with this in-depth report. Covering the period from 2019 to 2033, with a base and estimated year of 2025, this report provides a definitive analysis of market dynamics, emerging trends, leading players, and strategic opportunities. Essential for pharmaceutical companies, public health organizations, investors, and researchers focused on combating malaria and parasitic infections, this report delivers actionable intelligence for informed decision-making.
Artemisinin Combination Therapy Industry Market Dynamics & Concentration
The Artemisinin Combination Therapy (ACT) market is characterized by a moderate level of concentration, with several key players dominating the landscape. Innovation remains a significant driver, propelled by the continuous need for more effective and resistance-combating antimalarial treatments. Regulatory frameworks, primarily established by the World Health Organization (WHO) and national health authorities, play a crucial role in market access and drug approval processes, ensuring the safety and efficacy of ACTs. Product substitutes, while present in the form of older antimalarial drugs or monotherapies, are increasingly being phased out due to emerging resistance patterns. End-user trends are heavily influenced by public health initiatives and funding from organizations like the Global Fund and the Bill & Melinda Gates Foundation, which significantly impact demand and accessibility in endemic regions. Mergers and acquisitions (M&A) activities are relatively limited but can be strategic, often aimed at consolidating market share or acquiring novel drug development capabilities. The market share of the top five players is estimated to be around 60-70%, with M&A deal counts averaging 1-2 significant transactions annually.
Artemisinin Combination Therapy Industry Industry Trends & Analysis
The Artemisinin Combination Therapy (ACT) industry is experiencing robust growth driven by a persistent global demand for effective malaria treatment. The CAGR for the market is projected to be approximately 4.5% during the forecast period (2025–2033). Market penetration of ACTs, particularly in sub-Saharan Africa, remains high, though there are ongoing efforts to expand access in other malaria-endemic regions. Technological disruptions are primarily focused on improving drug formulation for better patient compliance and exploring novel combinations to combat drug resistance. Consumer preferences, while not a direct driver in the public health-dominated ACT market, are indirectly influenced by healthcare provider recommendations and the availability of treatments recommended by global health bodies. Competitive dynamics are shaped by the interplay between generic manufacturers and innovator companies, with a strong emphasis on cost-effectiveness and supply chain reliability. Research and development activities are crucial, focusing on developing next-generation ACTs with extended efficacy and reduced side effects. The increasing burden of malaria in specific regions, coupled with government and non-governmental organization (NGO) funded procurement programs, continues to fuel market expansion. The evolving landscape of parasitic resistance necessitates constant innovation and the introduction of new treatment paradigms.
Leading Markets & Segments in Artemisinin Combination Therapy Industry
The Artemether-Lumefantrine segment currently holds the dominant position in the Artemisinin Combination Therapy (ACT) market, driven by its widespread adoption and recommendation by the World Health Organization (WHO) as a first-line treatment for uncomplicated Plasmodium falciparum malaria. Economic policies in malaria-endemic countries, including government subsidies and procurement strategies, significantly boost the demand for this segment. Infrastructure development, particularly in healthcare delivery systems, further supports the accessibility and distribution of Artemether-Lumefantrine across vast geographical areas.
- Dominance of Artemether-Lumefantrine: This segment benefits from extensive clinical data supporting its efficacy and safety profile, established manufacturing capacities, and a relatively stable supply chain. The cost-effectiveness of Artemether-Lumefantrine formulations makes it a preferred choice for mass treatment campaigns and national malaria control programs, especially in high-burden regions like sub-Saharan Africa.
- Regional Dominance: Sub-Saharan Africa remains the largest and most critical market for ACTs, accounting for over 90% of global malaria cases. Within this region, countries like Nigeria, the Democratic Republic of Congo, and Tanzania are major consumers of Artemether-Lumefantrine.
- Other Significant Segments: While Artemether-Lumefantrine leads, Artesunate-Amodiaquine is also a significant segment, offering an alternative first-line treatment in certain regions. Artesunate-Pyronaridine is gaining traction due to its longer half-life and potential efficacy against resistant strains. Artesunate-Sulfadoxine-Pyrimethamine, though historically important, is now largely relegated to specific indications or regions due to widespread resistance. "Other Combination Therapy Types" encompass emerging combinations and fixed-dose formulations aimed at improving adherence and combating resistance.
Artemisinin Combination Therapy Industry Product Developments
Product development in the Artemisinin Combination Therapy (ACT) market is centered on enhancing treatment efficacy, improving patient compliance, and addressing emerging drug resistance. Innovations include the development of fixed-dose combinations (FDCs) that simplify treatment regimens and reduce the risk of incorrect dosing. Pharmaceutical companies are also investing in research for novel artemisinin derivatives and synergistic partner drugs to create next-generation ACTs. These advancements aim to provide longer-lasting efficacy, broader spectrum activity against different malaria parasite species, and improved safety profiles, ultimately contributing to more effective malaria control strategies.
Key Drivers of Artemisinin Combination Therapy Industry Growth
The growth of the Artemisinin Combination Therapy (ACT) market is primarily driven by the persistent global burden of malaria, particularly in sub-Saharan Africa. Public health initiatives and substantial funding from international organizations like the Global Fund to Fight AIDS, Tuberculosis and Malaria, and the Bill & Melinda Gates Foundation play a pivotal role in procurement and distribution, fueling demand. Regulatory approvals and WHO recommendations for ACTs as the gold standard treatment ensure their continued use and market access. Furthermore, ongoing research and development into novel ACT combinations to combat rising drug resistance are critical growth accelerators, promising enhanced efficacy and sustainability in malaria control efforts.
Challenges in the Artemisinin Combination Therapy Industry Market
Despite its critical role, the Artemisinin Combination Therapy (ACT) market faces significant challenges. The emergence and spread of artemisinin resistance, albeit slow and localized, pose a substantial threat to treatment efficacy. Supply chain disruptions, exacerbated by global events and logistical complexities in reaching remote endemic areas, can lead to stockouts and treatment gaps. Regulatory hurdles in some regions can delay the approval and adoption of new ACT formulations. Competitive pressures from generic manufacturers, while ensuring affordability, can also lead to price erosion, impacting investment in further research and development. The fluctuating availability of raw materials for artemisinin production can also create market volatility.
Emerging Opportunities in Artemisinin Combination Therapy Industry
Emerging opportunities in the Artemisinin Combination Therapy (ACT) industry lie in the development of novel drug combinations that can overcome existing resistance mechanisms and offer broader efficacy against diverse malaria parasite strains. Technological breakthroughs in drug delivery systems, such as long-acting injectables or improved oral formulations, can significantly enhance patient adherence and treatment outcomes. Strategic partnerships between pharmaceutical companies, research institutions, and global health organizations are crucial for accelerating drug discovery, clinical trials, and equitable access to life-saving therapies. Furthermore, the expansion of market access into previously underserved regions and the integration of ACTs into broader infectious disease control programs present substantial growth potential.
Leading Players in the Artemisinin Combination Therapy Industry Sector
- Cipla Ltd
- Novartis AG
- Hovid Berhad
- KPC Pharmaceuticals
- Desano Inc
- Ipca Laboratories Ltd
- Guilin Pharmaceutical (Fosun Pharmaceutical )
- Ajanta Pharma
- Shelys Africa Pharmaceuticals Ltd
- Sanofi S A
Key Milestones in Artemisinin Combination Therapy Industry Industry
- August 2022: Manus Bio received the fourth award from the Bill & Melinda Gates Foundation to develop a scalable production route for the potential antimalarial drug, artemisinin. The USD 2 million award will enable Manus Bio to begin scaling up its unique biological process towards the key chemical intermediate, dihydroartemisinic acid.
- July 2022: India successfully grew the anti-malarial plant 'artemisia', used for developing artemisinin (drug) and its derivatives for treating acute malaria and parasitic worm (helminth) infections.
Strategic Outlook for Artemisinin Combination Therapy Industry Market
The strategic outlook for the Artemisinin Combination Therapy (ACT) market is one of sustained importance and ongoing evolution. The primary focus will remain on ensuring continued access to effective treatments in malaria-endemic regions while actively combating the threat of drug resistance. Investments in research and development for novel ACT combinations and improved drug delivery systems will be crucial for future growth. Strengthening supply chains and fostering robust public-private partnerships will be essential for market expansion and ensuring equitable access. The strategic imperative for stakeholders is to balance affordability with innovation to maintain a decisive advantage in the fight against malaria and other parasitic diseases.
Artemisinin Combination Therapy Industry Segmentation
-
1. Combination Therapy Type
- 1.1. Artemether-Lumefantrine
- 1.2. Artesunate-Amodiaquine
- 1.3. Artesunate-Pyronaridine
- 1.4. Artesunate-Sulfadoxine-Pyrimethamine
- 1.5. Other Combination Therapy Types
Artemisinin Combination Therapy Industry Segmentation By Geography
-
1. North America
- 1.1. United States
- 1.2. Canada
- 1.3. Mexico
-
2. Europe
- 2.1. Germany
- 2.2. United Kingdom
- 2.3. France
- 2.4. Italy
- 2.5. Spain
- 2.6. Rest of Europe
-
3. Asia Pacific
- 3.1. China
- 3.2. Japan
- 3.3. India
- 3.4. Australia
- 3.5. South Korea
- 3.6. Rest of Asia Pacific
-
4. Middle East and Africa
- 4.1. GCC
- 4.2. South Africa
- 4.3. Rest of Middle East and Africa
-
5. South America
- 5.1. Brazil
- 5.2. Argentina
- 5.3. Rest of South America
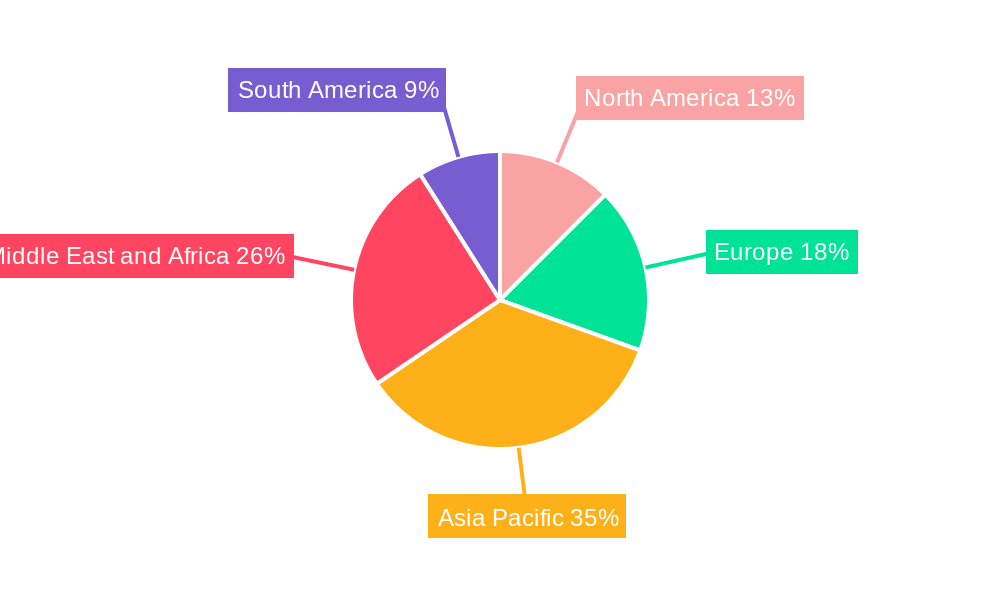
Artemisinin Combination Therapy Industry Regional Market Share
Geographic Coverage of Artemisinin Combination Therapy Industry
Artemisinin Combination Therapy Industry REPORT HIGHLIGHTS
| Aspects | Details |
|---|---|
| Study Period | 2020-2034 |
| Base Year | 2025 |
| Estimated Year | 2026 |
| Forecast Period | 2026-2034 |
| Historical Period | 2020-2025 |
| Growth Rate | CAGR of 6.69% from 2020-2034 |
| Segmentation |
|
Table of Contents
- 1. Introduction
- 1.1. Research Scope
- 1.2. Market Segmentation
- 1.3. Research Objective
- 1.4. Definitions and Assumptions
- 2. Executive Summary
- 2.1. Market Snapshot
- 3. Market Dynamics
- 3.1. Market Drivers
- 3.2. Market Restrains
- 3.3. Market Trends
- 3.4. Market Opportunities
- 4. Market Factor Analysis
- 4.1. Porters Five Forces
- 4.1.1. Bargaining Power of Suppliers
- 4.1.2. Bargaining Power of Buyers
- 4.1.3. Threat of New Entrants
- 4.1.4. Threat of Substitutes
- 4.1.5. Competitive Rivalry
- 4.2. PESTEL analysis
- 4.3. BCG Analysis
- 4.3.1. Stars (High Growth, High Market Share)
- 4.3.2. Cash Cows (Low Growth, High Market Share)
- 4.3.3. Question Mark (High Growth, Low Market Share)
- 4.3.4. Dogs (Low Growth, Low Market Share)
- 4.4. Ansoff Matrix Analysis
- 4.5. Supply Chain Analysis
- 4.6. Regulatory Landscape
- 4.7. Current Market Potential and Opportunity Assessment (TAM–SAM–SOM Framework)
- 4.8. MDP Analyst Note
- 4.1. Porters Five Forces
- 5. Market Analysis, Insights and Forecast 2021-2033
- 5.1. Market Analysis, Insights and Forecast - by Combination Therapy Type
- 5.1.1. Artemether-Lumefantrine
- 5.1.2. Artesunate-Amodiaquine
- 5.1.3. Artesunate-Pyronaridine
- 5.1.4. Artesunate-Sulfadoxine-Pyrimethamine
- 5.1.5. Other Combination Therapy Types
- 5.2. Market Analysis, Insights and Forecast - by Region
- 5.2.1. North America
- 5.2.2. Europe
- 5.2.3. Asia Pacific
- 5.2.4. Middle East and Africa
- 5.2.5. South America
- 5.1. Market Analysis, Insights and Forecast - by Combination Therapy Type
- 6. Global Artemisinin Combination Therapy Industry Analysis, Insights and Forecast, 2021-2033
- 6.1. Market Analysis, Insights and Forecast - by Combination Therapy Type
- 6.1.1. Artemether-Lumefantrine
- 6.1.2. Artesunate-Amodiaquine
- 6.1.3. Artesunate-Pyronaridine
- 6.1.4. Artesunate-Sulfadoxine-Pyrimethamine
- 6.1.5. Other Combination Therapy Types
- 6.1. Market Analysis, Insights and Forecast - by Combination Therapy Type
- 7. North America Artemisinin Combination Therapy Industry Analysis, Insights and Forecast, 2020-2032
- 7.1. Market Analysis, Insights and Forecast - by Combination Therapy Type
- 7.1.1. Artemether-Lumefantrine
- 7.1.2. Artesunate-Amodiaquine
- 7.1.3. Artesunate-Pyronaridine
- 7.1.4. Artesunate-Sulfadoxine-Pyrimethamine
- 7.1.5. Other Combination Therapy Types
- 7.1. Market Analysis, Insights and Forecast - by Combination Therapy Type
- 8. Europe Artemisinin Combination Therapy Industry Analysis, Insights and Forecast, 2020-2032
- 8.1. Market Analysis, Insights and Forecast - by Combination Therapy Type
- 8.1.1. Artemether-Lumefantrine
- 8.1.2. Artesunate-Amodiaquine
- 8.1.3. Artesunate-Pyronaridine
- 8.1.4. Artesunate-Sulfadoxine-Pyrimethamine
- 8.1.5. Other Combination Therapy Types
- 8.1. Market Analysis, Insights and Forecast - by Combination Therapy Type
- 9. Asia Pacific Artemisinin Combination Therapy Industry Analysis, Insights and Forecast, 2020-2032
- 9.1. Market Analysis, Insights and Forecast - by Combination Therapy Type
- 9.1.1. Artemether-Lumefantrine
- 9.1.2. Artesunate-Amodiaquine
- 9.1.3. Artesunate-Pyronaridine
- 9.1.4. Artesunate-Sulfadoxine-Pyrimethamine
- 9.1.5. Other Combination Therapy Types
- 9.1. Market Analysis, Insights and Forecast - by Combination Therapy Type
- 10. Middle East and Africa Artemisinin Combination Therapy Industry Analysis, Insights and Forecast, 2020-2032
- 10.1. Market Analysis, Insights and Forecast - by Combination Therapy Type
- 10.1.1. Artemether-Lumefantrine
- 10.1.2. Artesunate-Amodiaquine
- 10.1.3. Artesunate-Pyronaridine
- 10.1.4. Artesunate-Sulfadoxine-Pyrimethamine
- 10.1.5. Other Combination Therapy Types
- 10.1. Market Analysis, Insights and Forecast - by Combination Therapy Type
- 11. South America Artemisinin Combination Therapy Industry Analysis, Insights and Forecast, 2020-2032
- 11.1. Market Analysis, Insights and Forecast - by Combination Therapy Type
- 11.1.1. Artemether-Lumefantrine
- 11.1.2. Artesunate-Amodiaquine
- 11.1.3. Artesunate-Pyronaridine
- 11.1.4. Artesunate-Sulfadoxine-Pyrimethamine
- 11.1.5. Other Combination Therapy Types
- 11.1. Market Analysis, Insights and Forecast - by Combination Therapy Type
- 12. Competitive Analysis
- 12.1. Company Profiles
- 12.1.1 Cipla Ltd
- 12.1.1.1. Company Overview
- 12.1.1.2. Products
- 12.1.1.3. Company Financials
- 12.1.1.4. SWOT Analysis
- 12.1.2 Novartis AG
- 12.1.2.1. Company Overview
- 12.1.2.2. Products
- 12.1.2.3. Company Financials
- 12.1.2.4. SWOT Analysis
- 12.1.3 Hovid Berhad
- 12.1.3.1. Company Overview
- 12.1.3.2. Products
- 12.1.3.3. Company Financials
- 12.1.3.4. SWOT Analysis
- 12.1.4 KPC Pharmaceuticals
- 12.1.4.1. Company Overview
- 12.1.4.2. Products
- 12.1.4.3. Company Financials
- 12.1.4.4. SWOT Analysis
- 12.1.5 Desano Inc
- 12.1.5.1. Company Overview
- 12.1.5.2. Products
- 12.1.5.3. Company Financials
- 12.1.5.4. SWOT Analysis
- 12.1.6 Ipca Laboratories Ltd
- 12.1.6.1. Company Overview
- 12.1.6.2. Products
- 12.1.6.3. Company Financials
- 12.1.6.4. SWOT Analysis
- 12.1.7 Guilin Pharmaceutical (Fosun Pharmaceutical )
- 12.1.7.1. Company Overview
- 12.1.7.2. Products
- 12.1.7.3. Company Financials
- 12.1.7.4. SWOT Analysis
- 12.1.8 Ajanta Pharma
- 12.1.8.1. Company Overview
- 12.1.8.2. Products
- 12.1.8.3. Company Financials
- 12.1.8.4. SWOT Analysis
- 12.1.9 Shelys Africa Pharmaceuticals Ltd
- 12.1.9.1. Company Overview
- 12.1.9.2. Products
- 12.1.9.3. Company Financials
- 12.1.9.4. SWOT Analysis
- 12.1.10 Sanofi S A
- 12.1.10.1. Company Overview
- 12.1.10.2. Products
- 12.1.10.3. Company Financials
- 12.1.10.4. SWOT Analysis
- 12.1.1 Cipla Ltd
- 12.2. Market Entropy
- 12.2.1 Company's Key Areas Served
- 12.2.2 Recent Developments
- 12.3. Company Market Share Analysis 2025
- 12.3.1 Top 5 Companies Market Share Analysis
- 12.3.2 Top 3 Companies Market Share Analysis
- 12.4. List of Potential Customers
- 13. Research Methodology
List of Figures
- Figure 1: Global Artemisinin Combination Therapy Industry Revenue Breakdown (million, %) by Region 2025 & 2033
- Figure 2: North America Artemisinin Combination Therapy Industry Revenue (million), by Combination Therapy Type 2025 & 2033
- Figure 3: North America Artemisinin Combination Therapy Industry Revenue Share (%), by Combination Therapy Type 2025 & 2033
- Figure 4: North America Artemisinin Combination Therapy Industry Revenue (million), by Country 2025 & 2033
- Figure 5: North America Artemisinin Combination Therapy Industry Revenue Share (%), by Country 2025 & 2033
- Figure 6: Europe Artemisinin Combination Therapy Industry Revenue (million), by Combination Therapy Type 2025 & 2033
- Figure 7: Europe Artemisinin Combination Therapy Industry Revenue Share (%), by Combination Therapy Type 2025 & 2033
- Figure 8: Europe Artemisinin Combination Therapy Industry Revenue (million), by Country 2025 & 2033
- Figure 9: Europe Artemisinin Combination Therapy Industry Revenue Share (%), by Country 2025 & 2033
- Figure 10: Asia Pacific Artemisinin Combination Therapy Industry Revenue (million), by Combination Therapy Type 2025 & 2033
- Figure 11: Asia Pacific Artemisinin Combination Therapy Industry Revenue Share (%), by Combination Therapy Type 2025 & 2033
- Figure 12: Asia Pacific Artemisinin Combination Therapy Industry Revenue (million), by Country 2025 & 2033
- Figure 13: Asia Pacific Artemisinin Combination Therapy Industry Revenue Share (%), by Country 2025 & 2033
- Figure 14: Middle East and Africa Artemisinin Combination Therapy Industry Revenue (million), by Combination Therapy Type 2025 & 2033
- Figure 15: Middle East and Africa Artemisinin Combination Therapy Industry Revenue Share (%), by Combination Therapy Type 2025 & 2033
- Figure 16: Middle East and Africa Artemisinin Combination Therapy Industry Revenue (million), by Country 2025 & 2033
- Figure 17: Middle East and Africa Artemisinin Combination Therapy Industry Revenue Share (%), by Country 2025 & 2033
- Figure 18: South America Artemisinin Combination Therapy Industry Revenue (million), by Combination Therapy Type 2025 & 2033
- Figure 19: South America Artemisinin Combination Therapy Industry Revenue Share (%), by Combination Therapy Type 2025 & 2033
- Figure 20: South America Artemisinin Combination Therapy Industry Revenue (million), by Country 2025 & 2033
- Figure 21: South America Artemisinin Combination Therapy Industry Revenue Share (%), by Country 2025 & 2033
List of Tables
- Table 1: Global Artemisinin Combination Therapy Industry Revenue million Forecast, by Combination Therapy Type 2020 & 2033
- Table 2: Global Artemisinin Combination Therapy Industry Revenue million Forecast, by Region 2020 & 2033
- Table 3: Global Artemisinin Combination Therapy Industry Revenue million Forecast, by Combination Therapy Type 2020 & 2033
- Table 4: Global Artemisinin Combination Therapy Industry Revenue million Forecast, by Country 2020 & 2033
- Table 5: United States Artemisinin Combination Therapy Industry Revenue (million) Forecast, by Application 2020 & 2033
- Table 6: Canada Artemisinin Combination Therapy Industry Revenue (million) Forecast, by Application 2020 & 2033
- Table 7: Mexico Artemisinin Combination Therapy Industry Revenue (million) Forecast, by Application 2020 & 2033
- Table 8: Global Artemisinin Combination Therapy Industry Revenue million Forecast, by Combination Therapy Type 2020 & 2033
- Table 9: Global Artemisinin Combination Therapy Industry Revenue million Forecast, by Country 2020 & 2033
- Table 10: Germany Artemisinin Combination Therapy Industry Revenue (million) Forecast, by Application 2020 & 2033
- Table 11: United Kingdom Artemisinin Combination Therapy Industry Revenue (million) Forecast, by Application 2020 & 2033
- Table 12: France Artemisinin Combination Therapy Industry Revenue (million) Forecast, by Application 2020 & 2033
- Table 13: Italy Artemisinin Combination Therapy Industry Revenue (million) Forecast, by Application 2020 & 2033
- Table 14: Spain Artemisinin Combination Therapy Industry Revenue (million) Forecast, by Application 2020 & 2033
- Table 15: Rest of Europe Artemisinin Combination Therapy Industry Revenue (million) Forecast, by Application 2020 & 2033
- Table 16: Global Artemisinin Combination Therapy Industry Revenue million Forecast, by Combination Therapy Type 2020 & 2033
- Table 17: Global Artemisinin Combination Therapy Industry Revenue million Forecast, by Country 2020 & 2033
- Table 18: China Artemisinin Combination Therapy Industry Revenue (million) Forecast, by Application 2020 & 2033
- Table 19: Japan Artemisinin Combination Therapy Industry Revenue (million) Forecast, by Application 2020 & 2033
- Table 20: India Artemisinin Combination Therapy Industry Revenue (million) Forecast, by Application 2020 & 2033
- Table 21: Australia Artemisinin Combination Therapy Industry Revenue (million) Forecast, by Application 2020 & 2033
- Table 22: South Korea Artemisinin Combination Therapy Industry Revenue (million) Forecast, by Application 2020 & 2033
- Table 23: Rest of Asia Pacific Artemisinin Combination Therapy Industry Revenue (million) Forecast, by Application 2020 & 2033
- Table 24: Global Artemisinin Combination Therapy Industry Revenue million Forecast, by Combination Therapy Type 2020 & 2033
- Table 25: Global Artemisinin Combination Therapy Industry Revenue million Forecast, by Country 2020 & 2033
- Table 26: GCC Artemisinin Combination Therapy Industry Revenue (million) Forecast, by Application 2020 & 2033
- Table 27: South Africa Artemisinin Combination Therapy Industry Revenue (million) Forecast, by Application 2020 & 2033
- Table 28: Rest of Middle East and Africa Artemisinin Combination Therapy Industry Revenue (million) Forecast, by Application 2020 & 2033
- Table 29: Global Artemisinin Combination Therapy Industry Revenue million Forecast, by Combination Therapy Type 2020 & 2033
- Table 30: Global Artemisinin Combination Therapy Industry Revenue million Forecast, by Country 2020 & 2033
- Table 31: Brazil Artemisinin Combination Therapy Industry Revenue (million) Forecast, by Application 2020 & 2033
- Table 32: Argentina Artemisinin Combination Therapy Industry Revenue (million) Forecast, by Application 2020 & 2033
- Table 33: Rest of South America Artemisinin Combination Therapy Industry Revenue (million) Forecast, by Application 2020 & 2033
Frequently Asked Questions
1. What is the projected Compound Annual Growth Rate (CAGR) of the Artemisinin Combination Therapy Industry?
The projected CAGR is approximately 6.69%.
2. Which companies are prominent players in the Artemisinin Combination Therapy Industry?
Key companies in the market include Cipla Ltd, Novartis AG, Hovid Berhad, KPC Pharmaceuticals, Desano Inc, Ipca Laboratories Ltd, Guilin Pharmaceutical (Fosun Pharmaceutical ), Ajanta Pharma, Shelys Africa Pharmaceuticals Ltd, Sanofi S A.
3. What are the main segments of the Artemisinin Combination Therapy Industry?
The market segments include Combination Therapy Type.
4. Can you provide details about the market size?
The market size is estimated to be USD 386.4 million as of 2022.
5. What are some drivers contributing to market growth?
High Prevalence of Malaria in Developing and Under Developed Countries; Awareness Initiatives Undertaken by the Governments; Increasing Research for New Drugs and New Combinations Therapies.
6. What are the notable trends driving market growth?
Artemether-Lumefantrine Segment is Expected to Witness Significant Growth Over the Forecast Period..
7. Are there any restraints impacting market growth?
Side Effects Associated with Artemisinin Combination Therapy (ACT) Coupled with Less Availability of Raw Material for Production of ACTs; Presence of Counterfeit Drugs and Substitutes for ACT.
8. Can you provide examples of recent developments in the market?
August 2022: Manus Bio received the fourth award from the Bill & Melinda Gates Foundation to develop a scalable production route for the potential antimalarial drug, artemisinin. The USD 2 million awards would enable Manus Bio to begin scaling up the unique biological process it has developed towards the key chemical intermediate, dihydroartemisinic acid.
9. What pricing options are available for accessing the report?
Pricing options include single-user, multi-user, and enterprise licenses priced at USD 4750, USD 5250, and USD 8750 respectively.
10. Is the market size provided in terms of value or volume?
The market size is provided in terms of value, measured in million.
11. Are there any specific market keywords associated with the report?
Yes, the market keyword associated with the report is "Artemisinin Combination Therapy Industry," which aids in identifying and referencing the specific market segment covered.
12. How do I determine which pricing option suits my needs best?
The pricing options vary based on user requirements and access needs. Individual users may opt for single-user licenses, while businesses requiring broader access may choose multi-user or enterprise licenses for cost-effective access to the report.
13. Are there any additional resources or data provided in the Artemisinin Combination Therapy Industry report?
While the report offers comprehensive insights, it's advisable to review the specific contents or supplementary materials provided to ascertain if additional resources or data are available.
14. How can I stay updated on further developments or reports in the Artemisinin Combination Therapy Industry?
To stay informed about further developments, trends, and reports in the Artemisinin Combination Therapy Industry, consider subscribing to industry newsletters, following relevant companies and organizations, or regularly checking reputable industry news sources and publications.
Methodology
Step 1 - Identification of Relevant Samples Size from Population Database


Step 2 - Approaches for Defining Global Market Size (Value, Volume* & Price*)

Note*: In applicable scenarios
Step 3 - Data Sources
Primary Research
- Web Analytics
- Survey Reports
- Research Institute
- Latest Research Reports
- Opinion Leaders
Secondary Research
- Annual Reports
- White Paper
- Latest Press Release
- Industry Association
- Paid Database
- Investor Presentations

Step 4 - Data Triangulation
Involves using different sources of information in order to increase the validity of a study
These sources are likely to be stakeholders in a program - participants, other researchers, program staff, other community members, and so on.
Then we put all data in single framework & apply various statistical tools to find out the dynamic on the market.
During the analysis stage, feedback from the stakeholder groups would be compared to determine areas of agreement as well as areas of divergence