

Key Insights
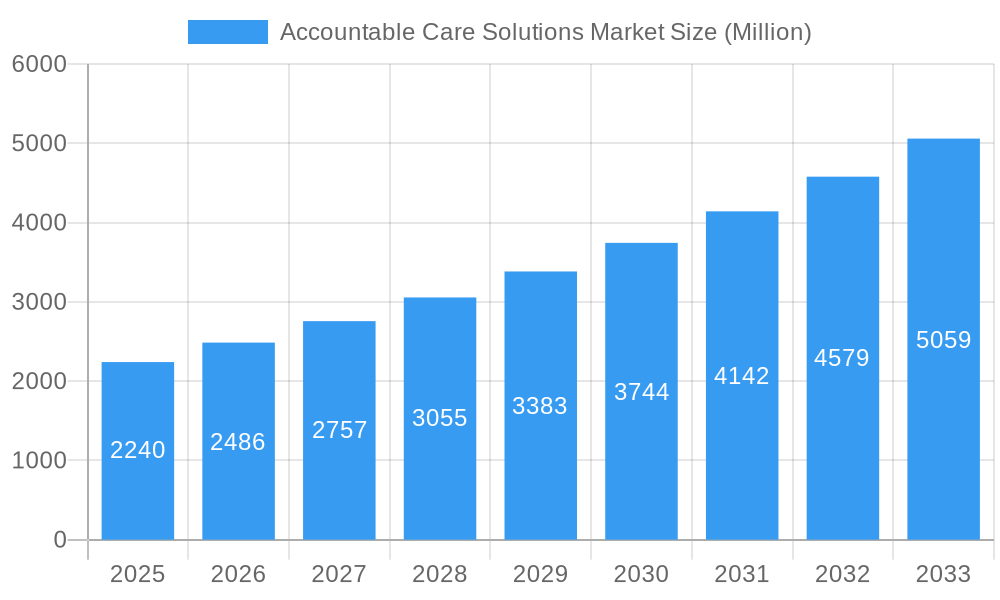
The Accountable Care Solutions Market is poised for substantial growth, projected to reach USD 2.24 billion in 2025 and expand at a robust Compound Annual Growth Rate (CAGR) of 10.92% through 2033. This upward trajectory is primarily fueled by the increasing adoption of value-based care models, designed to improve patient outcomes while controlling costs. Key drivers include the growing demand for integrated healthcare data management, facilitated by Electronic Health/Medical Records (EHR/EMR) systems, and the critical role of Healthcare Analytics in identifying inefficiencies and optimizing treatment pathways. Revenue Cycle Management (RCM) solutions are also witnessing strong demand as healthcare organizations strive to streamline billing, coding, and claims processing, thereby enhancing financial performance. The market's expansion is further supported by advancements in technology, leading to more sophisticated claims and payment management solutions that improve accuracy and reduce administrative burdens.
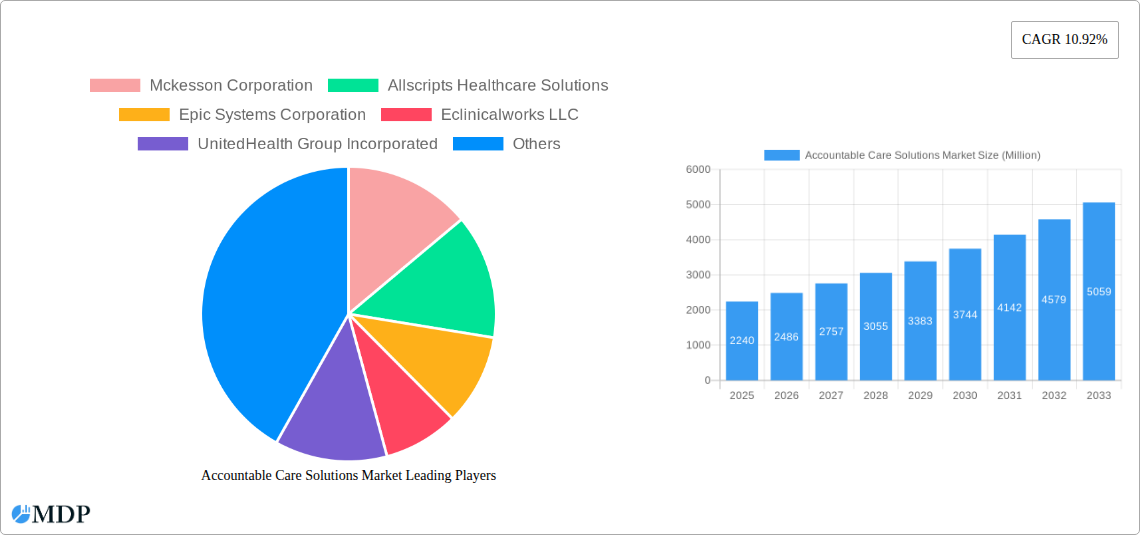
Accountable Care Solutions Market Market Size (In Billion)
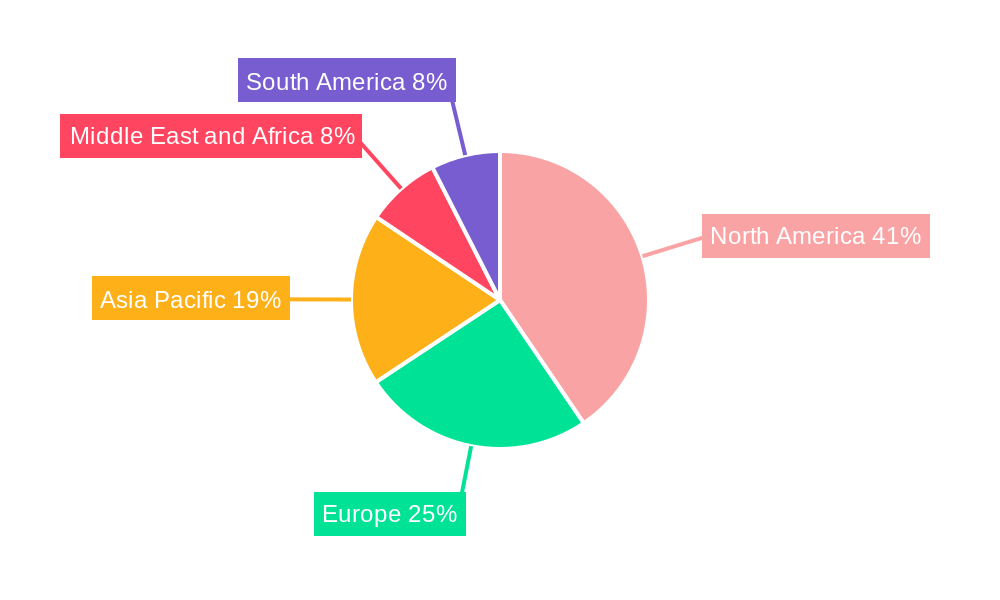
The market is segmented into various product and service offerings, with EHR/EMR systems and Healthcare Analytics representing significant segments. Support and Maintenance Services are also crucial, ensuring the seamless operation of these complex solutions. Deployment models are increasingly shifting towards Web & Cloud-Based solutions, offering scalability, flexibility, and cost-effectiveness compared to traditional On-premise systems. Healthcare Providers are the primary end-users, actively seeking solutions to meet the demands of value-based care, followed by Healthcare Payers who benefit from improved cost containment and quality reporting. Geographically, North America is expected to lead the market, driven by established healthcare infrastructure and early adoption of accountable care initiatives. However, the Asia Pacific region is anticipated to exhibit the fastest growth, propelled by increasing healthcare expenditure and the growing implementation of digital health technologies.
Accountable Care Solutions Market Company Market Share
Accountable Care Solutions Market: Navigating Value-Based Healthcare with Advanced Technology and Strategic Initiatives
This comprehensive report delves into the dynamic Accountable Care Solutions Market, analyzing its trajectory from 2019 to 2033. With a base year of 2025 and a forecast period extending through 2033, this study offers unparalleled insights into the evolving landscape of value-based healthcare. Discover critical market drivers, emerging trends, competitive strategies, and the impact of key industry developments on revenue cycle management, population health, and patient outcomes. This report is essential for healthcare providers, healthcare payers, technology vendors, and investors seeking to capitalize on the $XX Billion accountable care market forecast for 2033.
Accountable Care Solutions Market Market Dynamics & Concentration
The Accountable Care Solutions Market exhibits a dynamic and evolving concentration, driven by technological advancements, stringent regulatory frameworks, and the increasing demand for improved patient outcomes and cost efficiencies. Innovation is a paramount driver, with a continuous push for advanced healthcare analytics and integrated Electronic Health/Medical Records (EHR/EMR) systems that facilitate seamless data sharing and proactive patient management. The regulatory environment, particularly initiatives promoting value-based care models, directly influences market adoption and shapes strategic decision-making for both providers and payers. Product substitutes, while present in fragmented functionalities, are increasingly being consolidated by comprehensive Accountable Care Organization (ACO) software and population health management platforms. End-user trends clearly indicate a preference for solutions that demonstrably improve patient care coordination and reduce per-capita healthcare costs. Mergers and Acquisitions (M&A) activities are shaping market concentration. In the historical period (2019-2024), there were approximately XX M&A deals valued at over $XX Million, indicating a trend towards consolidation among key players. Market share is widely distributed but with a growing influence of larger, integrated solution providers.
Accountable Care Solutions Market Industry Trends & Analysis
The Accountable Care Solutions Market is experiencing robust growth, projected at a Compound Annual Growth Rate (CAGR) of XX% from 2025 to 2033. This expansion is fueled by a confluence of factors including government mandates pushing for value-based reimbursement, the increasing prevalence of chronic diseases requiring coordinated care, and the growing adoption of digital health technologies. Technological disruptions, such as the integration of artificial intelligence (AI) and machine learning (ML) into healthcare analytics platforms, are revolutionizing predictive modeling for patient risk stratification and enabling proactive interventions. Consumer preferences are shifting towards providers who can demonstrate superior care coordination and personalized treatment plans, directly impacting the demand for integrated patient engagement solutions. The competitive landscape is intensifying, with established giants and agile startups vying for market share. Key trends include the rise of cloud-based deployment models, offering enhanced scalability and accessibility, and the increasing focus on revenue cycle management solutions (RCM) that optimize billing and claims processing in fee-for-value environments. Market penetration for comprehensive accountable care solutions is expected to reach XX% by 2033, as more healthcare organizations recognize the strategic imperative to transition from fee-for-service to value-based care models.
Leading Markets & Segments in Accountable Care Solutions Market
The Accountable Care Solutions Market is characterized by dominant regions and segments, each contributing significantly to overall market expansion.
Product & Services:
- Electronic Health/Medical Records (EHR/EMR): This segment is the cornerstone of accountable care, providing the foundational infrastructure for patient data management and care coordination. The increasing interoperability demands and the need for detailed patient histories to support value-based metrics drive its dominance, with an estimated market share of XX%.
- Healthcare Analytics: Critical for identifying care gaps, predicting patient outcomes, and measuring performance against quality metrics, the healthcare analytics segment is experiencing rapid growth. The drive for data-driven decision-making makes this segment indispensable, projected to capture XX% of the market.
- Revenue Cycle Management Solutions (RCM): As reimbursement models shift, efficient RCM becomes paramount. These solutions ensure accurate billing, claims submission, and payment collection, crucial for financial sustainability in value-based care. This segment holds a substantial XX% market share.
- Claims Management Solutions: Streamlining the processing and adjudication of claims is vital for both providers and payers, directly impacting operational efficiency and financial health.
- Payment Management Solutions: Facilitating timely and accurate payments under various value-based arrangements is a growing necessity, driving demand for specialized payment solutions.
- Support and Maintenance Services: Ongoing technical support and updates are crucial for the optimal functioning of all accountable care solutions, representing a consistent revenue stream.
- Other Products & Services: This encompasses emerging technologies and niche solutions contributing to the broader accountable care ecosystem.
Deployment:
- Web & Cloud-Based: This model dominates the market due to its scalability, flexibility, and lower upfront infrastructure costs. Its ability to facilitate remote access and real-time data synchronization makes it ideal for distributed healthcare networks. Expected to hold XX% of the market by 2033.
- On-premise: While still present, its market share is gradually declining as organizations prioritize the agility and cost-effectiveness of cloud solutions.
End User:
- Healthcare Providers: This segment represents the largest end-user group, actively seeking solutions to improve patient care, reduce readmissions, and optimize operational efficiency to thrive under value-based payment models. Their adoption directly fuels market growth.
- Healthcare Payers: Payers are increasingly investing in accountable care solutions to manage costs, improve member health outcomes, and ensure compliance with regulatory requirements.
The dominance of North America, particularly the United States, can be attributed to robust government initiatives supporting value-based care, a high adoption rate of advanced healthcare technologies, and a well-established ecosystem of healthcare providers and payers. Economic policies encouraging efficiency and innovation, coupled with advanced digital healthcare infrastructure, further solidify its leading position.
Accountable Care Solutions Market Product Developments
Product developments in the Accountable Care Solutions Market are increasingly focused on enhancing interoperability, predictive analytics, and patient engagement capabilities. Innovations in AI-powered healthcare analytics are enabling more accurate risk stratification and proactive identification of high-cost patients, leading to better resource allocation and improved outcomes. Advancements in EHR/EMR systems are facilitating seamless data exchange across disparate healthcare entities, crucial for coordinated care. Furthermore, the development of user-friendly patient portals and remote monitoring tools is empowering individuals to take a more active role in their health management. These advancements provide a significant competitive advantage by enabling providers to meet stringent quality measures and achieve financial success under value-based care contracts.
Key Drivers of Accountable Care Solutions Market Growth
The Accountable Care Solutions Market is propelled by several key drivers. Firstly, the widespread adoption of value-based reimbursement models by governments and private payers necessitates efficient solutions for managing patient populations and demonstrating quality outcomes. Secondly, the increasing prevalence of chronic diseases demands integrated care coordination, driving demand for population health management platforms. Thirdly, rapid advancements in healthcare technology, including AI, ML, and cloud computing, are enabling more sophisticated data analysis and personalized patient care. For instance, CMS's introduction of new models like REACH signifies a continued regulatory push towards value-based care. Finally, the growing emphasis on patient engagement and satisfaction encourages the development and adoption of solutions that empower patients and improve their overall experience.
Challenges in the Accountable Care Solutions Market Market
Despite its promising growth, the Accountable Care Solutions Market faces several challenges. A significant hurdle is the complexity of integrating disparate IT systems and achieving true interoperability across different healthcare organizations, leading to data silos and inefficiencies. The substantial upfront investment required for implementing comprehensive solutions can be a barrier for smaller healthcare providers. Furthermore, evolving regulatory landscapes and the need for continuous compliance can create administrative burdens and necessitate ongoing system updates. Lastly, concerns regarding data security and patient privacy, amplified by the increasing volume of sensitive health information being managed, require robust cybersecurity measures and can slow down adoption.
Emerging Opportunities in Accountable Care Solutions Market
Emerging opportunities within the Accountable Care Solutions Market are ripe for innovation and strategic investment. The expansion of telehealth and remote patient monitoring, accelerated by recent global events, presents a significant avenue for growth, enabling continuous patient engagement and proactive intervention outside traditional clinical settings. Strategic partnerships between technology providers, healthcare systems, and payers are crucial for developing integrated solutions that address specific care gaps and population health needs. Furthermore, the increasing focus on health equity and addressing social determinants of health opens up opportunities for solutions that can identify and mitigate disparities in care access and outcomes. The development of predictive analytics tools that can forecast disease outbreaks and optimize resource allocation also represents a significant growth catalyst.
Leading Players in the Accountable Care Solutions Market Sector
- Mckesson Corporation
- Allscripts Healthcare Solutions
- Epic Systems Corporation
- Eclinicalworks LLC
- UnitedHealth Group Incorporated
- Verisk Analytics Inc
- Constellation Software
- IBM Healthcare
- Cerner Corporation
- ZeOmega Inc
- Aetna Inc
- Athenahealth Inc
Key Milestones in Accountable Care Solutions Market Industry
- March 2022: Collaborative Health Systems, a population health management organization, and Community Care Alliance, an accountable care organization, entered into a venture, signaling strategic alliances in the value-based care space.
- March 2022: The Center for Medicare and Medicaid Services introduced a new accountable care model, REACH (Realizing Equity, Access, and Community Health), developed by NAACOS, the National Association of ACOs (CMMI). The Global and Professional Direct Contracting (GPDC) model will be replaced by the REACH model, indicating a significant shift in federal strategy towards equity and community health within accountable care.
Strategic Outlook for Accountable Care Solutions Market Market
The strategic outlook for the Accountable Care Solutions Market remains exceptionally positive, driven by an unwavering global commitment to value-based care. Growth accelerators include the continued evolution of AI and machine learning for enhanced predictive analytics and personalized interventions, further optimizing patient outcomes and cost efficiencies. The increasing demand for integrated platforms that bridge the gap between providers and payers, fostering seamless data exchange and collaborative decision-making, will drive market expansion. Strategic partnerships and M&A activities are expected to continue, leading to market consolidation and the emergence of comprehensive solution providers. The ongoing expansion of cloud-based infrastructure will democratize access to advanced solutions, particularly for smaller healthcare organizations, solidifying the market's trajectory toward a more equitable, efficient, and patient-centric healthcare ecosystem.
Accountable Care Solutions Market Segmentation
-
1. Product & Services
- 1.1. Electronic Health/Medical Records
- 1.2. Healthcare Analytics
- 1.3. Revenue Cycle Management Solutions (RCM)
- 1.4. Claims Management Solutions
- 1.5. Payment Management Solutions
- 1.6. Support and Maintenance Services
- 1.7. Other Products & Services
-
2. Deployment
- 2.1. On-premise
- 2.2. Web & Cloud-Based
-
3. End User
- 3.1. Healthcare Providers
- 3.2. Healthcare Payers
Accountable Care Solutions Market Segmentation By Geography
-
1. North America
- 1.1. United States
- 1.2. Canada
- 1.3. Mexico
-
2. Europe
- 2.1. Germany
- 2.2. United Kingdom
- 2.3. France
- 2.4. Italy
- 2.5. Spain
- 2.6. Rest of Europe
-
3. Asia Pacific
- 3.1. China
- 3.2. Japan
- 3.3. India
- 3.4. Australia
- 3.5. South Korea
- 3.6. Rest of Asia Pacific
-
4. Middle East and Africa
- 4.1. GCC
- 4.2. South Africa
- 4.3. Rest of Middle East and Africa
-
5. South America
- 5.1. Brazil
- 5.2. Argentina
- 5.3. Rest of South America
Accountable Care Solutions Market Regional Market Share
Geographic Coverage of Accountable Care Solutions Market
Accountable Care Solutions Market REPORT HIGHLIGHTS
| Aspects | Details |
|---|---|
| Study Period | 2020-2034 |
| Base Year | 2025 |
| Estimated Year | 2026 |
| Forecast Period | 2026-2034 |
| Historical Period | 2020-2025 |
| Growth Rate | CAGR of 10.92% from 2020-2034 |
| Segmentation |
|
Table of Contents
- 1. Introduction
- 1.1. Research Scope
- 1.2. Market Segmentation
- 1.3. Research Objective
- 1.4. Definitions and Assumptions
- 2. Executive Summary
- 2.1. Market Snapshot
- 3. Market Dynamics
- 3.1. Market Drivers
- 3.2. Market Restrains
- 3.3. Market Trends
- 3.4. Market Opportunities
- 4. Market Factor Analysis
- 4.1. Porters Five Forces
- 4.1.1. Bargaining Power of Suppliers
- 4.1.2. Bargaining Power of Buyers
- 4.1.3. Threat of New Entrants
- 4.1.4. Threat of Substitutes
- 4.1.5. Competitive Rivalry
- 4.2. PESTEL analysis
- 4.3. BCG Analysis
- 4.3.1. Stars (High Growth, High Market Share)
- 4.3.2. Cash Cows (Low Growth, High Market Share)
- 4.3.3. Question Mark (High Growth, Low Market Share)
- 4.3.4. Dogs (Low Growth, Low Market Share)
- 4.4. Ansoff Matrix Analysis
- 4.5. Supply Chain Analysis
- 4.6. Regulatory Landscape
- 4.7. Current Market Potential and Opportunity Assessment (TAM–SAM–SOM Framework)
- 4.8. MDP Analyst Note
- 4.1. Porters Five Forces
- 5. Market Analysis, Insights and Forecast 2021-2033
- 5.1. Market Analysis, Insights and Forecast - by Product & Services
- 5.1.1. Electronic Health/Medical Records
- 5.1.2. Healthcare Analytics
- 5.1.3. Revenue Cycle Management Solutions (RCM)
- 5.1.4. Claims Management Solutions
- 5.1.5. Payment Management Solutions
- 5.1.6. Support and Maintenance Services
- 5.1.7. Other Products & Services
- 5.2. Market Analysis, Insights and Forecast - by Deployment
- 5.2.1. On-premise
- 5.2.2. Web & Cloud-Based
- 5.3. Market Analysis, Insights and Forecast - by End User
- 5.3.1. Healthcare Providers
- 5.3.2. Healthcare Payers
- 5.4. Market Analysis, Insights and Forecast - by Region
- 5.4.1. North America
- 5.4.2. Europe
- 5.4.3. Asia Pacific
- 5.4.4. Middle East and Africa
- 5.4.5. South America
- 5.1. Market Analysis, Insights and Forecast - by Product & Services
- 6. Global Accountable Care Solutions Market Analysis, Insights and Forecast, 2021-2033
- 6.1. Market Analysis, Insights and Forecast - by Product & Services
- 6.1.1. Electronic Health/Medical Records
- 6.1.2. Healthcare Analytics
- 6.1.3. Revenue Cycle Management Solutions (RCM)
- 6.1.4. Claims Management Solutions
- 6.1.5. Payment Management Solutions
- 6.1.6. Support and Maintenance Services
- 6.1.7. Other Products & Services
- 6.2. Market Analysis, Insights and Forecast - by Deployment
- 6.2.1. On-premise
- 6.2.2. Web & Cloud-Based
- 6.3. Market Analysis, Insights and Forecast - by End User
- 6.3.1. Healthcare Providers
- 6.3.2. Healthcare Payers
- 6.1. Market Analysis, Insights and Forecast - by Product & Services
- 7. North America Accountable Care Solutions Market Analysis, Insights and Forecast, 2020-2032
- 7.1. Market Analysis, Insights and Forecast - by Product & Services
- 7.1.1. Electronic Health/Medical Records
- 7.1.2. Healthcare Analytics
- 7.1.3. Revenue Cycle Management Solutions (RCM)
- 7.1.4. Claims Management Solutions
- 7.1.5. Payment Management Solutions
- 7.1.6. Support and Maintenance Services
- 7.1.7. Other Products & Services
- 7.2. Market Analysis, Insights and Forecast - by Deployment
- 7.2.1. On-premise
- 7.2.2. Web & Cloud-Based
- 7.3. Market Analysis, Insights and Forecast - by End User
- 7.3.1. Healthcare Providers
- 7.3.2. Healthcare Payers
- 7.1. Market Analysis, Insights and Forecast - by Product & Services
- 8. Europe Accountable Care Solutions Market Analysis, Insights and Forecast, 2020-2032
- 8.1. Market Analysis, Insights and Forecast - by Product & Services
- 8.1.1. Electronic Health/Medical Records
- 8.1.2. Healthcare Analytics
- 8.1.3. Revenue Cycle Management Solutions (RCM)
- 8.1.4. Claims Management Solutions
- 8.1.5. Payment Management Solutions
- 8.1.6. Support and Maintenance Services
- 8.1.7. Other Products & Services
- 8.2. Market Analysis, Insights and Forecast - by Deployment
- 8.2.1. On-premise
- 8.2.2. Web & Cloud-Based
- 8.3. Market Analysis, Insights and Forecast - by End User
- 8.3.1. Healthcare Providers
- 8.3.2. Healthcare Payers
- 8.1. Market Analysis, Insights and Forecast - by Product & Services
- 9. Asia Pacific Accountable Care Solutions Market Analysis, Insights and Forecast, 2020-2032
- 9.1. Market Analysis, Insights and Forecast - by Product & Services
- 9.1.1. Electronic Health/Medical Records
- 9.1.2. Healthcare Analytics
- 9.1.3. Revenue Cycle Management Solutions (RCM)
- 9.1.4. Claims Management Solutions
- 9.1.5. Payment Management Solutions
- 9.1.6. Support and Maintenance Services
- 9.1.7. Other Products & Services
- 9.2. Market Analysis, Insights and Forecast - by Deployment
- 9.2.1. On-premise
- 9.2.2. Web & Cloud-Based
- 9.3. Market Analysis, Insights and Forecast - by End User
- 9.3.1. Healthcare Providers
- 9.3.2. Healthcare Payers
- 9.1. Market Analysis, Insights and Forecast - by Product & Services
- 10. Middle East and Africa Accountable Care Solutions Market Analysis, Insights and Forecast, 2020-2032
- 10.1. Market Analysis, Insights and Forecast - by Product & Services
- 10.1.1. Electronic Health/Medical Records
- 10.1.2. Healthcare Analytics
- 10.1.3. Revenue Cycle Management Solutions (RCM)
- 10.1.4. Claims Management Solutions
- 10.1.5. Payment Management Solutions
- 10.1.6. Support and Maintenance Services
- 10.1.7. Other Products & Services
- 10.2. Market Analysis, Insights and Forecast - by Deployment
- 10.2.1. On-premise
- 10.2.2. Web & Cloud-Based
- 10.3. Market Analysis, Insights and Forecast - by End User
- 10.3.1. Healthcare Providers
- 10.3.2. Healthcare Payers
- 10.1. Market Analysis, Insights and Forecast - by Product & Services
- 11. South America Accountable Care Solutions Market Analysis, Insights and Forecast, 2020-2032
- 11.1. Market Analysis, Insights and Forecast - by Product & Services
- 11.1.1. Electronic Health/Medical Records
- 11.1.2. Healthcare Analytics
- 11.1.3. Revenue Cycle Management Solutions (RCM)
- 11.1.4. Claims Management Solutions
- 11.1.5. Payment Management Solutions
- 11.1.6. Support and Maintenance Services
- 11.1.7. Other Products & Services
- 11.2. Market Analysis, Insights and Forecast - by Deployment
- 11.2.1. On-premise
- 11.2.2. Web & Cloud-Based
- 11.3. Market Analysis, Insights and Forecast - by End User
- 11.3.1. Healthcare Providers
- 11.3.2. Healthcare Payers
- 11.1. Market Analysis, Insights and Forecast - by Product & Services
- 12. Competitive Analysis
- 12.1. Company Profiles
- 12.1.1 Mckesson Corporation
- 12.1.1.1. Company Overview
- 12.1.1.2. Products
- 12.1.1.3. Company Financials
- 12.1.1.4. SWOT Analysis
- 12.1.2 Allscripts Healthcare Solutions
- 12.1.2.1. Company Overview
- 12.1.2.2. Products
- 12.1.2.3. Company Financials
- 12.1.2.4. SWOT Analysis
- 12.1.3 Epic Systems Corporation
- 12.1.3.1. Company Overview
- 12.1.3.2. Products
- 12.1.3.3. Company Financials
- 12.1.3.4. SWOT Analysis
- 12.1.4 Eclinicalworks LLC
- 12.1.4.1. Company Overview
- 12.1.4.2. Products
- 12.1.4.3. Company Financials
- 12.1.4.4. SWOT Analysis
- 12.1.5 UnitedHealth Group Incorporated
- 12.1.5.1. Company Overview
- 12.1.5.2. Products
- 12.1.5.3. Company Financials
- 12.1.5.4. SWOT Analysis
- 12.1.6 Verisk Analytics Inc
- 12.1.6.1. Company Overview
- 12.1.6.2. Products
- 12.1.6.3. Company Financials
- 12.1.6.4. SWOT Analysis
- 12.1.7 Constellation Software
- 12.1.7.1. Company Overview
- 12.1.7.2. Products
- 12.1.7.3. Company Financials
- 12.1.7.4. SWOT Analysis
- 12.1.8 IBM Healthcare
- 12.1.8.1. Company Overview
- 12.1.8.2. Products
- 12.1.8.3. Company Financials
- 12.1.8.4. SWOT Analysis
- 12.1.9 Cerner Corporation
- 12.1.9.1. Company Overview
- 12.1.9.2. Products
- 12.1.9.3. Company Financials
- 12.1.9.4. SWOT Analysis
- 12.1.10 ZeOmega Inc
- 12.1.10.1. Company Overview
- 12.1.10.2. Products
- 12.1.10.3. Company Financials
- 12.1.10.4. SWOT Analysis
- 12.1.11 Aetna Inc
- 12.1.11.1. Company Overview
- 12.1.11.2. Products
- 12.1.11.3. Company Financials
- 12.1.11.4. SWOT Analysis
- 12.1.12 Athenahealth Inc
- 12.1.12.1. Company Overview
- 12.1.12.2. Products
- 12.1.12.3. Company Financials
- 12.1.12.4. SWOT Analysis
- 12.1.1 Mckesson Corporation
- 12.2. Market Entropy
- 12.2.1 Company's Key Areas Served
- 12.2.2 Recent Developments
- 12.3. Company Market Share Analysis 2025
- 12.3.1 Top 5 Companies Market Share Analysis
- 12.3.2 Top 3 Companies Market Share Analysis
- 12.4. List of Potential Customers
- 13. Research Methodology
List of Figures
- Figure 1: Global Accountable Care Solutions Market Revenue Breakdown (Million, %) by Region 2025 & 2033
- Figure 2: Global Accountable Care Solutions Market Volume Breakdown (K Unit, %) by Region 2025 & 2033
- Figure 3: North America Accountable Care Solutions Market Revenue (Million), by Product & Services 2025 & 2033
- Figure 4: North America Accountable Care Solutions Market Volume (K Unit), by Product & Services 2025 & 2033
- Figure 5: North America Accountable Care Solutions Market Revenue Share (%), by Product & Services 2025 & 2033
- Figure 6: North America Accountable Care Solutions Market Volume Share (%), by Product & Services 2025 & 2033
- Figure 7: North America Accountable Care Solutions Market Revenue (Million), by Deployment 2025 & 2033
- Figure 8: North America Accountable Care Solutions Market Volume (K Unit), by Deployment 2025 & 2033
- Figure 9: North America Accountable Care Solutions Market Revenue Share (%), by Deployment 2025 & 2033
- Figure 10: North America Accountable Care Solutions Market Volume Share (%), by Deployment 2025 & 2033
- Figure 11: North America Accountable Care Solutions Market Revenue (Million), by End User 2025 & 2033
- Figure 12: North America Accountable Care Solutions Market Volume (K Unit), by End User 2025 & 2033
- Figure 13: North America Accountable Care Solutions Market Revenue Share (%), by End User 2025 & 2033
- Figure 14: North America Accountable Care Solutions Market Volume Share (%), by End User 2025 & 2033
- Figure 15: North America Accountable Care Solutions Market Revenue (Million), by Country 2025 & 2033
- Figure 16: North America Accountable Care Solutions Market Volume (K Unit), by Country 2025 & 2033
- Figure 17: North America Accountable Care Solutions Market Revenue Share (%), by Country 2025 & 2033
- Figure 18: North America Accountable Care Solutions Market Volume Share (%), by Country 2025 & 2033
- Figure 19: Europe Accountable Care Solutions Market Revenue (Million), by Product & Services 2025 & 2033
- Figure 20: Europe Accountable Care Solutions Market Volume (K Unit), by Product & Services 2025 & 2033
- Figure 21: Europe Accountable Care Solutions Market Revenue Share (%), by Product & Services 2025 & 2033
- Figure 22: Europe Accountable Care Solutions Market Volume Share (%), by Product & Services 2025 & 2033
- Figure 23: Europe Accountable Care Solutions Market Revenue (Million), by Deployment 2025 & 2033
- Figure 24: Europe Accountable Care Solutions Market Volume (K Unit), by Deployment 2025 & 2033
- Figure 25: Europe Accountable Care Solutions Market Revenue Share (%), by Deployment 2025 & 2033
- Figure 26: Europe Accountable Care Solutions Market Volume Share (%), by Deployment 2025 & 2033
- Figure 27: Europe Accountable Care Solutions Market Revenue (Million), by End User 2025 & 2033
- Figure 28: Europe Accountable Care Solutions Market Volume (K Unit), by End User 2025 & 2033
- Figure 29: Europe Accountable Care Solutions Market Revenue Share (%), by End User 2025 & 2033
- Figure 30: Europe Accountable Care Solutions Market Volume Share (%), by End User 2025 & 2033
- Figure 31: Europe Accountable Care Solutions Market Revenue (Million), by Country 2025 & 2033
- Figure 32: Europe Accountable Care Solutions Market Volume (K Unit), by Country 2025 & 2033
- Figure 33: Europe Accountable Care Solutions Market Revenue Share (%), by Country 2025 & 2033
- Figure 34: Europe Accountable Care Solutions Market Volume Share (%), by Country 2025 & 2033
- Figure 35: Asia Pacific Accountable Care Solutions Market Revenue (Million), by Product & Services 2025 & 2033
- Figure 36: Asia Pacific Accountable Care Solutions Market Volume (K Unit), by Product & Services 2025 & 2033
- Figure 37: Asia Pacific Accountable Care Solutions Market Revenue Share (%), by Product & Services 2025 & 2033
- Figure 38: Asia Pacific Accountable Care Solutions Market Volume Share (%), by Product & Services 2025 & 2033
- Figure 39: Asia Pacific Accountable Care Solutions Market Revenue (Million), by Deployment 2025 & 2033
- Figure 40: Asia Pacific Accountable Care Solutions Market Volume (K Unit), by Deployment 2025 & 2033
- Figure 41: Asia Pacific Accountable Care Solutions Market Revenue Share (%), by Deployment 2025 & 2033
- Figure 42: Asia Pacific Accountable Care Solutions Market Volume Share (%), by Deployment 2025 & 2033
- Figure 43: Asia Pacific Accountable Care Solutions Market Revenue (Million), by End User 2025 & 2033
- Figure 44: Asia Pacific Accountable Care Solutions Market Volume (K Unit), by End User 2025 & 2033
- Figure 45: Asia Pacific Accountable Care Solutions Market Revenue Share (%), by End User 2025 & 2033
- Figure 46: Asia Pacific Accountable Care Solutions Market Volume Share (%), by End User 2025 & 2033
- Figure 47: Asia Pacific Accountable Care Solutions Market Revenue (Million), by Country 2025 & 2033
- Figure 48: Asia Pacific Accountable Care Solutions Market Volume (K Unit), by Country 2025 & 2033
- Figure 49: Asia Pacific Accountable Care Solutions Market Revenue Share (%), by Country 2025 & 2033
- Figure 50: Asia Pacific Accountable Care Solutions Market Volume Share (%), by Country 2025 & 2033
- Figure 51: Middle East and Africa Accountable Care Solutions Market Revenue (Million), by Product & Services 2025 & 2033
- Figure 52: Middle East and Africa Accountable Care Solutions Market Volume (K Unit), by Product & Services 2025 & 2033
- Figure 53: Middle East and Africa Accountable Care Solutions Market Revenue Share (%), by Product & Services 2025 & 2033
- Figure 54: Middle East and Africa Accountable Care Solutions Market Volume Share (%), by Product & Services 2025 & 2033
- Figure 55: Middle East and Africa Accountable Care Solutions Market Revenue (Million), by Deployment 2025 & 2033
- Figure 56: Middle East and Africa Accountable Care Solutions Market Volume (K Unit), by Deployment 2025 & 2033
- Figure 57: Middle East and Africa Accountable Care Solutions Market Revenue Share (%), by Deployment 2025 & 2033
- Figure 58: Middle East and Africa Accountable Care Solutions Market Volume Share (%), by Deployment 2025 & 2033
- Figure 59: Middle East and Africa Accountable Care Solutions Market Revenue (Million), by End User 2025 & 2033
- Figure 60: Middle East and Africa Accountable Care Solutions Market Volume (K Unit), by End User 2025 & 2033
- Figure 61: Middle East and Africa Accountable Care Solutions Market Revenue Share (%), by End User 2025 & 2033
- Figure 62: Middle East and Africa Accountable Care Solutions Market Volume Share (%), by End User 2025 & 2033
- Figure 63: Middle East and Africa Accountable Care Solutions Market Revenue (Million), by Country 2025 & 2033
- Figure 64: Middle East and Africa Accountable Care Solutions Market Volume (K Unit), by Country 2025 & 2033
- Figure 65: Middle East and Africa Accountable Care Solutions Market Revenue Share (%), by Country 2025 & 2033
- Figure 66: Middle East and Africa Accountable Care Solutions Market Volume Share (%), by Country 2025 & 2033
- Figure 67: South America Accountable Care Solutions Market Revenue (Million), by Product & Services 2025 & 2033
- Figure 68: South America Accountable Care Solutions Market Volume (K Unit), by Product & Services 2025 & 2033
- Figure 69: South America Accountable Care Solutions Market Revenue Share (%), by Product & Services 2025 & 2033
- Figure 70: South America Accountable Care Solutions Market Volume Share (%), by Product & Services 2025 & 2033
- Figure 71: South America Accountable Care Solutions Market Revenue (Million), by Deployment 2025 & 2033
- Figure 72: South America Accountable Care Solutions Market Volume (K Unit), by Deployment 2025 & 2033
- Figure 73: South America Accountable Care Solutions Market Revenue Share (%), by Deployment 2025 & 2033
- Figure 74: South America Accountable Care Solutions Market Volume Share (%), by Deployment 2025 & 2033
- Figure 75: South America Accountable Care Solutions Market Revenue (Million), by End User 2025 & 2033
- Figure 76: South America Accountable Care Solutions Market Volume (K Unit), by End User 2025 & 2033
- Figure 77: South America Accountable Care Solutions Market Revenue Share (%), by End User 2025 & 2033
- Figure 78: South America Accountable Care Solutions Market Volume Share (%), by End User 2025 & 2033
- Figure 79: South America Accountable Care Solutions Market Revenue (Million), by Country 2025 & 2033
- Figure 80: South America Accountable Care Solutions Market Volume (K Unit), by Country 2025 & 2033
- Figure 81: South America Accountable Care Solutions Market Revenue Share (%), by Country 2025 & 2033
- Figure 82: South America Accountable Care Solutions Market Volume Share (%), by Country 2025 & 2033
List of Tables
- Table 1: Global Accountable Care Solutions Market Revenue Million Forecast, by Product & Services 2020 & 2033
- Table 2: Global Accountable Care Solutions Market Volume K Unit Forecast, by Product & Services 2020 & 2033
- Table 3: Global Accountable Care Solutions Market Revenue Million Forecast, by Deployment 2020 & 2033
- Table 4: Global Accountable Care Solutions Market Volume K Unit Forecast, by Deployment 2020 & 2033
- Table 5: Global Accountable Care Solutions Market Revenue Million Forecast, by End User 2020 & 2033
- Table 6: Global Accountable Care Solutions Market Volume K Unit Forecast, by End User 2020 & 2033
- Table 7: Global Accountable Care Solutions Market Revenue Million Forecast, by Region 2020 & 2033
- Table 8: Global Accountable Care Solutions Market Volume K Unit Forecast, by Region 2020 & 2033
- Table 9: Global Accountable Care Solutions Market Revenue Million Forecast, by Product & Services 2020 & 2033
- Table 10: Global Accountable Care Solutions Market Volume K Unit Forecast, by Product & Services 2020 & 2033
- Table 11: Global Accountable Care Solutions Market Revenue Million Forecast, by Deployment 2020 & 2033
- Table 12: Global Accountable Care Solutions Market Volume K Unit Forecast, by Deployment 2020 & 2033
- Table 13: Global Accountable Care Solutions Market Revenue Million Forecast, by End User 2020 & 2033
- Table 14: Global Accountable Care Solutions Market Volume K Unit Forecast, by End User 2020 & 2033
- Table 15: Global Accountable Care Solutions Market Revenue Million Forecast, by Country 2020 & 2033
- Table 16: Global Accountable Care Solutions Market Volume K Unit Forecast, by Country 2020 & 2033
- Table 17: United States Accountable Care Solutions Market Revenue (Million) Forecast, by Application 2020 & 2033
- Table 18: United States Accountable Care Solutions Market Volume (K Unit) Forecast, by Application 2020 & 2033
- Table 19: Canada Accountable Care Solutions Market Revenue (Million) Forecast, by Application 2020 & 2033
- Table 20: Canada Accountable Care Solutions Market Volume (K Unit) Forecast, by Application 2020 & 2033
- Table 21: Mexico Accountable Care Solutions Market Revenue (Million) Forecast, by Application 2020 & 2033
- Table 22: Mexico Accountable Care Solutions Market Volume (K Unit) Forecast, by Application 2020 & 2033
- Table 23: Global Accountable Care Solutions Market Revenue Million Forecast, by Product & Services 2020 & 2033
- Table 24: Global Accountable Care Solutions Market Volume K Unit Forecast, by Product & Services 2020 & 2033
- Table 25: Global Accountable Care Solutions Market Revenue Million Forecast, by Deployment 2020 & 2033
- Table 26: Global Accountable Care Solutions Market Volume K Unit Forecast, by Deployment 2020 & 2033
- Table 27: Global Accountable Care Solutions Market Revenue Million Forecast, by End User 2020 & 2033
- Table 28: Global Accountable Care Solutions Market Volume K Unit Forecast, by End User 2020 & 2033
- Table 29: Global Accountable Care Solutions Market Revenue Million Forecast, by Country 2020 & 2033
- Table 30: Global Accountable Care Solutions Market Volume K Unit Forecast, by Country 2020 & 2033
- Table 31: Germany Accountable Care Solutions Market Revenue (Million) Forecast, by Application 2020 & 2033
- Table 32: Germany Accountable Care Solutions Market Volume (K Unit) Forecast, by Application 2020 & 2033
- Table 33: United Kingdom Accountable Care Solutions Market Revenue (Million) Forecast, by Application 2020 & 2033
- Table 34: United Kingdom Accountable Care Solutions Market Volume (K Unit) Forecast, by Application 2020 & 2033
- Table 35: France Accountable Care Solutions Market Revenue (Million) Forecast, by Application 2020 & 2033
- Table 36: France Accountable Care Solutions Market Volume (K Unit) Forecast, by Application 2020 & 2033
- Table 37: Italy Accountable Care Solutions Market Revenue (Million) Forecast, by Application 2020 & 2033
- Table 38: Italy Accountable Care Solutions Market Volume (K Unit) Forecast, by Application 2020 & 2033
- Table 39: Spain Accountable Care Solutions Market Revenue (Million) Forecast, by Application 2020 & 2033
- Table 40: Spain Accountable Care Solutions Market Volume (K Unit) Forecast, by Application 2020 & 2033
- Table 41: Rest of Europe Accountable Care Solutions Market Revenue (Million) Forecast, by Application 2020 & 2033
- Table 42: Rest of Europe Accountable Care Solutions Market Volume (K Unit) Forecast, by Application 2020 & 2033
- Table 43: Global Accountable Care Solutions Market Revenue Million Forecast, by Product & Services 2020 & 2033
- Table 44: Global Accountable Care Solutions Market Volume K Unit Forecast, by Product & Services 2020 & 2033
- Table 45: Global Accountable Care Solutions Market Revenue Million Forecast, by Deployment 2020 & 2033
- Table 46: Global Accountable Care Solutions Market Volume K Unit Forecast, by Deployment 2020 & 2033
- Table 47: Global Accountable Care Solutions Market Revenue Million Forecast, by End User 2020 & 2033
- Table 48: Global Accountable Care Solutions Market Volume K Unit Forecast, by End User 2020 & 2033
- Table 49: Global Accountable Care Solutions Market Revenue Million Forecast, by Country 2020 & 2033
- Table 50: Global Accountable Care Solutions Market Volume K Unit Forecast, by Country 2020 & 2033
- Table 51: China Accountable Care Solutions Market Revenue (Million) Forecast, by Application 2020 & 2033
- Table 52: China Accountable Care Solutions Market Volume (K Unit) Forecast, by Application 2020 & 2033
- Table 53: Japan Accountable Care Solutions Market Revenue (Million) Forecast, by Application 2020 & 2033
- Table 54: Japan Accountable Care Solutions Market Volume (K Unit) Forecast, by Application 2020 & 2033
- Table 55: India Accountable Care Solutions Market Revenue (Million) Forecast, by Application 2020 & 2033
- Table 56: India Accountable Care Solutions Market Volume (K Unit) Forecast, by Application 2020 & 2033
- Table 57: Australia Accountable Care Solutions Market Revenue (Million) Forecast, by Application 2020 & 2033
- Table 58: Australia Accountable Care Solutions Market Volume (K Unit) Forecast, by Application 2020 & 2033
- Table 59: South Korea Accountable Care Solutions Market Revenue (Million) Forecast, by Application 2020 & 2033
- Table 60: South Korea Accountable Care Solutions Market Volume (K Unit) Forecast, by Application 2020 & 2033
- Table 61: Rest of Asia Pacific Accountable Care Solutions Market Revenue (Million) Forecast, by Application 2020 & 2033
- Table 62: Rest of Asia Pacific Accountable Care Solutions Market Volume (K Unit) Forecast, by Application 2020 & 2033
- Table 63: Global Accountable Care Solutions Market Revenue Million Forecast, by Product & Services 2020 & 2033
- Table 64: Global Accountable Care Solutions Market Volume K Unit Forecast, by Product & Services 2020 & 2033
- Table 65: Global Accountable Care Solutions Market Revenue Million Forecast, by Deployment 2020 & 2033
- Table 66: Global Accountable Care Solutions Market Volume K Unit Forecast, by Deployment 2020 & 2033
- Table 67: Global Accountable Care Solutions Market Revenue Million Forecast, by End User 2020 & 2033
- Table 68: Global Accountable Care Solutions Market Volume K Unit Forecast, by End User 2020 & 2033
- Table 69: Global Accountable Care Solutions Market Revenue Million Forecast, by Country 2020 & 2033
- Table 70: Global Accountable Care Solutions Market Volume K Unit Forecast, by Country 2020 & 2033
- Table 71: GCC Accountable Care Solutions Market Revenue (Million) Forecast, by Application 2020 & 2033
- Table 72: GCC Accountable Care Solutions Market Volume (K Unit) Forecast, by Application 2020 & 2033
- Table 73: South Africa Accountable Care Solutions Market Revenue (Million) Forecast, by Application 2020 & 2033
- Table 74: South Africa Accountable Care Solutions Market Volume (K Unit) Forecast, by Application 2020 & 2033
- Table 75: Rest of Middle East and Africa Accountable Care Solutions Market Revenue (Million) Forecast, by Application 2020 & 2033
- Table 76: Rest of Middle East and Africa Accountable Care Solutions Market Volume (K Unit) Forecast, by Application 2020 & 2033
- Table 77: Global Accountable Care Solutions Market Revenue Million Forecast, by Product & Services 2020 & 2033
- Table 78: Global Accountable Care Solutions Market Volume K Unit Forecast, by Product & Services 2020 & 2033
- Table 79: Global Accountable Care Solutions Market Revenue Million Forecast, by Deployment 2020 & 2033
- Table 80: Global Accountable Care Solutions Market Volume K Unit Forecast, by Deployment 2020 & 2033
- Table 81: Global Accountable Care Solutions Market Revenue Million Forecast, by End User 2020 & 2033
- Table 82: Global Accountable Care Solutions Market Volume K Unit Forecast, by End User 2020 & 2033
- Table 83: Global Accountable Care Solutions Market Revenue Million Forecast, by Country 2020 & 2033
- Table 84: Global Accountable Care Solutions Market Volume K Unit Forecast, by Country 2020 & 2033
- Table 85: Brazil Accountable Care Solutions Market Revenue (Million) Forecast, by Application 2020 & 2033
- Table 86: Brazil Accountable Care Solutions Market Volume (K Unit) Forecast, by Application 2020 & 2033
- Table 87: Argentina Accountable Care Solutions Market Revenue (Million) Forecast, by Application 2020 & 2033
- Table 88: Argentina Accountable Care Solutions Market Volume (K Unit) Forecast, by Application 2020 & 2033
- Table 89: Rest of South America Accountable Care Solutions Market Revenue (Million) Forecast, by Application 2020 & 2033
- Table 90: Rest of South America Accountable Care Solutions Market Volume (K Unit) Forecast, by Application 2020 & 2033
Frequently Asked Questions
1. What is the projected Compound Annual Growth Rate (CAGR) of the Accountable Care Solutions Market?
The projected CAGR is approximately 10.92%.
2. Which companies are prominent players in the Accountable Care Solutions Market?
Key companies in the market include Mckesson Corporation, Allscripts Healthcare Solutions, Epic Systems Corporation, Eclinicalworks LLC, UnitedHealth Group Incorporated, Verisk Analytics Inc, Constellation Software, IBM Healthcare, Cerner Corporation, ZeOmega Inc, Aetna Inc, Athenahealth Inc.
3. What are the main segments of the Accountable Care Solutions Market?
The market segments include Product & Services, Deployment, End User.
4. Can you provide details about the market size?
The market size is estimated to be USD 2.24 Million as of 2022.
5. What are some drivers contributing to market growth?
Emergence of Big Data in Healthcare; Government Regulations and Initiatives to Promote Patient-Centric Care; Increasing Demand to Curtail Healthcare Costs.
6. What are the notable trends driving market growth?
Electronic Health/Medical Records Segment is Expected to Hold a Significant Market Share Over the Forecast Period.
7. Are there any restraints impacting market growth?
Data Security and Privacy Concerns; High Investments Required for Supporting Infrastructure.
8. Can you provide examples of recent developments in the market?
In March 2022, Collaborative Health Systems, a population health management organization, and Community Care Alliance, an accountable care organization, entered into a venture.
9. What pricing options are available for accessing the report?
Pricing options include single-user, multi-user, and enterprise licenses priced at USD 4750, USD 5250, and USD 8750 respectively.
10. Is the market size provided in terms of value or volume?
The market size is provided in terms of value, measured in Million and volume, measured in K Unit.
11. Are there any specific market keywords associated with the report?
Yes, the market keyword associated with the report is "Accountable Care Solutions Market," which aids in identifying and referencing the specific market segment covered.
12. How do I determine which pricing option suits my needs best?
The pricing options vary based on user requirements and access needs. Individual users may opt for single-user licenses, while businesses requiring broader access may choose multi-user or enterprise licenses for cost-effective access to the report.
13. Are there any additional resources or data provided in the Accountable Care Solutions Market report?
While the report offers comprehensive insights, it's advisable to review the specific contents or supplementary materials provided to ascertain if additional resources or data are available.
14. How can I stay updated on further developments or reports in the Accountable Care Solutions Market?
To stay informed about further developments, trends, and reports in the Accountable Care Solutions Market, consider subscribing to industry newsletters, following relevant companies and organizations, or regularly checking reputable industry news sources and publications.
Methodology
Step 1 - Identification of Relevant Samples Size from Population Database


Step 2 - Approaches for Defining Global Market Size (Value, Volume* & Price*)

Note*: In applicable scenarios
Step 3 - Data Sources
Primary Research
- Web Analytics
- Survey Reports
- Research Institute
- Latest Research Reports
- Opinion Leaders
Secondary Research
- Annual Reports
- White Paper
- Latest Press Release
- Industry Association
- Paid Database
- Investor Presentations

Step 4 - Data Triangulation
Involves using different sources of information in order to increase the validity of a study
These sources are likely to be stakeholders in a program - participants, other researchers, program staff, other community members, and so on.
Then we put all data in single framework & apply various statistical tools to find out the dynamic on the market.
During the analysis stage, feedback from the stakeholder groups would be compared to determine areas of agreement as well as areas of divergence