

Key Insights
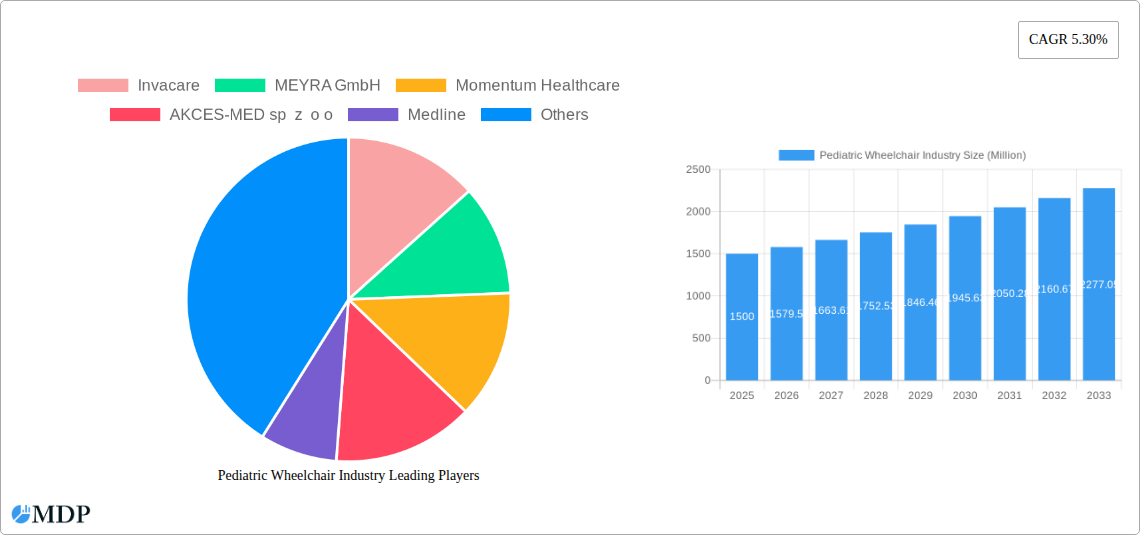
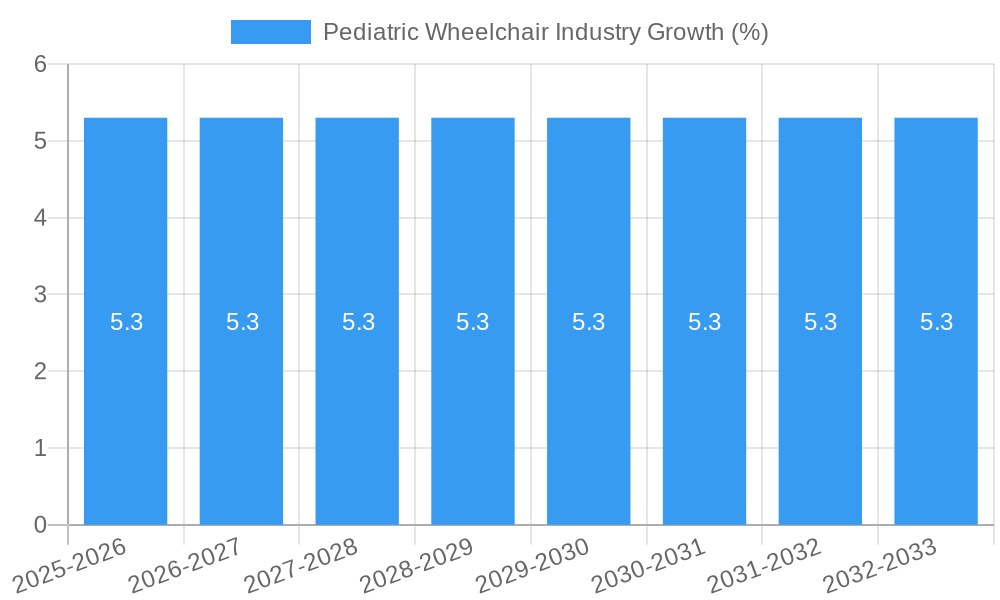
The global pediatric wheelchair market is poised for significant expansion, projected to reach an estimated USD 1,500 million by 2025, with a robust Compound Annual Growth Rate (CAGR) of 5.30% through 2033. This growth is primarily fueled by the increasing prevalence of congenital disorders and disabilities among children, coupled with a growing awareness among parents and healthcare providers regarding the benefits of advanced mobility solutions. The rising adoption of powered wheelchairs, driven by their enhanced maneuverability and user-friendliness for children with severe mobility impairments, is a key product segment contributor. Furthermore, advancements in wheelchair design, incorporating lightweight materials, ergonomic features, and customizable options tailored to the specific needs of growing children, are significantly boosting market demand. The expanding healthcare infrastructure, particularly in emerging economies, and the increasing focus on inclusive education and community participation for children with special needs are also instrumental in driving market growth.
The market landscape is characterized by a dynamic interplay of drivers and restraints, with technological innovation and a growing emphasis on personalized care serving as significant growth accelerators. The "homecare setting" segment is witnessing substantial expansion as parents increasingly opt for home-based rehabilitation and care, necessitating specialized pediatric mobility devices. While the market benefits from strong demand, challenges such as the high cost of advanced pediatric wheelchairs and reimbursement issues in certain regions present potential restraints. However, strategic collaborations between manufacturers and healthcare institutions, along with increasing government initiatives to support the procurement of assistive devices, are helping to mitigate these challenges. Key industry players are focusing on research and development to introduce innovative, cost-effective, and child-centric wheelchair solutions, further shaping the competitive environment and ensuring sustained market vitality.
Gain unparalleled insights into the global pediatric wheelchair market with this comprehensive report. Covering the historical period of 2019–2024 and extending to a detailed forecast up to 2033, with a base and estimated year of 2025, this report is your definitive guide to understanding market dynamics, key players, and future growth trajectories. The market is projected to witness substantial expansion, driven by increasing awareness of child mobility solutions, advancements in assistive technology, and a growing number of pediatric disabilities.
Pediatric Wheelchair Industry Market Dynamics & Concentration
The pediatric wheelchair industry exhibits a moderate to high market concentration, with leading companies like Invacare, MEYRA GmbH, Momentum Healthcare, AKCES-MED sp z o o, Medline, SORG Rollstuhltechnik GmbH, Ottobock, Permobil, and Sunrise Medical holding significant market share. Innovation is a primary driver, fueled by the demand for lightweight, highly adjustable, and user-friendly mobility solutions for children. Regulatory frameworks, particularly those concerning medical device safety and accessibility standards, play a crucial role in shaping product development and market entry. While direct product substitutes are limited, advancements in alternative mobility aids and therapies present indirect competition. End-user trends lean towards personalized solutions that adapt to a child's growth and specific needs. Mergers and acquisitions (M&A) activities, though not at an exceptionally high volume, are strategic for key players seeking to expand their product portfolios and geographical reach. The M&A deal count is estimated to be between 5-10 transactions annually within the broader assistive device market, with a focused segment on pediatric solutions. Market share for the top five players is estimated to be over 60% of the global pediatric wheelchair market.
Pediatric Wheelchair Industry Industry Trends & Analysis
The pediatric wheelchair industry is poised for robust growth, with a projected Compound Annual Growth Rate (CAGR) of approximately 6.5% during the forecast period of 2025–2033. This expansion is propelled by several converging factors. Firstly, increasing global awareness and diagnosis rates of pediatric disabilities, including cerebral palsy, spina bifida, and muscular dystrophy, are creating a larger addressable market. This demographic shift necessitates advanced and specialized mobility aids. Secondly, significant technological disruptions are reshaping the product landscape. Innovations in lightweight materials, advanced ergonomics, and smart features such as powered mobility assistance are enhancing user comfort, independence, and functionality for children. The integration of IoT and AI in future wheelchair designs is also anticipated, offering advanced monitoring and control capabilities. Consumer preferences are increasingly shifting towards customized and adaptive solutions. Parents and caregivers are seeking wheelchairs that not only provide essential support but also accommodate a child's rapid growth, ensuring long-term usability and comfort. This has led to a surge in demand for modular and adjustable designs. The competitive dynamics within the industry are characterized by a blend of established global players and emerging regional manufacturers. Competition is intensifying around product innovation, affordability, and after-sales service. Market penetration is steadily increasing in developed economies due to higher healthcare spending and greater adoption of assistive technologies, while emerging economies present a significant untapped potential for growth, driven by improving healthcare infrastructure and rising disposable incomes. The current market penetration of specialized pediatric wheelchairs is estimated at around 35-40% in developed nations, with significant room for expansion in developing regions. The demand for powered wheelchairs is growing at a faster pace than manual wheelchairs due to increased functionality and independence offered to children with more severe mobility impairments.
Leading Markets & Segments in Pediatric Wheelchair Industry
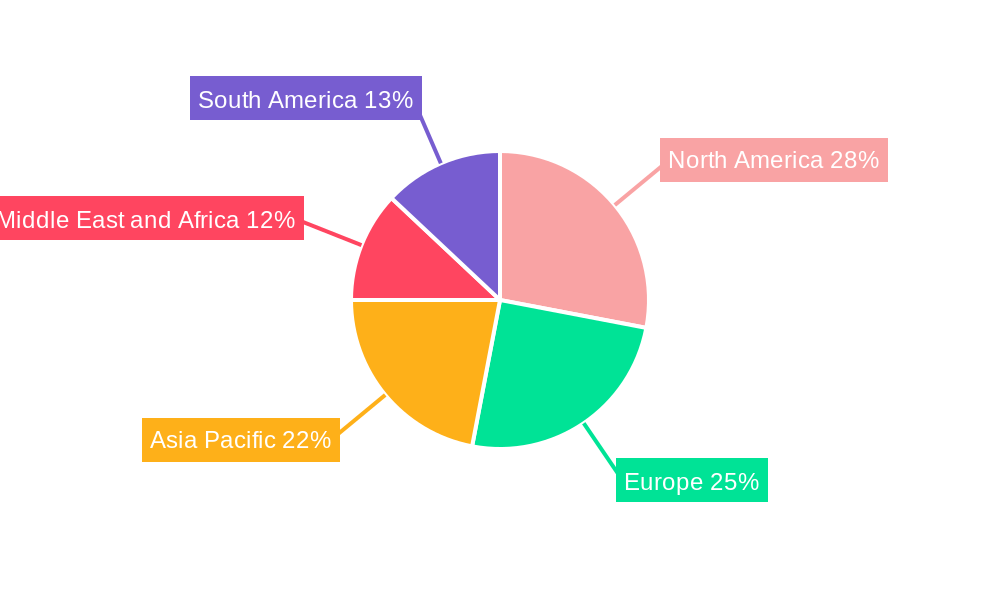
North America is currently the dominant region in the pediatric wheelchair industry, driven by high per capita healthcare expenditure, advanced technological adoption, and strong government initiatives supporting accessibility for individuals with disabilities. Within North America, the United States stands out as a leading country, accounting for a substantial portion of the market share. The "Homecare Setting" segment is experiencing the most significant growth in terms of end-user application. This trend is attributed to a growing preference for home-based care and rehabilitation, supported by evolving healthcare policies and the increasing need for devices that facilitate a child's integration into their daily life and educational environments.
Product Type Dominance:
- Manual Wheelchairs: While powered wheelchairs are gaining traction, manual pediatric wheelchairs continue to hold a significant market share due to their affordability, simplicity, and portability, especially for less severe mobility impairments.
- Powered Wheelchairs: The demand for powered wheelchairs is surging, particularly for children with complex needs requiring greater independence and ease of mobility. Technological advancements in battery life and control systems are further fueling this segment.
Frame Type Dominance:
- Foldable Wheelchairs: These are highly favored for their practicality in transportation and storage, aligning with the active lifestyles of children and their families.
- Rigid Wheelchairs: While less common for general use, rigid frame wheelchairs are often preferred for specialized therapeutic needs where maximum stability and postural support are paramount.
End User Dominance:
- Homecare Setting: This segment is the primary growth engine, driven by the increasing trend of home-based rehabilitation and the desire for children to use mobility aids in familiar and comfortable environments. Key drivers include supportive insurance policies and the availability of advanced pediatric care within the home.
- Hospitals: Hospitals remain crucial as they are often the initial point of diagnosis and prescription for pediatric wheelchairs, particularly for acute care and rehabilitation services.
- Other End Users: This includes educational institutions, rehabilitation centers, and specialized pediatric care facilities, all contributing to the overall market demand.
Pediatric Wheelchair Industry Product Developments
Recent product developments in the pediatric wheelchair industry are heavily focused on customization, adjustability, and enhanced user experience. Innovations like Karma Medical's Flexx Adapt, launched in September 2022, exemplify this trend. This highly adjustable pediatric wheelchair is designed to "grow with the child," offering a safe, supportive, and comfortable mobility solution that adapts over time. Companies are investing in lightweight materials, intuitive controls for powered models, and advanced ergonomic designs to improve posture and reduce the risk of secondary complications. These developments aim to provide children with greater independence and enable seamless integration into their daily activities, from school to social engagements. The competitive advantage lies in offering a holistic solution that addresses the evolving physical and functional needs of pediatric users.
Key Drivers of Pediatric Wheelchair Industry Growth
The pediatric wheelchair industry is propelled by several interconnected growth drivers. A primary catalyst is the increasing prevalence of pediatric disabilities globally, leading to a greater demand for assistive devices. Advances in medical technology and rehabilitation sciences are making specialized pediatric wheelchairs more effective and accessible. Furthermore, supportive government policies and insurance coverage for mobility aids significantly influence market growth by improving affordability for end-users. The growing awareness among parents and caregivers about the benefits of early intervention and appropriate mobility support also plays a crucial role. For instance, initiatives aimed at improving access to assistive technology in educational settings are driving demand.
Challenges in the Pediatric Wheelchair Industry Market
Despite robust growth, the pediatric wheelchair industry faces several challenges. High manufacturing costs, particularly for advanced and customized models, can lead to significant price points, creating affordability barriers for some segments of the population. Regulatory hurdles and lengthy approval processes for new medical devices can slow down innovation and market entry. Supply chain disruptions, as witnessed in recent global events, can impact the availability of components and finished products. Intense competition, both from established players and newer entrants, puts pressure on profit margins and necessitates continuous investment in research and development. The lack of standardized reimbursement policies across different regions also poses a significant challenge.
Emerging Opportunities in Pediatric Wheelchair Industry
Emerging opportunities in the pediatric wheelchair industry are largely driven by technological breakthroughs and strategic market expansion. The integration of smart technologies, such as IoT sensors for remote monitoring and AI-powered navigation systems, presents a significant avenue for product differentiation and value addition. Strategic partnerships between wheelchair manufacturers and technology companies can accelerate the development of these advanced solutions. Furthermore, the growing demand for lightweight, foldable, and aesthetically appealing wheelchairs reflects a shift towards user-centric designs that blend functionality with modern aesthetics. Expansion into emerging economies, where the prevalence of pediatric disabilities is high and access to advanced mobility solutions is currently limited, offers substantial untapped market potential.
Leading Players in the Pediatric Wheelchair Industry Sector
- Invacare
- MEYRA GmbH
- Momentum Healthcare
- AKCES-MED sp z o o
- Medline
- SORG Rollstuhltechnik GmbH
- Ottobock
- Permobil
- Sunrise Medical
Key Milestones in Pediatric Wheelchair Industry Industry
- September 2022: Mobility solution manufacturer Karma Medical launched the Flexx Adapt, a highly adjustable pediatric wheelchair, at Rehacare 2022 in Dusseldorf, Germany. This product is designed to grow with the child, offering enhanced safety, support, and comfort.
- May 2022: The Comprehensive Rehabilitation Center for Children and Adolescents (CRINA) received a donation of 107 pediatric wheelchairs from the United States government, significantly improving mobility access for children in need.
Strategic Outlook for Pediatric Wheelchair Industry Market
The strategic outlook for the pediatric wheelchair industry remains highly positive, fueled by ongoing technological advancements and a persistent demand for improved child mobility solutions. Future growth will be accelerated by the continued integration of smart technologies, such as AI and IoT, to create more adaptive and user-friendly wheelchairs. Focus on lightweight materials and modular designs that cater to the dynamic needs of growing children will be paramount. Strategic partnerships with healthcare providers and research institutions will be crucial for validating new technologies and ensuring market acceptance. Furthermore, expanding reach into underserved emerging markets through localized manufacturing and distribution channels presents a significant opportunity for sustained market penetration and long-term growth. The industry is expected to witness increased innovation in powered mobility and customized seating solutions, enhancing the quality of life for children with disabilities.
Pediatric Wheelchair Industry Segmentation
-
1. Product Type
- 1.1. Manual
- 1.2. Powered
-
2. Frame Type
- 2.1. Rigid Wheelchairs
- 2.2. Foldable Wheelchairs
-
3. End User
- 3.1. Hopsitals
- 3.2. Homecare Setting
- 3.3. Other End Users
Pediatric Wheelchair Industry Segmentation By Geography
-
1. North America
- 1.1. United States
- 1.2. Canada
- 1.3. Mexico
-
2. Europe
- 2.1. Germany
- 2.2. United Kingdom
- 2.3. France
- 2.4. Italy
- 2.5. Spain
- 2.6. Rest of Europe
-
3. Asia Pacific
- 3.1. China
- 3.2. Japan
- 3.3. India
- 3.4. Australia
- 3.5. South Korea
- 3.6. Rest of Asia Pacific
-
4. Middle East and Africa
- 4.1. GCC
- 4.2. South Africa
- 4.3. Rest of Middle East and Africa
-
5. South America
- 5.1. Brazil
- 5.2. Argentina
- 5.3. Rest of South America
Pediatric Wheelchair Industry REPORT HIGHLIGHTS
| Aspects | Details |
|---|---|
| Study Period | 2019-2033 |
| Base Year | 2024 |
| Estimated Year | 2025 |
| Forecast Period | 2025-2033 |
| Historical Period | 2019-2024 |
| Growth Rate | CAGR of 5.30% from 2019-2033 |
| Segmentation |
|
Table of Contents
- 1. Introduction
- 1.1. Research Scope
- 1.2. Market Segmentation
- 1.3. Research Methodology
- 1.4. Definitions and Assumptions
- 2. Executive Summary
- 2.1. Introduction
- 3. Market Dynamics
- 3.1. Introduction
- 3.2. Market Drivers
- 3.2.1. Rising Incidences of Disabilities in Children; Supportive Government Policies and Funding
- 3.3. Market Restrains
- 3.3.1. High Cost of Paediatric Wheelchairs
- 3.4. Market Trends
- 3.4.1. Manual Wheelchairs Segment Dominates the Market and is Expected to do so in the Forecast Period
- 4. Market Factor Analysis
- 4.1. Porters Five Forces
- 4.2. Supply/Value Chain
- 4.3. PESTEL analysis
- 4.4. Market Entropy
- 4.5. Patent/Trademark Analysis
- 5. Global Pediatric Wheelchair Industry Analysis, Insights and Forecast, 2019-2031
- 5.1. Market Analysis, Insights and Forecast - by Product Type
- 5.1.1. Manual
- 5.1.2. Powered
- 5.2. Market Analysis, Insights and Forecast - by Frame Type
- 5.2.1. Rigid Wheelchairs
- 5.2.2. Foldable Wheelchairs
- 5.3. Market Analysis, Insights and Forecast - by End User
- 5.3.1. Hopsitals
- 5.3.2. Homecare Setting
- 5.3.3. Other End Users
- 5.4. Market Analysis, Insights and Forecast - by Region
- 5.4.1. North America
- 5.4.2. Europe
- 5.4.3. Asia Pacific
- 5.4.4. Middle East and Africa
- 5.4.5. South America
- 5.1. Market Analysis, Insights and Forecast - by Product Type
- 6. North America Pediatric Wheelchair Industry Analysis, Insights and Forecast, 2019-2031
- 6.1. Market Analysis, Insights and Forecast - by Product Type
- 6.1.1. Manual
- 6.1.2. Powered
- 6.2. Market Analysis, Insights and Forecast - by Frame Type
- 6.2.1. Rigid Wheelchairs
- 6.2.2. Foldable Wheelchairs
- 6.3. Market Analysis, Insights and Forecast - by End User
- 6.3.1. Hopsitals
- 6.3.2. Homecare Setting
- 6.3.3. Other End Users
- 6.1. Market Analysis, Insights and Forecast - by Product Type
- 7. Europe Pediatric Wheelchair Industry Analysis, Insights and Forecast, 2019-2031
- 7.1. Market Analysis, Insights and Forecast - by Product Type
- 7.1.1. Manual
- 7.1.2. Powered
- 7.2. Market Analysis, Insights and Forecast - by Frame Type
- 7.2.1. Rigid Wheelchairs
- 7.2.2. Foldable Wheelchairs
- 7.3. Market Analysis, Insights and Forecast - by End User
- 7.3.1. Hopsitals
- 7.3.2. Homecare Setting
- 7.3.3. Other End Users
- 7.1. Market Analysis, Insights and Forecast - by Product Type
- 8. Asia Pacific Pediatric Wheelchair Industry Analysis, Insights and Forecast, 2019-2031
- 8.1. Market Analysis, Insights and Forecast - by Product Type
- 8.1.1. Manual
- 8.1.2. Powered
- 8.2. Market Analysis, Insights and Forecast - by Frame Type
- 8.2.1. Rigid Wheelchairs
- 8.2.2. Foldable Wheelchairs
- 8.3. Market Analysis, Insights and Forecast - by End User
- 8.3.1. Hopsitals
- 8.3.2. Homecare Setting
- 8.3.3. Other End Users
- 8.1. Market Analysis, Insights and Forecast - by Product Type
- 9. Middle East and Africa Pediatric Wheelchair Industry Analysis, Insights and Forecast, 2019-2031
- 9.1. Market Analysis, Insights and Forecast - by Product Type
- 9.1.1. Manual
- 9.1.2. Powered
- 9.2. Market Analysis, Insights and Forecast - by Frame Type
- 9.2.1. Rigid Wheelchairs
- 9.2.2. Foldable Wheelchairs
- 9.3. Market Analysis, Insights and Forecast - by End User
- 9.3.1. Hopsitals
- 9.3.2. Homecare Setting
- 9.3.3. Other End Users
- 9.1. Market Analysis, Insights and Forecast - by Product Type
- 10. South America Pediatric Wheelchair Industry Analysis, Insights and Forecast, 2019-2031
- 10.1. Market Analysis, Insights and Forecast - by Product Type
- 10.1.1. Manual
- 10.1.2. Powered
- 10.2. Market Analysis, Insights and Forecast - by Frame Type
- 10.2.1. Rigid Wheelchairs
- 10.2.2. Foldable Wheelchairs
- 10.3. Market Analysis, Insights and Forecast - by End User
- 10.3.1. Hopsitals
- 10.3.2. Homecare Setting
- 10.3.3. Other End Users
- 10.1. Market Analysis, Insights and Forecast - by Product Type
- 11. North America Pediatric Wheelchair Industry Analysis, Insights and Forecast, 2019-2031
- 11.1. Market Analysis, Insights and Forecast - By Country/Sub-region
- 11.1.1 United States
- 11.1.2 Canada
- 11.1.3 Mexico
- 12. Europe Pediatric Wheelchair Industry Analysis, Insights and Forecast, 2019-2031
- 12.1. Market Analysis, Insights and Forecast - By Country/Sub-region
- 12.1.1 Germany
- 12.1.2 United Kingdom
- 12.1.3 France
- 12.1.4 Italy
- 12.1.5 Spain
- 12.1.6 Rest of Europe
- 13. Asia Pacific Pediatric Wheelchair Industry Analysis, Insights and Forecast, 2019-2031
- 13.1. Market Analysis, Insights and Forecast - By Country/Sub-region
- 13.1.1 China
- 13.1.2 Japan
- 13.1.3 India
- 13.1.4 Australia
- 13.1.5 South Korea
- 13.1.6 Rest of Asia Pacific
- 14. Middle East and Africa Pediatric Wheelchair Industry Analysis, Insights and Forecast, 2019-2031
- 14.1. Market Analysis, Insights and Forecast - By Country/Sub-region
- 14.1.1 GCC
- 14.1.2 South Africa
- 14.1.3 Rest of Middle East and Africa
- 15. South America Pediatric Wheelchair Industry Analysis, Insights and Forecast, 2019-2031
- 15.1. Market Analysis, Insights and Forecast - By Country/Sub-region
- 15.1.1 Brazil
- 15.1.2 Argentina
- 15.1.3 Rest of South America
- 16. Competitive Analysis
- 16.1. Global Market Share Analysis 2024
- 16.2. Company Profiles
- 16.2.1 Invacare
- 16.2.1.1. Overview
- 16.2.1.2. Products
- 16.2.1.3. SWOT Analysis
- 16.2.1.4. Recent Developments
- 16.2.1.5. Financials (Based on Availability)
- 16.2.2 MEYRA GmbH
- 16.2.2.1. Overview
- 16.2.2.2. Products
- 16.2.2.3. SWOT Analysis
- 16.2.2.4. Recent Developments
- 16.2.2.5. Financials (Based on Availability)
- 16.2.3 Momentum Healthcare
- 16.2.3.1. Overview
- 16.2.3.2. Products
- 16.2.3.3. SWOT Analysis
- 16.2.3.4. Recent Developments
- 16.2.3.5. Financials (Based on Availability)
- 16.2.4 AKCES-MED sp z o o
- 16.2.4.1. Overview
- 16.2.4.2. Products
- 16.2.4.3. SWOT Analysis
- 16.2.4.4. Recent Developments
- 16.2.4.5. Financials (Based on Availability)
- 16.2.5 Medline
- 16.2.5.1. Overview
- 16.2.5.2. Products
- 16.2.5.3. SWOT Analysis
- 16.2.5.4. Recent Developments
- 16.2.5.5. Financials (Based on Availability)
- 16.2.6 SORG Rollstuhltechnik GmbH
- 16.2.6.1. Overview
- 16.2.6.2. Products
- 16.2.6.3. SWOT Analysis
- 16.2.6.4. Recent Developments
- 16.2.6.5. Financials (Based on Availability)
- 16.2.7 Ottobock
- 16.2.7.1. Overview
- 16.2.7.2. Products
- 16.2.7.3. SWOT Analysis
- 16.2.7.4. Recent Developments
- 16.2.7.5. Financials (Based on Availability)
- 16.2.8 Permobil
- 16.2.8.1. Overview
- 16.2.8.2. Products
- 16.2.8.3. SWOT Analysis
- 16.2.8.4. Recent Developments
- 16.2.8.5. Financials (Based on Availability)
- 16.2.9 Sunrise Medical
- 16.2.9.1. Overview
- 16.2.9.2. Products
- 16.2.9.3. SWOT Analysis
- 16.2.9.4. Recent Developments
- 16.2.9.5. Financials (Based on Availability)
- 16.2.1 Invacare
List of Figures
- Figure 1: Global Pediatric Wheelchair Industry Revenue Breakdown (Million, %) by Region 2024 & 2032
- Figure 2: Global Pediatric Wheelchair Industry Volume Breakdown (K Unit, %) by Region 2024 & 2032
- Figure 3: North America Pediatric Wheelchair Industry Revenue (Million), by Country 2024 & 2032
- Figure 4: North America Pediatric Wheelchair Industry Volume (K Unit), by Country 2024 & 2032
- Figure 5: North America Pediatric Wheelchair Industry Revenue Share (%), by Country 2024 & 2032
- Figure 6: North America Pediatric Wheelchair Industry Volume Share (%), by Country 2024 & 2032
- Figure 7: Europe Pediatric Wheelchair Industry Revenue (Million), by Country 2024 & 2032
- Figure 8: Europe Pediatric Wheelchair Industry Volume (K Unit), by Country 2024 & 2032
- Figure 9: Europe Pediatric Wheelchair Industry Revenue Share (%), by Country 2024 & 2032
- Figure 10: Europe Pediatric Wheelchair Industry Volume Share (%), by Country 2024 & 2032
- Figure 11: Asia Pacific Pediatric Wheelchair Industry Revenue (Million), by Country 2024 & 2032
- Figure 12: Asia Pacific Pediatric Wheelchair Industry Volume (K Unit), by Country 2024 & 2032
- Figure 13: Asia Pacific Pediatric Wheelchair Industry Revenue Share (%), by Country 2024 & 2032
- Figure 14: Asia Pacific Pediatric Wheelchair Industry Volume Share (%), by Country 2024 & 2032
- Figure 15: Middle East and Africa Pediatric Wheelchair Industry Revenue (Million), by Country 2024 & 2032
- Figure 16: Middle East and Africa Pediatric Wheelchair Industry Volume (K Unit), by Country 2024 & 2032
- Figure 17: Middle East and Africa Pediatric Wheelchair Industry Revenue Share (%), by Country 2024 & 2032
- Figure 18: Middle East and Africa Pediatric Wheelchair Industry Volume Share (%), by Country 2024 & 2032
- Figure 19: South America Pediatric Wheelchair Industry Revenue (Million), by Country 2024 & 2032
- Figure 20: South America Pediatric Wheelchair Industry Volume (K Unit), by Country 2024 & 2032
- Figure 21: South America Pediatric Wheelchair Industry Revenue Share (%), by Country 2024 & 2032
- Figure 22: South America Pediatric Wheelchair Industry Volume Share (%), by Country 2024 & 2032
- Figure 23: North America Pediatric Wheelchair Industry Revenue (Million), by Product Type 2024 & 2032
- Figure 24: North America Pediatric Wheelchair Industry Volume (K Unit), by Product Type 2024 & 2032
- Figure 25: North America Pediatric Wheelchair Industry Revenue Share (%), by Product Type 2024 & 2032
- Figure 26: North America Pediatric Wheelchair Industry Volume Share (%), by Product Type 2024 & 2032
- Figure 27: North America Pediatric Wheelchair Industry Revenue (Million), by Frame Type 2024 & 2032
- Figure 28: North America Pediatric Wheelchair Industry Volume (K Unit), by Frame Type 2024 & 2032
- Figure 29: North America Pediatric Wheelchair Industry Revenue Share (%), by Frame Type 2024 & 2032
- Figure 30: North America Pediatric Wheelchair Industry Volume Share (%), by Frame Type 2024 & 2032
- Figure 31: North America Pediatric Wheelchair Industry Revenue (Million), by End User 2024 & 2032
- Figure 32: North America Pediatric Wheelchair Industry Volume (K Unit), by End User 2024 & 2032
- Figure 33: North America Pediatric Wheelchair Industry Revenue Share (%), by End User 2024 & 2032
- Figure 34: North America Pediatric Wheelchair Industry Volume Share (%), by End User 2024 & 2032
- Figure 35: North America Pediatric Wheelchair Industry Revenue (Million), by Country 2024 & 2032
- Figure 36: North America Pediatric Wheelchair Industry Volume (K Unit), by Country 2024 & 2032
- Figure 37: North America Pediatric Wheelchair Industry Revenue Share (%), by Country 2024 & 2032
- Figure 38: North America Pediatric Wheelchair Industry Volume Share (%), by Country 2024 & 2032
- Figure 39: Europe Pediatric Wheelchair Industry Revenue (Million), by Product Type 2024 & 2032
- Figure 40: Europe Pediatric Wheelchair Industry Volume (K Unit), by Product Type 2024 & 2032
- Figure 41: Europe Pediatric Wheelchair Industry Revenue Share (%), by Product Type 2024 & 2032
- Figure 42: Europe Pediatric Wheelchair Industry Volume Share (%), by Product Type 2024 & 2032
- Figure 43: Europe Pediatric Wheelchair Industry Revenue (Million), by Frame Type 2024 & 2032
- Figure 44: Europe Pediatric Wheelchair Industry Volume (K Unit), by Frame Type 2024 & 2032
- Figure 45: Europe Pediatric Wheelchair Industry Revenue Share (%), by Frame Type 2024 & 2032
- Figure 46: Europe Pediatric Wheelchair Industry Volume Share (%), by Frame Type 2024 & 2032
- Figure 47: Europe Pediatric Wheelchair Industry Revenue (Million), by End User 2024 & 2032
- Figure 48: Europe Pediatric Wheelchair Industry Volume (K Unit), by End User 2024 & 2032
- Figure 49: Europe Pediatric Wheelchair Industry Revenue Share (%), by End User 2024 & 2032
- Figure 50: Europe Pediatric Wheelchair Industry Volume Share (%), by End User 2024 & 2032
- Figure 51: Europe Pediatric Wheelchair Industry Revenue (Million), by Country 2024 & 2032
- Figure 52: Europe Pediatric Wheelchair Industry Volume (K Unit), by Country 2024 & 2032
- Figure 53: Europe Pediatric Wheelchair Industry Revenue Share (%), by Country 2024 & 2032
- Figure 54: Europe Pediatric Wheelchair Industry Volume Share (%), by Country 2024 & 2032
- Figure 55: Asia Pacific Pediatric Wheelchair Industry Revenue (Million), by Product Type 2024 & 2032
- Figure 56: Asia Pacific Pediatric Wheelchair Industry Volume (K Unit), by Product Type 2024 & 2032
- Figure 57: Asia Pacific Pediatric Wheelchair Industry Revenue Share (%), by Product Type 2024 & 2032
- Figure 58: Asia Pacific Pediatric Wheelchair Industry Volume Share (%), by Product Type 2024 & 2032
- Figure 59: Asia Pacific Pediatric Wheelchair Industry Revenue (Million), by Frame Type 2024 & 2032
- Figure 60: Asia Pacific Pediatric Wheelchair Industry Volume (K Unit), by Frame Type 2024 & 2032
- Figure 61: Asia Pacific Pediatric Wheelchair Industry Revenue Share (%), by Frame Type 2024 & 2032
- Figure 62: Asia Pacific Pediatric Wheelchair Industry Volume Share (%), by Frame Type 2024 & 2032
- Figure 63: Asia Pacific Pediatric Wheelchair Industry Revenue (Million), by End User 2024 & 2032
- Figure 64: Asia Pacific Pediatric Wheelchair Industry Volume (K Unit), by End User 2024 & 2032
- Figure 65: Asia Pacific Pediatric Wheelchair Industry Revenue Share (%), by End User 2024 & 2032
- Figure 66: Asia Pacific Pediatric Wheelchair Industry Volume Share (%), by End User 2024 & 2032
- Figure 67: Asia Pacific Pediatric Wheelchair Industry Revenue (Million), by Country 2024 & 2032
- Figure 68: Asia Pacific Pediatric Wheelchair Industry Volume (K Unit), by Country 2024 & 2032
- Figure 69: Asia Pacific Pediatric Wheelchair Industry Revenue Share (%), by Country 2024 & 2032
- Figure 70: Asia Pacific Pediatric Wheelchair Industry Volume Share (%), by Country 2024 & 2032
- Figure 71: Middle East and Africa Pediatric Wheelchair Industry Revenue (Million), by Product Type 2024 & 2032
- Figure 72: Middle East and Africa Pediatric Wheelchair Industry Volume (K Unit), by Product Type 2024 & 2032
- Figure 73: Middle East and Africa Pediatric Wheelchair Industry Revenue Share (%), by Product Type 2024 & 2032
- Figure 74: Middle East and Africa Pediatric Wheelchair Industry Volume Share (%), by Product Type 2024 & 2032
- Figure 75: Middle East and Africa Pediatric Wheelchair Industry Revenue (Million), by Frame Type 2024 & 2032
- Figure 76: Middle East and Africa Pediatric Wheelchair Industry Volume (K Unit), by Frame Type 2024 & 2032
- Figure 77: Middle East and Africa Pediatric Wheelchair Industry Revenue Share (%), by Frame Type 2024 & 2032
- Figure 78: Middle East and Africa Pediatric Wheelchair Industry Volume Share (%), by Frame Type 2024 & 2032
- Figure 79: Middle East and Africa Pediatric Wheelchair Industry Revenue (Million), by End User 2024 & 2032
- Figure 80: Middle East and Africa Pediatric Wheelchair Industry Volume (K Unit), by End User 2024 & 2032
- Figure 81: Middle East and Africa Pediatric Wheelchair Industry Revenue Share (%), by End User 2024 & 2032
- Figure 82: Middle East and Africa Pediatric Wheelchair Industry Volume Share (%), by End User 2024 & 2032
- Figure 83: Middle East and Africa Pediatric Wheelchair Industry Revenue (Million), by Country 2024 & 2032
- Figure 84: Middle East and Africa Pediatric Wheelchair Industry Volume (K Unit), by Country 2024 & 2032
- Figure 85: Middle East and Africa Pediatric Wheelchair Industry Revenue Share (%), by Country 2024 & 2032
- Figure 86: Middle East and Africa Pediatric Wheelchair Industry Volume Share (%), by Country 2024 & 2032
- Figure 87: South America Pediatric Wheelchair Industry Revenue (Million), by Product Type 2024 & 2032
- Figure 88: South America Pediatric Wheelchair Industry Volume (K Unit), by Product Type 2024 & 2032
- Figure 89: South America Pediatric Wheelchair Industry Revenue Share (%), by Product Type 2024 & 2032
- Figure 90: South America Pediatric Wheelchair Industry Volume Share (%), by Product Type 2024 & 2032
- Figure 91: South America Pediatric Wheelchair Industry Revenue (Million), by Frame Type 2024 & 2032
- Figure 92: South America Pediatric Wheelchair Industry Volume (K Unit), by Frame Type 2024 & 2032
- Figure 93: South America Pediatric Wheelchair Industry Revenue Share (%), by Frame Type 2024 & 2032
- Figure 94: South America Pediatric Wheelchair Industry Volume Share (%), by Frame Type 2024 & 2032
- Figure 95: South America Pediatric Wheelchair Industry Revenue (Million), by End User 2024 & 2032
- Figure 96: South America Pediatric Wheelchair Industry Volume (K Unit), by End User 2024 & 2032
- Figure 97: South America Pediatric Wheelchair Industry Revenue Share (%), by End User 2024 & 2032
- Figure 98: South America Pediatric Wheelchair Industry Volume Share (%), by End User 2024 & 2032
- Figure 99: South America Pediatric Wheelchair Industry Revenue (Million), by Country 2024 & 2032
- Figure 100: South America Pediatric Wheelchair Industry Volume (K Unit), by Country 2024 & 2032
- Figure 101: South America Pediatric Wheelchair Industry Revenue Share (%), by Country 2024 & 2032
- Figure 102: South America Pediatric Wheelchair Industry Volume Share (%), by Country 2024 & 2032
List of Tables
- Table 1: Global Pediatric Wheelchair Industry Revenue Million Forecast, by Region 2019 & 2032
- Table 2: Global Pediatric Wheelchair Industry Volume K Unit Forecast, by Region 2019 & 2032
- Table 3: Global Pediatric Wheelchair Industry Revenue Million Forecast, by Product Type 2019 & 2032
- Table 4: Global Pediatric Wheelchair Industry Volume K Unit Forecast, by Product Type 2019 & 2032
- Table 5: Global Pediatric Wheelchair Industry Revenue Million Forecast, by Frame Type 2019 & 2032
- Table 6: Global Pediatric Wheelchair Industry Volume K Unit Forecast, by Frame Type 2019 & 2032
- Table 7: Global Pediatric Wheelchair Industry Revenue Million Forecast, by End User 2019 & 2032
- Table 8: Global Pediatric Wheelchair Industry Volume K Unit Forecast, by End User 2019 & 2032
- Table 9: Global Pediatric Wheelchair Industry Revenue Million Forecast, by Region 2019 & 2032
- Table 10: Global Pediatric Wheelchair Industry Volume K Unit Forecast, by Region 2019 & 2032
- Table 11: Global Pediatric Wheelchair Industry Revenue Million Forecast, by Country 2019 & 2032
- Table 12: Global Pediatric Wheelchair Industry Volume K Unit Forecast, by Country 2019 & 2032
- Table 13: United States Pediatric Wheelchair Industry Revenue (Million) Forecast, by Application 2019 & 2032
- Table 14: United States Pediatric Wheelchair Industry Volume (K Unit) Forecast, by Application 2019 & 2032
- Table 15: Canada Pediatric Wheelchair Industry Revenue (Million) Forecast, by Application 2019 & 2032
- Table 16: Canada Pediatric Wheelchair Industry Volume (K Unit) Forecast, by Application 2019 & 2032
- Table 17: Mexico Pediatric Wheelchair Industry Revenue (Million) Forecast, by Application 2019 & 2032
- Table 18: Mexico Pediatric Wheelchair Industry Volume (K Unit) Forecast, by Application 2019 & 2032
- Table 19: Global Pediatric Wheelchair Industry Revenue Million Forecast, by Country 2019 & 2032
- Table 20: Global Pediatric Wheelchair Industry Volume K Unit Forecast, by Country 2019 & 2032
- Table 21: Germany Pediatric Wheelchair Industry Revenue (Million) Forecast, by Application 2019 & 2032
- Table 22: Germany Pediatric Wheelchair Industry Volume (K Unit) Forecast, by Application 2019 & 2032
- Table 23: United Kingdom Pediatric Wheelchair Industry Revenue (Million) Forecast, by Application 2019 & 2032
- Table 24: United Kingdom Pediatric Wheelchair Industry Volume (K Unit) Forecast, by Application 2019 & 2032
- Table 25: France Pediatric Wheelchair Industry Revenue (Million) Forecast, by Application 2019 & 2032
- Table 26: France Pediatric Wheelchair Industry Volume (K Unit) Forecast, by Application 2019 & 2032
- Table 27: Italy Pediatric Wheelchair Industry Revenue (Million) Forecast, by Application 2019 & 2032
- Table 28: Italy Pediatric Wheelchair Industry Volume (K Unit) Forecast, by Application 2019 & 2032
- Table 29: Spain Pediatric Wheelchair Industry Revenue (Million) Forecast, by Application 2019 & 2032
- Table 30: Spain Pediatric Wheelchair Industry Volume (K Unit) Forecast, by Application 2019 & 2032
- Table 31: Rest of Europe Pediatric Wheelchair Industry Revenue (Million) Forecast, by Application 2019 & 2032
- Table 32: Rest of Europe Pediatric Wheelchair Industry Volume (K Unit) Forecast, by Application 2019 & 2032
- Table 33: Global Pediatric Wheelchair Industry Revenue Million Forecast, by Country 2019 & 2032
- Table 34: Global Pediatric Wheelchair Industry Volume K Unit Forecast, by Country 2019 & 2032
- Table 35: China Pediatric Wheelchair Industry Revenue (Million) Forecast, by Application 2019 & 2032
- Table 36: China Pediatric Wheelchair Industry Volume (K Unit) Forecast, by Application 2019 & 2032
- Table 37: Japan Pediatric Wheelchair Industry Revenue (Million) Forecast, by Application 2019 & 2032
- Table 38: Japan Pediatric Wheelchair Industry Volume (K Unit) Forecast, by Application 2019 & 2032
- Table 39: India Pediatric Wheelchair Industry Revenue (Million) Forecast, by Application 2019 & 2032
- Table 40: India Pediatric Wheelchair Industry Volume (K Unit) Forecast, by Application 2019 & 2032
- Table 41: Australia Pediatric Wheelchair Industry Revenue (Million) Forecast, by Application 2019 & 2032
- Table 42: Australia Pediatric Wheelchair Industry Volume (K Unit) Forecast, by Application 2019 & 2032
- Table 43: South Korea Pediatric Wheelchair Industry Revenue (Million) Forecast, by Application 2019 & 2032
- Table 44: South Korea Pediatric Wheelchair Industry Volume (K Unit) Forecast, by Application 2019 & 2032
- Table 45: Rest of Asia Pacific Pediatric Wheelchair Industry Revenue (Million) Forecast, by Application 2019 & 2032
- Table 46: Rest of Asia Pacific Pediatric Wheelchair Industry Volume (K Unit) Forecast, by Application 2019 & 2032
- Table 47: Global Pediatric Wheelchair Industry Revenue Million Forecast, by Country 2019 & 2032
- Table 48: Global Pediatric Wheelchair Industry Volume K Unit Forecast, by Country 2019 & 2032
- Table 49: GCC Pediatric Wheelchair Industry Revenue (Million) Forecast, by Application 2019 & 2032
- Table 50: GCC Pediatric Wheelchair Industry Volume (K Unit) Forecast, by Application 2019 & 2032
- Table 51: South Africa Pediatric Wheelchair Industry Revenue (Million) Forecast, by Application 2019 & 2032
- Table 52: South Africa Pediatric Wheelchair Industry Volume (K Unit) Forecast, by Application 2019 & 2032
- Table 53: Rest of Middle East and Africa Pediatric Wheelchair Industry Revenue (Million) Forecast, by Application 2019 & 2032
- Table 54: Rest of Middle East and Africa Pediatric Wheelchair Industry Volume (K Unit) Forecast, by Application 2019 & 2032
- Table 55: Global Pediatric Wheelchair Industry Revenue Million Forecast, by Country 2019 & 2032
- Table 56: Global Pediatric Wheelchair Industry Volume K Unit Forecast, by Country 2019 & 2032
- Table 57: Brazil Pediatric Wheelchair Industry Revenue (Million) Forecast, by Application 2019 & 2032
- Table 58: Brazil Pediatric Wheelchair Industry Volume (K Unit) Forecast, by Application 2019 & 2032
- Table 59: Argentina Pediatric Wheelchair Industry Revenue (Million) Forecast, by Application 2019 & 2032
- Table 60: Argentina Pediatric Wheelchair Industry Volume (K Unit) Forecast, by Application 2019 & 2032
- Table 61: Rest of South America Pediatric Wheelchair Industry Revenue (Million) Forecast, by Application 2019 & 2032
- Table 62: Rest of South America Pediatric Wheelchair Industry Volume (K Unit) Forecast, by Application 2019 & 2032
- Table 63: Global Pediatric Wheelchair Industry Revenue Million Forecast, by Product Type 2019 & 2032
- Table 64: Global Pediatric Wheelchair Industry Volume K Unit Forecast, by Product Type 2019 & 2032
- Table 65: Global Pediatric Wheelchair Industry Revenue Million Forecast, by Frame Type 2019 & 2032
- Table 66: Global Pediatric Wheelchair Industry Volume K Unit Forecast, by Frame Type 2019 & 2032
- Table 67: Global Pediatric Wheelchair Industry Revenue Million Forecast, by End User 2019 & 2032
- Table 68: Global Pediatric Wheelchair Industry Volume K Unit Forecast, by End User 2019 & 2032
- Table 69: Global Pediatric Wheelchair Industry Revenue Million Forecast, by Country 2019 & 2032
- Table 70: Global Pediatric Wheelchair Industry Volume K Unit Forecast, by Country 2019 & 2032
- Table 71: United States Pediatric Wheelchair Industry Revenue (Million) Forecast, by Application 2019 & 2032
- Table 72: United States Pediatric Wheelchair Industry Volume (K Unit) Forecast, by Application 2019 & 2032
- Table 73: Canada Pediatric Wheelchair Industry Revenue (Million) Forecast, by Application 2019 & 2032
- Table 74: Canada Pediatric Wheelchair Industry Volume (K Unit) Forecast, by Application 2019 & 2032
- Table 75: Mexico Pediatric Wheelchair Industry Revenue (Million) Forecast, by Application 2019 & 2032
- Table 76: Mexico Pediatric Wheelchair Industry Volume (K Unit) Forecast, by Application 2019 & 2032
- Table 77: Global Pediatric Wheelchair Industry Revenue Million Forecast, by Product Type 2019 & 2032
- Table 78: Global Pediatric Wheelchair Industry Volume K Unit Forecast, by Product Type 2019 & 2032
- Table 79: Global Pediatric Wheelchair Industry Revenue Million Forecast, by Frame Type 2019 & 2032
- Table 80: Global Pediatric Wheelchair Industry Volume K Unit Forecast, by Frame Type 2019 & 2032
- Table 81: Global Pediatric Wheelchair Industry Revenue Million Forecast, by End User 2019 & 2032
- Table 82: Global Pediatric Wheelchair Industry Volume K Unit Forecast, by End User 2019 & 2032
- Table 83: Global Pediatric Wheelchair Industry Revenue Million Forecast, by Country 2019 & 2032
- Table 84: Global Pediatric Wheelchair Industry Volume K Unit Forecast, by Country 2019 & 2032
- Table 85: Germany Pediatric Wheelchair Industry Revenue (Million) Forecast, by Application 2019 & 2032
- Table 86: Germany Pediatric Wheelchair Industry Volume (K Unit) Forecast, by Application 2019 & 2032
- Table 87: United Kingdom Pediatric Wheelchair Industry Revenue (Million) Forecast, by Application 2019 & 2032
- Table 88: United Kingdom Pediatric Wheelchair Industry Volume (K Unit) Forecast, by Application 2019 & 2032
- Table 89: France Pediatric Wheelchair Industry Revenue (Million) Forecast, by Application 2019 & 2032
- Table 90: France Pediatric Wheelchair Industry Volume (K Unit) Forecast, by Application 2019 & 2032
- Table 91: Italy Pediatric Wheelchair Industry Revenue (Million) Forecast, by Application 2019 & 2032
- Table 92: Italy Pediatric Wheelchair Industry Volume (K Unit) Forecast, by Application 2019 & 2032
- Table 93: Spain Pediatric Wheelchair Industry Revenue (Million) Forecast, by Application 2019 & 2032
- Table 94: Spain Pediatric Wheelchair Industry Volume (K Unit) Forecast, by Application 2019 & 2032
- Table 95: Rest of Europe Pediatric Wheelchair Industry Revenue (Million) Forecast, by Application 2019 & 2032
- Table 96: Rest of Europe Pediatric Wheelchair Industry Volume (K Unit) Forecast, by Application 2019 & 2032
- Table 97: Global Pediatric Wheelchair Industry Revenue Million Forecast, by Product Type 2019 & 2032
- Table 98: Global Pediatric Wheelchair Industry Volume K Unit Forecast, by Product Type 2019 & 2032
- Table 99: Global Pediatric Wheelchair Industry Revenue Million Forecast, by Frame Type 2019 & 2032
- Table 100: Global Pediatric Wheelchair Industry Volume K Unit Forecast, by Frame Type 2019 & 2032
- Table 101: Global Pediatric Wheelchair Industry Revenue Million Forecast, by End User 2019 & 2032
- Table 102: Global Pediatric Wheelchair Industry Volume K Unit Forecast, by End User 2019 & 2032
- Table 103: Global Pediatric Wheelchair Industry Revenue Million Forecast, by Country 2019 & 2032
- Table 104: Global Pediatric Wheelchair Industry Volume K Unit Forecast, by Country 2019 & 2032
- Table 105: China Pediatric Wheelchair Industry Revenue (Million) Forecast, by Application 2019 & 2032
- Table 106: China Pediatric Wheelchair Industry Volume (K Unit) Forecast, by Application 2019 & 2032
- Table 107: Japan Pediatric Wheelchair Industry Revenue (Million) Forecast, by Application 2019 & 2032
- Table 108: Japan Pediatric Wheelchair Industry Volume (K Unit) Forecast, by Application 2019 & 2032
- Table 109: India Pediatric Wheelchair Industry Revenue (Million) Forecast, by Application 2019 & 2032
- Table 110: India Pediatric Wheelchair Industry Volume (K Unit) Forecast, by Application 2019 & 2032
- Table 111: Australia Pediatric Wheelchair Industry Revenue (Million) Forecast, by Application 2019 & 2032
- Table 112: Australia Pediatric Wheelchair Industry Volume (K Unit) Forecast, by Application 2019 & 2032
- Table 113: South Korea Pediatric Wheelchair Industry Revenue (Million) Forecast, by Application 2019 & 2032
- Table 114: South Korea Pediatric Wheelchair Industry Volume (K Unit) Forecast, by Application 2019 & 2032
- Table 115: Rest of Asia Pacific Pediatric Wheelchair Industry Revenue (Million) Forecast, by Application 2019 & 2032
- Table 116: Rest of Asia Pacific Pediatric Wheelchair Industry Volume (K Unit) Forecast, by Application 2019 & 2032
- Table 117: Global Pediatric Wheelchair Industry Revenue Million Forecast, by Product Type 2019 & 2032
- Table 118: Global Pediatric Wheelchair Industry Volume K Unit Forecast, by Product Type 2019 & 2032
- Table 119: Global Pediatric Wheelchair Industry Revenue Million Forecast, by Frame Type 2019 & 2032
- Table 120: Global Pediatric Wheelchair Industry Volume K Unit Forecast, by Frame Type 2019 & 2032
- Table 121: Global Pediatric Wheelchair Industry Revenue Million Forecast, by End User 2019 & 2032
- Table 122: Global Pediatric Wheelchair Industry Volume K Unit Forecast, by End User 2019 & 2032
- Table 123: Global Pediatric Wheelchair Industry Revenue Million Forecast, by Country 2019 & 2032
- Table 124: Global Pediatric Wheelchair Industry Volume K Unit Forecast, by Country 2019 & 2032
- Table 125: GCC Pediatric Wheelchair Industry Revenue (Million) Forecast, by Application 2019 & 2032
- Table 126: GCC Pediatric Wheelchair Industry Volume (K Unit) Forecast, by Application 2019 & 2032
- Table 127: South Africa Pediatric Wheelchair Industry Revenue (Million) Forecast, by Application 2019 & 2032
- Table 128: South Africa Pediatric Wheelchair Industry Volume (K Unit) Forecast, by Application 2019 & 2032
- Table 129: Rest of Middle East and Africa Pediatric Wheelchair Industry Revenue (Million) Forecast, by Application 2019 & 2032
- Table 130: Rest of Middle East and Africa Pediatric Wheelchair Industry Volume (K Unit) Forecast, by Application 2019 & 2032
- Table 131: Global Pediatric Wheelchair Industry Revenue Million Forecast, by Product Type 2019 & 2032
- Table 132: Global Pediatric Wheelchair Industry Volume K Unit Forecast, by Product Type 2019 & 2032
- Table 133: Global Pediatric Wheelchair Industry Revenue Million Forecast, by Frame Type 2019 & 2032
- Table 134: Global Pediatric Wheelchair Industry Volume K Unit Forecast, by Frame Type 2019 & 2032
- Table 135: Global Pediatric Wheelchair Industry Revenue Million Forecast, by End User 2019 & 2032
- Table 136: Global Pediatric Wheelchair Industry Volume K Unit Forecast, by End User 2019 & 2032
- Table 137: Global Pediatric Wheelchair Industry Revenue Million Forecast, by Country 2019 & 2032
- Table 138: Global Pediatric Wheelchair Industry Volume K Unit Forecast, by Country 2019 & 2032
- Table 139: Brazil Pediatric Wheelchair Industry Revenue (Million) Forecast, by Application 2019 & 2032
- Table 140: Brazil Pediatric Wheelchair Industry Volume (K Unit) Forecast, by Application 2019 & 2032
- Table 141: Argentina Pediatric Wheelchair Industry Revenue (Million) Forecast, by Application 2019 & 2032
- Table 142: Argentina Pediatric Wheelchair Industry Volume (K Unit) Forecast, by Application 2019 & 2032
- Table 143: Rest of South America Pediatric Wheelchair Industry Revenue (Million) Forecast, by Application 2019 & 2032
- Table 144: Rest of South America Pediatric Wheelchair Industry Volume (K Unit) Forecast, by Application 2019 & 2032
Frequently Asked Questions
1. What is the projected Compound Annual Growth Rate (CAGR) of the Pediatric Wheelchair Industry?
The projected CAGR is approximately 5.30%.
2. Which companies are prominent players in the Pediatric Wheelchair Industry?
Key companies in the market include Invacare, MEYRA GmbH, Momentum Healthcare, AKCES-MED sp z o o, Medline, SORG Rollstuhltechnik GmbH, Ottobock, Permobil, Sunrise Medical.
3. What are the main segments of the Pediatric Wheelchair Industry?
The market segments include Product Type, Frame Type, End User.
4. Can you provide details about the market size?
The market size is estimated to be USD XX Million as of 2022.
5. What are some drivers contributing to market growth?
Rising Incidences of Disabilities in Children; Supportive Government Policies and Funding.
6. What are the notable trends driving market growth?
Manual Wheelchairs Segment Dominates the Market and is Expected to do so in the Forecast Period.
7. Are there any restraints impacting market growth?
High Cost of Paediatric Wheelchairs.
8. Can you provide examples of recent developments in the market?
In September 2022, Mobility solution manufacturer Karma Medical launched a new pediatric wheelchair at Rehacare 2022 in Dusseldorf, Germany. The Flexx Adapt is a highly adjustable pediatric wheelchair that grows with the child to provide a safe, supportive, and comfortable wheelchair experience.
9. What pricing options are available for accessing the report?
Pricing options include single-user, multi-user, and enterprise licenses priced at USD 4750, USD 5250, and USD 8750 respectively.
10. Is the market size provided in terms of value or volume?
The market size is provided in terms of value, measured in Million and volume, measured in K Unit.
11. Are there any specific market keywords associated with the report?
Yes, the market keyword associated with the report is "Pediatric Wheelchair Industry," which aids in identifying and referencing the specific market segment covered.
12. How do I determine which pricing option suits my needs best?
The pricing options vary based on user requirements and access needs. Individual users may opt for single-user licenses, while businesses requiring broader access may choose multi-user or enterprise licenses for cost-effective access to the report.
13. Are there any additional resources or data provided in the Pediatric Wheelchair Industry report?
While the report offers comprehensive insights, it's advisable to review the specific contents or supplementary materials provided to ascertain if additional resources or data are available.
14. How can I stay updated on further developments or reports in the Pediatric Wheelchair Industry?
To stay informed about further developments, trends, and reports in the Pediatric Wheelchair Industry, consider subscribing to industry newsletters, following relevant companies and organizations, or regularly checking reputable industry news sources and publications.
Methodology
Step 1 - Identification of Relevant Samples Size from Population Database


Step 2 - Approaches for Defining Global Market Size (Value, Volume* & Price*)

Note*: In applicable scenarios
Step 3 - Data Sources
Primary Research
- Web Analytics
- Survey Reports
- Research Institute
- Latest Research Reports
- Opinion Leaders
Secondary Research
- Annual Reports
- White Paper
- Latest Press Release
- Industry Association
- Paid Database
- Investor Presentations

Step 4 - Data Triangulation
Involves using different sources of information in order to increase the validity of a study
These sources are likely to be stakeholders in a program - participants, other researchers, program staff, other community members, and so on.
Then we put all data in single framework & apply various statistical tools to find out the dynamic on the market.
During the analysis stage, feedback from the stakeholder groups would be compared to determine areas of agreement as well as areas of divergence
