

Key Insights
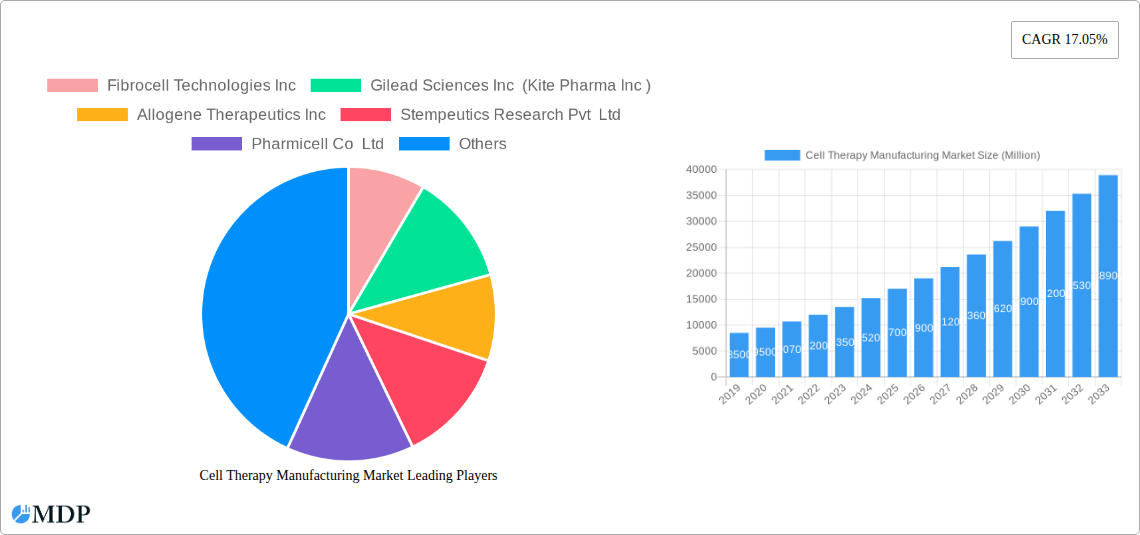
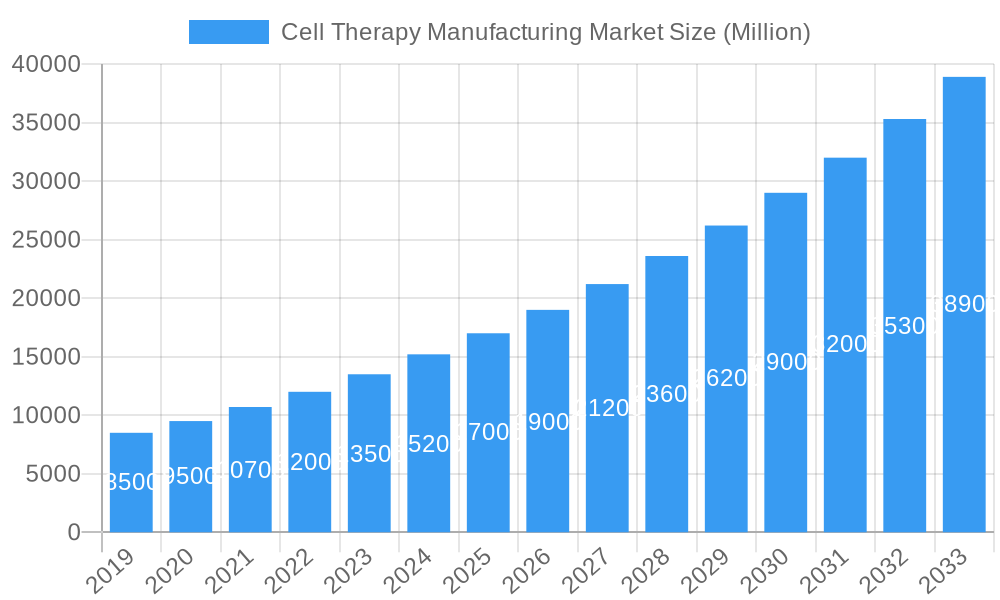
The global cell therapy manufacturing market is experiencing robust expansion, projected to reach approximately $25,000 million by 2025 and sustain a remarkable Compound Annual Growth Rate (CAGR) of 17.05% through 2033. This significant growth is primarily fueled by an escalating prevalence of chronic and genetic diseases, a growing pipeline of innovative cell-based therapies in clinical development, and increasing government support for regenerative medicine research and development. The rising demand for personalized medicine approaches, where cell therapies offer tailored treatment options, is also a pivotal driver. Furthermore, advancements in manufacturing technologies, including automation and process optimization, are enhancing efficiency and scalability, making cell therapies more accessible and commercially viable. The increasing awareness and acceptance of cell therapies among both healthcare professionals and patients are further contributing to market penetration.
Cell Therapy Manufacturing Market Market Size (In Billion)
The market segmentation reveals key areas of focus and opportunity. Autologous cell therapies, utilizing a patient's own cells, are a dominant segment, driven by their inherent safety profile and personalized efficacy, particularly in oncology and regenerative medicine. Hematopoietic stem cell therapy continues to be a cornerstone for treating hematological disorders, while Mesenchymal Stem Cell Therapy is gaining traction for its immunomodulatory and regenerative properties across various applications like musculoskeletal injuries, cardiovascular diseases, and inflammatory conditions. Fibroblast Cell Therapy is also carving out a niche, especially in wound healing and dermatological applications. Geographically, North America, particularly the United States, is expected to lead the market due to substantial R&D investments, a well-established healthcare infrastructure, and the presence of leading cell therapy developers. Asia Pacific is anticipated to exhibit the fastest growth, driven by increasing healthcare expenditure, a large patient pool, and a growing number of local players investing in advanced manufacturing capabilities.
Cell Therapy Manufacturing Market Company Market Share
Cell Therapy Manufacturing Market: Global Analysis, Trends, and Forecast (2019–2033)
Unlock insights into the rapidly evolving Cell Therapy Manufacturing Market, a multi-billion dollar sector poised for substantial growth. This comprehensive report provides an in-depth analysis of market dynamics, key industry trends, leading segments, product innovations, growth drivers, challenges, and emerging opportunities. Covering the study period from 2019 to 2033, with a base and estimated year of 2025 and a forecast period of 2025–2033, this report is your essential guide to understanding the competitive landscape and future trajectory of cell therapy production. Essential for biotech firms, pharmaceutical manufacturers, investors, and R&D professionals, this report details market share, CAGR, and strategic initiatives of key players.
Cell Therapy Manufacturing Market Market Dynamics & Concentration
The Cell Therapy Manufacturing Market is characterized by a dynamic interplay of innovation, stringent regulatory oversight, and increasing end-user demand. Market concentration is moderate, with a few dominant players holding significant market share in specific therapeutic areas, while a larger number of emerging companies focus on niche applications and advanced manufacturing technologies. Innovation drivers are primarily fueled by breakthroughs in genetic engineering, CAR-T cell technologies, and stem cell research, leading to novel therapeutic candidates for previously untreatable diseases. Regulatory frameworks, while complex, are also evolving to accommodate these advanced therapies, with agencies like the FDA and EMA establishing pathways for approval and manufacturing standards. Product substitutes, though limited for highly specialized cell therapies, include traditional pharmaceuticals and other regenerative medicine approaches. End-user trends indicate a growing preference for personalized medicine and potentially curative treatments, driving demand for cell-based interventions. Mergers and Acquisitions (M&A) activities are prevalent as larger pharmaceutical companies seek to expand their portfolios and acquire innovative technologies, further shaping market concentration. M&A deal counts have been steadily increasing over the historical period, reflecting strategic consolidation and investment in this high-growth sector.
Cell Therapy Manufacturing Market Industry Trends & Analysis
The Cell Therapy Manufacturing Market is experiencing robust growth, projected to achieve a significant Compound Annual Growth Rate (CAGR) of xx% from 2025 to 2033. This expansion is primarily propelled by the increasing prevalence of chronic and rare diseases, coupled with a growing number of clinical trials demonstrating the efficacy of cell therapies. Technological advancements in areas such as gene editing (CRISPR-Cas9), viral and non-viral vector development, and automation in cell processing are revolutionizing manufacturing capabilities, enabling higher yields, improved consistency, and reduced costs. Consumer preferences are shifting towards personalized and potentially curative treatments, aligning perfectly with the promise of cell therapies for conditions like cancers, autoimmune disorders, and degenerative diseases. The competitive landscape is intensifying, with both established biopharmaceutical giants and agile biotech startups vying for market leadership. Key market penetration is observed in oncology, where CAR-T therapies have achieved significant success, and in regenerative medicine applications for musculoskeletal and cardiovascular conditions. The development of allogeneic cell therapies, offering off-the-shelf solutions, is also a major trend contributing to wider accessibility and market penetration. The market is witnessing substantial investment in research and development, focusing on optimizing manufacturing processes, scaling up production, and ensuring product quality and safety.
Leading Markets & Segments in Cell Therapy Manufacturing Market
The Cell Therapy Manufacturing Market exhibits significant dominance in the Autologous segment, driven by its established efficacy and regulatory pathways for personalized treatments. Within this, Hematopoietic Stem Cell Therapy remains a cornerstone, particularly for treating hematological malignancies and certain genetic disorders. The Allogeneic segment, however, is rapidly gaining traction due to its potential for scalability and reduced manufacturing complexity, offering off-the-shelf solutions.
Key Dominance Drivers for Segments:
- Type:
- Autologous: Current regulatory acceptance and proven clinical outcomes in specific indications.
- Allogeneic: Scalability, potential for reduced cost of goods, and faster patient access.
- Therapy:
- Mesenchymal Stem Cell Therapy: Versatility in treating inflammatory and degenerative diseases, significant R&D investment.
- Fibroblast Cell Therapy: Promising applications in wound healing and skin regeneration.
- Hematopoietic Stem Cell Therapy: Established treatment protocols for blood disorders and certain cancers.
- Other Therapies: Emerging cell engineering techniques and novel cell types for unmet medical needs.
- Application:
- Malignancies: The largest and fastest-growing application, driven by advancements in CAR-T and other immunotherapies.
- Musculoskeletal: Growing interest in regenerative therapies for osteoarthritis, sports injuries, and bone defects.
- Cardiovascular: Potential for repairing damaged heart tissue and improving cardiac function.
- Dermatology and Wounds: Applications in treating chronic wounds, burns, and reconstructive surgery.
- Other Applications: Expanding into neurological disorders, metabolic diseases, and ophthalmology.
The North America region, particularly the United States, leads the global market owing to substantial R&D investments, a favorable regulatory environment, and a high incidence of target diseases. Economic policies supporting biotechnology innovation and advanced healthcare infrastructure further bolster its dominance. Asia-Pacific is emerging as a significant growth region, driven by increasing healthcare expenditure, a large patient pool, and supportive government initiatives to promote advanced therapies.
Cell Therapy Manufacturing Market Product Developments
Product development in the Cell Therapy Manufacturing Market is characterized by an aggressive pace of innovation. Companies are focusing on enhancing the efficacy, safety, and manufacturing feasibility of their cell-based therapies. Key trends include the development of next-generation CAR-T cells with improved persistence and reduced toxicity, advancements in allogeneic cell sources to circumvent donor matching issues, and the exploration of novel cell types for a wider range of therapeutic applications. For instance, the development of gene-edited cell therapies aims to create more potent and targeted treatments, offering a competitive advantage in challenging disease areas like solid tumors and autoimmune conditions. The market fit for these innovations is strong, driven by the persistent unmet medical needs and the growing demand for personalized medicine solutions.
Key Drivers of Cell Therapy Manufacturing Market Growth
The Cell Therapy Manufacturing Market is propelled by a confluence of powerful drivers. Technologically, breakthroughs in genetic engineering, stem cell biology, and bioprocessing are enabling the development of more effective and scalable cell therapies. Economically, increasing healthcare expenditures globally, coupled with a growing patient population suffering from chronic and life-threatening diseases, creates a substantial market demand. Regulatory bodies are increasingly providing clear pathways for the approval of these complex therapies, fostering innovation. Furthermore, significant investment from venture capital and pharmaceutical giants is fueling research and development, accelerating the translation of laboratory discoveries into clinical applications. The increasing success rates observed in clinical trials for various cell therapies are also a major catalyst.
Challenges in the Cell Therapy Manufacturing Market Market
Despite its promising outlook, the Cell Therapy Manufacturing Market faces significant challenges. Regulatory hurdles, though easing, remain complex and can lead to lengthy approval processes and high compliance costs. Manufacturing scalability and cost-effectiveness are critical bottlenecks; producing complex, personalized cell therapies at a commercial scale while maintaining quality and affordability is a major hurdle. Supply chain complexities for raw materials, specialized reagents, and logistics for temperature-sensitive cell products add further strain. Fierce competition and the high cost of R&D also pose substantial financial risks for smaller companies. Moreover, ensuring long-term efficacy and managing potential adverse events are ongoing concerns that require continuous monitoring and mitigation strategies.
Emerging Opportunities in Cell Therapy Manufacturing Market
Emerging opportunities in the Cell Therapy Manufacturing Market are vast and driven by continuous scientific advancement and strategic market expansion. The development of novel cell types beyond T-cells, such as NK cells and macrophages, for a broader range of oncological and immunological indications presents a significant growth avenue. Furthermore, the exploration of cell therapies for neurodegenerative diseases, cardiovascular conditions, and rare genetic disorders is opening up new therapeutic frontiers. Strategic partnerships between academic institutions, biotech startups, and large pharmaceutical companies are crucial for accelerating R&D and commercialization. The increasing focus on allogeneic therapies promises to overcome some of the current manufacturing and accessibility challenges, leading to wider market penetration. Advances in gene editing technologies and ex vivo manufacturing techniques will further enhance the therapeutic potential and cost-effectiveness of these groundbreaking treatments.
Leading Players in the Cell Therapy Manufacturing Market Sector
- Fibrocell Technologies Inc
- Gilead Sciences Inc (Kite Pharma Inc )
- Allogene Therapeutics Inc
- Stempeutics Research Pvt Ltd
- Pharmicell Co Ltd
- Novartis AG
- Anterogen Co Ltd
- Chiesi Farmaceutici SpA
- Nipro Corporation
- TiGenix (Takeda Pharmaceuticals)
- Organogenesis Inc
- Vericel Corporation
- Tego Science
- MEDIPOST Co Ltd
- Corestem Inc
Key Milestones in Cell Therapy Manufacturing Market Industry
- January 2022: Immunocore received the Food and Drug Administration approval of KIMMTRAK (tebentafusp-tebn) for the treatment of unresectable or metastatic uveal melanoma.
- March 2021: Novadip Biosciences received Investigational New Drug (IND) approval from the Food and Drug Administration for regenerative bone product NVD-003 for the treatment of rare pediatric bone disease.
Strategic Outlook for Cell Therapy Manufacturing Market Market
The strategic outlook for the Cell Therapy Manufacturing Market is exceptionally strong, driven by continued scientific innovation and expanding therapeutic applications. Growth accelerators will include the increasing focus on developing allogeneic cell therapies to address scalability and cost concerns, thereby expanding market access. Strategic investments in advanced manufacturing technologies, such as automation and artificial intelligence, will be critical for optimizing production processes and ensuring consistent quality. Furthermore, the exploration of cell therapies for a wider range of indications beyond oncology, including autoimmune diseases, cardiovascular disorders, and neurological conditions, will unlock significant new market potential. The formation of strategic alliances and partnerships between key industry players will foster collaboration and accelerate the development and commercialization of novel cell-based treatments, positioning the market for sustained and robust expansion.
Cell Therapy Manufacturing Market Segmentation
-
1. Type
- 1.1. Autologous
- 1.2. Allogeneic
-
2. Therapy
- 2.1. Mesenchymal Stem Cell Therapy
- 2.2. Fibroblast Cell Therapy
- 2.3. Hematopoietic Stem Cell Therapy
- 2.4. Other Therapies
-
3. Application
- 3.1. Musculoskeletal
- 3.2. Malignancies
- 3.3. Cardiovascular
- 3.4. Dermatology and Wounds
- 3.5. Other Applications
Cell Therapy Manufacturing Market Segmentation By Geography
-
1. North America
- 1.1. United States
- 1.2. Canada
- 1.3. Mexico
-
2. Europe
- 2.1. Germany
- 2.2. United Kingdom
- 2.3. France
- 2.4. Italy
- 2.5. Spain
- 2.6. Rest of Europe
-
3. Asia Pacific
- 3.1. China
- 3.2. Japan
- 3.3. India
- 3.4. Australia
- 3.5. South Korea
- 3.6. Rest of Asia Pacific
-
4. Middle East and Africa
- 4.1. GCC
- 4.2. South Africa
- 4.3. Rest of Middle East and Africa
-
5. South America
- 5.1. Brazil
- 5.2. Argentina
- 5.3. Rest of South America
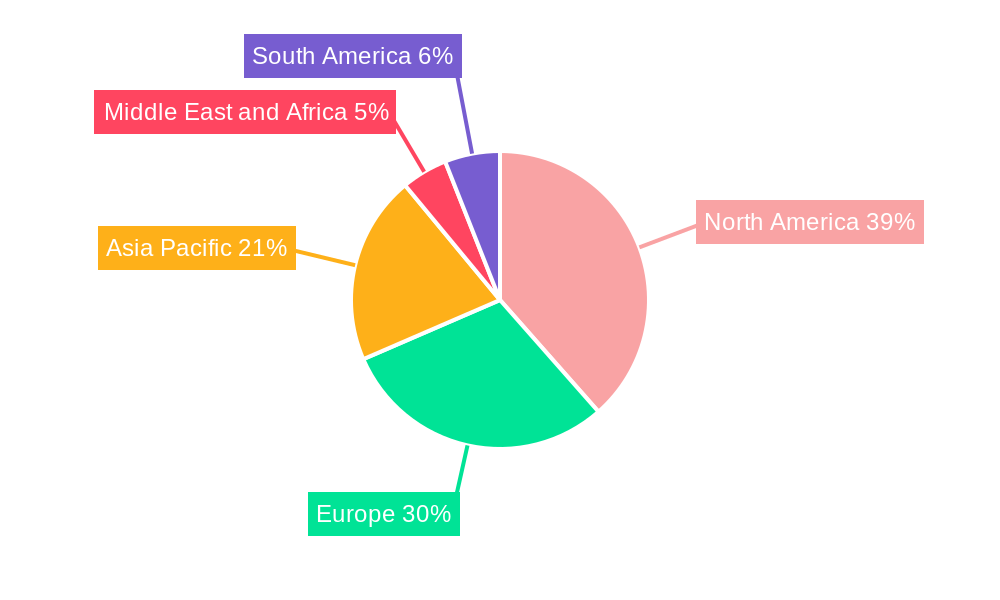
Cell Therapy Manufacturing Market Regional Market Share
Geographic Coverage of Cell Therapy Manufacturing Market
Cell Therapy Manufacturing Market REPORT HIGHLIGHTS
| Aspects | Details |
|---|---|
| Study Period | 2020-2034 |
| Base Year | 2025 |
| Estimated Year | 2026 |
| Forecast Period | 2026-2034 |
| Historical Period | 2020-2025 |
| Growth Rate | CAGR of 19% from 2020-2034 |
| Segmentation |
|
Table of Contents
- 1. Introduction
- 1.1. Research Scope
- 1.2. Market Segmentation
- 1.3. Research Objective
- 1.4. Definitions and Assumptions
- 2. Executive Summary
- 2.1. Market Snapshot
- 3. Market Dynamics
- 3.1. Market Drivers
- 3.2. Market Restrains
- 3.3. Market Trends
- 3.4. Market Opportunities
- 4. Market Factor Analysis
- 4.1. Porters Five Forces
- 4.1.1. Bargaining Power of Suppliers
- 4.1.2. Bargaining Power of Buyers
- 4.1.3. Threat of New Entrants
- 4.1.4. Threat of Substitutes
- 4.1.5. Competitive Rivalry
- 4.2. PESTEL analysis
- 4.3. BCG Analysis
- 4.3.1. Stars (High Growth, High Market Share)
- 4.3.2. Cash Cows (Low Growth, High Market Share)
- 4.3.3. Question Mark (High Growth, Low Market Share)
- 4.3.4. Dogs (Low Growth, Low Market Share)
- 4.4. Ansoff Matrix Analysis
- 4.5. Supply Chain Analysis
- 4.6. Regulatory Landscape
- 4.7. Current Market Potential and Opportunity Assessment (TAM–SAM–SOM Framework)
- 4.8. MDP Analyst Note
- 4.1. Porters Five Forces
- 5. Market Analysis, Insights and Forecast 2021-2033
- 5.1. Market Analysis, Insights and Forecast - by Type
- 5.1.1. Autologous
- 5.1.2. Allogeneic
- 5.2. Market Analysis, Insights and Forecast - by Therapy
- 5.2.1. Mesenchymal Stem Cell Therapy
- 5.2.2. Fibroblast Cell Therapy
- 5.2.3. Hematopoietic Stem Cell Therapy
- 5.2.4. Other Therapies
- 5.3. Market Analysis, Insights and Forecast - by Application
- 5.3.1. Musculoskeletal
- 5.3.2. Malignancies
- 5.3.3. Cardiovascular
- 5.3.4. Dermatology and Wounds
- 5.3.5. Other Applications
- 5.4. Market Analysis, Insights and Forecast - by Region
- 5.4.1. North America
- 5.4.2. Europe
- 5.4.3. Asia Pacific
- 5.4.4. Middle East and Africa
- 5.4.5. South America
- 5.1. Market Analysis, Insights and Forecast - by Type
- 6. Global Cell Therapy Manufacturing Market Analysis, Insights and Forecast, 2021-2033
- 6.1. Market Analysis, Insights and Forecast - by Type
- 6.1.1. Autologous
- 6.1.2. Allogeneic
- 6.2. Market Analysis, Insights and Forecast - by Therapy
- 6.2.1. Mesenchymal Stem Cell Therapy
- 6.2.2. Fibroblast Cell Therapy
- 6.2.3. Hematopoietic Stem Cell Therapy
- 6.2.4. Other Therapies
- 6.3. Market Analysis, Insights and Forecast - by Application
- 6.3.1. Musculoskeletal
- 6.3.2. Malignancies
- 6.3.3. Cardiovascular
- 6.3.4. Dermatology and Wounds
- 6.3.5. Other Applications
- 6.1. Market Analysis, Insights and Forecast - by Type
- 7. North America Cell Therapy Manufacturing Market Analysis, Insights and Forecast, 2020-2032
- 7.1. Market Analysis, Insights and Forecast - by Type
- 7.1.1. Autologous
- 7.1.2. Allogeneic
- 7.2. Market Analysis, Insights and Forecast - by Therapy
- 7.2.1. Mesenchymal Stem Cell Therapy
- 7.2.2. Fibroblast Cell Therapy
- 7.2.3. Hematopoietic Stem Cell Therapy
- 7.2.4. Other Therapies
- 7.3. Market Analysis, Insights and Forecast - by Application
- 7.3.1. Musculoskeletal
- 7.3.2. Malignancies
- 7.3.3. Cardiovascular
- 7.3.4. Dermatology and Wounds
- 7.3.5. Other Applications
- 7.1. Market Analysis, Insights and Forecast - by Type
- 8. Europe Cell Therapy Manufacturing Market Analysis, Insights and Forecast, 2020-2032
- 8.1. Market Analysis, Insights and Forecast - by Type
- 8.1.1. Autologous
- 8.1.2. Allogeneic
- 8.2. Market Analysis, Insights and Forecast - by Therapy
- 8.2.1. Mesenchymal Stem Cell Therapy
- 8.2.2. Fibroblast Cell Therapy
- 8.2.3. Hematopoietic Stem Cell Therapy
- 8.2.4. Other Therapies
- 8.3. Market Analysis, Insights and Forecast - by Application
- 8.3.1. Musculoskeletal
- 8.3.2. Malignancies
- 8.3.3. Cardiovascular
- 8.3.4. Dermatology and Wounds
- 8.3.5. Other Applications
- 8.1. Market Analysis, Insights and Forecast - by Type
- 9. Asia Pacific Cell Therapy Manufacturing Market Analysis, Insights and Forecast, 2020-2032
- 9.1. Market Analysis, Insights and Forecast - by Type
- 9.1.1. Autologous
- 9.1.2. Allogeneic
- 9.2. Market Analysis, Insights and Forecast - by Therapy
- 9.2.1. Mesenchymal Stem Cell Therapy
- 9.2.2. Fibroblast Cell Therapy
- 9.2.3. Hematopoietic Stem Cell Therapy
- 9.2.4. Other Therapies
- 9.3. Market Analysis, Insights and Forecast - by Application
- 9.3.1. Musculoskeletal
- 9.3.2. Malignancies
- 9.3.3. Cardiovascular
- 9.3.4. Dermatology and Wounds
- 9.3.5. Other Applications
- 9.1. Market Analysis, Insights and Forecast - by Type
- 10. Middle East and Africa Cell Therapy Manufacturing Market Analysis, Insights and Forecast, 2020-2032
- 10.1. Market Analysis, Insights and Forecast - by Type
- 10.1.1. Autologous
- 10.1.2. Allogeneic
- 10.2. Market Analysis, Insights and Forecast - by Therapy
- 10.2.1. Mesenchymal Stem Cell Therapy
- 10.2.2. Fibroblast Cell Therapy
- 10.2.3. Hematopoietic Stem Cell Therapy
- 10.2.4. Other Therapies
- 10.3. Market Analysis, Insights and Forecast - by Application
- 10.3.1. Musculoskeletal
- 10.3.2. Malignancies
- 10.3.3. Cardiovascular
- 10.3.4. Dermatology and Wounds
- 10.3.5. Other Applications
- 10.1. Market Analysis, Insights and Forecast - by Type
- 11. South America Cell Therapy Manufacturing Market Analysis, Insights and Forecast, 2020-2032
- 11.1. Market Analysis, Insights and Forecast - by Type
- 11.1.1. Autologous
- 11.1.2. Allogeneic
- 11.2. Market Analysis, Insights and Forecast - by Therapy
- 11.2.1. Mesenchymal Stem Cell Therapy
- 11.2.2. Fibroblast Cell Therapy
- 11.2.3. Hematopoietic Stem Cell Therapy
- 11.2.4. Other Therapies
- 11.3. Market Analysis, Insights and Forecast - by Application
- 11.3.1. Musculoskeletal
- 11.3.2. Malignancies
- 11.3.3. Cardiovascular
- 11.3.4. Dermatology and Wounds
- 11.3.5. Other Applications
- 11.1. Market Analysis, Insights and Forecast - by Type
- 12. Competitive Analysis
- 12.1. Company Profiles
- 12.1.1 Fibrocell Technologies Inc
- 12.1.1.1. Company Overview
- 12.1.1.2. Products
- 12.1.1.3. Company Financials
- 12.1.1.4. SWOT Analysis
- 12.1.2 Gilead Sciences Inc (Kite Pharma Inc )
- 12.1.2.1. Company Overview
- 12.1.2.2. Products
- 12.1.2.3. Company Financials
- 12.1.2.4. SWOT Analysis
- 12.1.3 Allogene Therapeutics Inc
- 12.1.3.1. Company Overview
- 12.1.3.2. Products
- 12.1.3.3. Company Financials
- 12.1.3.4. SWOT Analysis
- 12.1.4 Stempeutics Research Pvt Ltd
- 12.1.4.1. Company Overview
- 12.1.4.2. Products
- 12.1.4.3. Company Financials
- 12.1.4.4. SWOT Analysis
- 12.1.5 Pharmicell Co Ltd
- 12.1.5.1. Company Overview
- 12.1.5.2. Products
- 12.1.5.3. Company Financials
- 12.1.5.4. SWOT Analysis
- 12.1.6 Novartis AG
- 12.1.6.1. Company Overview
- 12.1.6.2. Products
- 12.1.6.3. Company Financials
- 12.1.6.4. SWOT Analysis
- 12.1.7 Anterogen Co Ltd
- 12.1.7.1. Company Overview
- 12.1.7.2. Products
- 12.1.7.3. Company Financials
- 12.1.7.4. SWOT Analysis
- 12.1.8 Chiesi Farmaceutici SpA
- 12.1.8.1. Company Overview
- 12.1.8.2. Products
- 12.1.8.3. Company Financials
- 12.1.8.4. SWOT Analysis
- 12.1.9 Nipro Corporation
- 12.1.9.1. Company Overview
- 12.1.9.2. Products
- 12.1.9.3. Company Financials
- 12.1.9.4. SWOT Analysis
- 12.1.10 TiGenix (Takeda Pharmaceuticals)
- 12.1.10.1. Company Overview
- 12.1.10.2. Products
- 12.1.10.3. Company Financials
- 12.1.10.4. SWOT Analysis
- 12.1.11 Organogenesis Inc
- 12.1.11.1. Company Overview
- 12.1.11.2. Products
- 12.1.11.3. Company Financials
- 12.1.11.4. SWOT Analysis
- 12.1.12 Vericel Corporation
- 12.1.12.1. Company Overview
- 12.1.12.2. Products
- 12.1.12.3. Company Financials
- 12.1.12.4. SWOT Analysis
- 12.1.13 Tego Science
- 12.1.13.1. Company Overview
- 12.1.13.2. Products
- 12.1.13.3. Company Financials
- 12.1.13.4. SWOT Analysis
- 12.1.14 MEDIPOST Co Ltd
- 12.1.14.1. Company Overview
- 12.1.14.2. Products
- 12.1.14.3. Company Financials
- 12.1.14.4. SWOT Analysis
- 12.1.15 Corestem Inc
- 12.1.15.1. Company Overview
- 12.1.15.2. Products
- 12.1.15.3. Company Financials
- 12.1.15.4. SWOT Analysis
- 12.1.1 Fibrocell Technologies Inc
- 12.2. Market Entropy
- 12.2.1 Company's Key Areas Served
- 12.2.2 Recent Developments
- 12.3. Company Market Share Analysis 2025
- 12.3.1 Top 5 Companies Market Share Analysis
- 12.3.2 Top 3 Companies Market Share Analysis
- 12.4. List of Potential Customers
- 13. Research Methodology
List of Figures
- Figure 1: Global Cell Therapy Manufacturing Market Revenue Breakdown (billion, %) by Region 2025 & 2033
- Figure 2: Global Cell Therapy Manufacturing Market Volume Breakdown (K Unit, %) by Region 2025 & 2033
- Figure 3: North America Cell Therapy Manufacturing Market Revenue (billion), by Type 2025 & 2033
- Figure 4: North America Cell Therapy Manufacturing Market Volume (K Unit), by Type 2025 & 2033
- Figure 5: North America Cell Therapy Manufacturing Market Revenue Share (%), by Type 2025 & 2033
- Figure 6: North America Cell Therapy Manufacturing Market Volume Share (%), by Type 2025 & 2033
- Figure 7: North America Cell Therapy Manufacturing Market Revenue (billion), by Therapy 2025 & 2033
- Figure 8: North America Cell Therapy Manufacturing Market Volume (K Unit), by Therapy 2025 & 2033
- Figure 9: North America Cell Therapy Manufacturing Market Revenue Share (%), by Therapy 2025 & 2033
- Figure 10: North America Cell Therapy Manufacturing Market Volume Share (%), by Therapy 2025 & 2033
- Figure 11: North America Cell Therapy Manufacturing Market Revenue (billion), by Application 2025 & 2033
- Figure 12: North America Cell Therapy Manufacturing Market Volume (K Unit), by Application 2025 & 2033
- Figure 13: North America Cell Therapy Manufacturing Market Revenue Share (%), by Application 2025 & 2033
- Figure 14: North America Cell Therapy Manufacturing Market Volume Share (%), by Application 2025 & 2033
- Figure 15: North America Cell Therapy Manufacturing Market Revenue (billion), by Country 2025 & 2033
- Figure 16: North America Cell Therapy Manufacturing Market Volume (K Unit), by Country 2025 & 2033
- Figure 17: North America Cell Therapy Manufacturing Market Revenue Share (%), by Country 2025 & 2033
- Figure 18: North America Cell Therapy Manufacturing Market Volume Share (%), by Country 2025 & 2033
- Figure 19: Europe Cell Therapy Manufacturing Market Revenue (billion), by Type 2025 & 2033
- Figure 20: Europe Cell Therapy Manufacturing Market Volume (K Unit), by Type 2025 & 2033
- Figure 21: Europe Cell Therapy Manufacturing Market Revenue Share (%), by Type 2025 & 2033
- Figure 22: Europe Cell Therapy Manufacturing Market Volume Share (%), by Type 2025 & 2033
- Figure 23: Europe Cell Therapy Manufacturing Market Revenue (billion), by Therapy 2025 & 2033
- Figure 24: Europe Cell Therapy Manufacturing Market Volume (K Unit), by Therapy 2025 & 2033
- Figure 25: Europe Cell Therapy Manufacturing Market Revenue Share (%), by Therapy 2025 & 2033
- Figure 26: Europe Cell Therapy Manufacturing Market Volume Share (%), by Therapy 2025 & 2033
- Figure 27: Europe Cell Therapy Manufacturing Market Revenue (billion), by Application 2025 & 2033
- Figure 28: Europe Cell Therapy Manufacturing Market Volume (K Unit), by Application 2025 & 2033
- Figure 29: Europe Cell Therapy Manufacturing Market Revenue Share (%), by Application 2025 & 2033
- Figure 30: Europe Cell Therapy Manufacturing Market Volume Share (%), by Application 2025 & 2033
- Figure 31: Europe Cell Therapy Manufacturing Market Revenue (billion), by Country 2025 & 2033
- Figure 32: Europe Cell Therapy Manufacturing Market Volume (K Unit), by Country 2025 & 2033
- Figure 33: Europe Cell Therapy Manufacturing Market Revenue Share (%), by Country 2025 & 2033
- Figure 34: Europe Cell Therapy Manufacturing Market Volume Share (%), by Country 2025 & 2033
- Figure 35: Asia Pacific Cell Therapy Manufacturing Market Revenue (billion), by Type 2025 & 2033
- Figure 36: Asia Pacific Cell Therapy Manufacturing Market Volume (K Unit), by Type 2025 & 2033
- Figure 37: Asia Pacific Cell Therapy Manufacturing Market Revenue Share (%), by Type 2025 & 2033
- Figure 38: Asia Pacific Cell Therapy Manufacturing Market Volume Share (%), by Type 2025 & 2033
- Figure 39: Asia Pacific Cell Therapy Manufacturing Market Revenue (billion), by Therapy 2025 & 2033
- Figure 40: Asia Pacific Cell Therapy Manufacturing Market Volume (K Unit), by Therapy 2025 & 2033
- Figure 41: Asia Pacific Cell Therapy Manufacturing Market Revenue Share (%), by Therapy 2025 & 2033
- Figure 42: Asia Pacific Cell Therapy Manufacturing Market Volume Share (%), by Therapy 2025 & 2033
- Figure 43: Asia Pacific Cell Therapy Manufacturing Market Revenue (billion), by Application 2025 & 2033
- Figure 44: Asia Pacific Cell Therapy Manufacturing Market Volume (K Unit), by Application 2025 & 2033
- Figure 45: Asia Pacific Cell Therapy Manufacturing Market Revenue Share (%), by Application 2025 & 2033
- Figure 46: Asia Pacific Cell Therapy Manufacturing Market Volume Share (%), by Application 2025 & 2033
- Figure 47: Asia Pacific Cell Therapy Manufacturing Market Revenue (billion), by Country 2025 & 2033
- Figure 48: Asia Pacific Cell Therapy Manufacturing Market Volume (K Unit), by Country 2025 & 2033
- Figure 49: Asia Pacific Cell Therapy Manufacturing Market Revenue Share (%), by Country 2025 & 2033
- Figure 50: Asia Pacific Cell Therapy Manufacturing Market Volume Share (%), by Country 2025 & 2033
- Figure 51: Middle East and Africa Cell Therapy Manufacturing Market Revenue (billion), by Type 2025 & 2033
- Figure 52: Middle East and Africa Cell Therapy Manufacturing Market Volume (K Unit), by Type 2025 & 2033
- Figure 53: Middle East and Africa Cell Therapy Manufacturing Market Revenue Share (%), by Type 2025 & 2033
- Figure 54: Middle East and Africa Cell Therapy Manufacturing Market Volume Share (%), by Type 2025 & 2033
- Figure 55: Middle East and Africa Cell Therapy Manufacturing Market Revenue (billion), by Therapy 2025 & 2033
- Figure 56: Middle East and Africa Cell Therapy Manufacturing Market Volume (K Unit), by Therapy 2025 & 2033
- Figure 57: Middle East and Africa Cell Therapy Manufacturing Market Revenue Share (%), by Therapy 2025 & 2033
- Figure 58: Middle East and Africa Cell Therapy Manufacturing Market Volume Share (%), by Therapy 2025 & 2033
- Figure 59: Middle East and Africa Cell Therapy Manufacturing Market Revenue (billion), by Application 2025 & 2033
- Figure 60: Middle East and Africa Cell Therapy Manufacturing Market Volume (K Unit), by Application 2025 & 2033
- Figure 61: Middle East and Africa Cell Therapy Manufacturing Market Revenue Share (%), by Application 2025 & 2033
- Figure 62: Middle East and Africa Cell Therapy Manufacturing Market Volume Share (%), by Application 2025 & 2033
- Figure 63: Middle East and Africa Cell Therapy Manufacturing Market Revenue (billion), by Country 2025 & 2033
- Figure 64: Middle East and Africa Cell Therapy Manufacturing Market Volume (K Unit), by Country 2025 & 2033
- Figure 65: Middle East and Africa Cell Therapy Manufacturing Market Revenue Share (%), by Country 2025 & 2033
- Figure 66: Middle East and Africa Cell Therapy Manufacturing Market Volume Share (%), by Country 2025 & 2033
- Figure 67: South America Cell Therapy Manufacturing Market Revenue (billion), by Type 2025 & 2033
- Figure 68: South America Cell Therapy Manufacturing Market Volume (K Unit), by Type 2025 & 2033
- Figure 69: South America Cell Therapy Manufacturing Market Revenue Share (%), by Type 2025 & 2033
- Figure 70: South America Cell Therapy Manufacturing Market Volume Share (%), by Type 2025 & 2033
- Figure 71: South America Cell Therapy Manufacturing Market Revenue (billion), by Therapy 2025 & 2033
- Figure 72: South America Cell Therapy Manufacturing Market Volume (K Unit), by Therapy 2025 & 2033
- Figure 73: South America Cell Therapy Manufacturing Market Revenue Share (%), by Therapy 2025 & 2033
- Figure 74: South America Cell Therapy Manufacturing Market Volume Share (%), by Therapy 2025 & 2033
- Figure 75: South America Cell Therapy Manufacturing Market Revenue (billion), by Application 2025 & 2033
- Figure 76: South America Cell Therapy Manufacturing Market Volume (K Unit), by Application 2025 & 2033
- Figure 77: South America Cell Therapy Manufacturing Market Revenue Share (%), by Application 2025 & 2033
- Figure 78: South America Cell Therapy Manufacturing Market Volume Share (%), by Application 2025 & 2033
- Figure 79: South America Cell Therapy Manufacturing Market Revenue (billion), by Country 2025 & 2033
- Figure 80: South America Cell Therapy Manufacturing Market Volume (K Unit), by Country 2025 & 2033
- Figure 81: South America Cell Therapy Manufacturing Market Revenue Share (%), by Country 2025 & 2033
- Figure 82: South America Cell Therapy Manufacturing Market Volume Share (%), by Country 2025 & 2033
List of Tables
- Table 1: Global Cell Therapy Manufacturing Market Revenue billion Forecast, by Type 2020 & 2033
- Table 2: Global Cell Therapy Manufacturing Market Volume K Unit Forecast, by Type 2020 & 2033
- Table 3: Global Cell Therapy Manufacturing Market Revenue billion Forecast, by Therapy 2020 & 2033
- Table 4: Global Cell Therapy Manufacturing Market Volume K Unit Forecast, by Therapy 2020 & 2033
- Table 5: Global Cell Therapy Manufacturing Market Revenue billion Forecast, by Application 2020 & 2033
- Table 6: Global Cell Therapy Manufacturing Market Volume K Unit Forecast, by Application 2020 & 2033
- Table 7: Global Cell Therapy Manufacturing Market Revenue billion Forecast, by Region 2020 & 2033
- Table 8: Global Cell Therapy Manufacturing Market Volume K Unit Forecast, by Region 2020 & 2033
- Table 9: Global Cell Therapy Manufacturing Market Revenue billion Forecast, by Type 2020 & 2033
- Table 10: Global Cell Therapy Manufacturing Market Volume K Unit Forecast, by Type 2020 & 2033
- Table 11: Global Cell Therapy Manufacturing Market Revenue billion Forecast, by Therapy 2020 & 2033
- Table 12: Global Cell Therapy Manufacturing Market Volume K Unit Forecast, by Therapy 2020 & 2033
- Table 13: Global Cell Therapy Manufacturing Market Revenue billion Forecast, by Application 2020 & 2033
- Table 14: Global Cell Therapy Manufacturing Market Volume K Unit Forecast, by Application 2020 & 2033
- Table 15: Global Cell Therapy Manufacturing Market Revenue billion Forecast, by Country 2020 & 2033
- Table 16: Global Cell Therapy Manufacturing Market Volume K Unit Forecast, by Country 2020 & 2033
- Table 17: United States Cell Therapy Manufacturing Market Revenue (billion) Forecast, by Application 2020 & 2033
- Table 18: United States Cell Therapy Manufacturing Market Volume (K Unit) Forecast, by Application 2020 & 2033
- Table 19: Canada Cell Therapy Manufacturing Market Revenue (billion) Forecast, by Application 2020 & 2033
- Table 20: Canada Cell Therapy Manufacturing Market Volume (K Unit) Forecast, by Application 2020 & 2033
- Table 21: Mexico Cell Therapy Manufacturing Market Revenue (billion) Forecast, by Application 2020 & 2033
- Table 22: Mexico Cell Therapy Manufacturing Market Volume (K Unit) Forecast, by Application 2020 & 2033
- Table 23: Global Cell Therapy Manufacturing Market Revenue billion Forecast, by Type 2020 & 2033
- Table 24: Global Cell Therapy Manufacturing Market Volume K Unit Forecast, by Type 2020 & 2033
- Table 25: Global Cell Therapy Manufacturing Market Revenue billion Forecast, by Therapy 2020 & 2033
- Table 26: Global Cell Therapy Manufacturing Market Volume K Unit Forecast, by Therapy 2020 & 2033
- Table 27: Global Cell Therapy Manufacturing Market Revenue billion Forecast, by Application 2020 & 2033
- Table 28: Global Cell Therapy Manufacturing Market Volume K Unit Forecast, by Application 2020 & 2033
- Table 29: Global Cell Therapy Manufacturing Market Revenue billion Forecast, by Country 2020 & 2033
- Table 30: Global Cell Therapy Manufacturing Market Volume K Unit Forecast, by Country 2020 & 2033
- Table 31: Germany Cell Therapy Manufacturing Market Revenue (billion) Forecast, by Application 2020 & 2033
- Table 32: Germany Cell Therapy Manufacturing Market Volume (K Unit) Forecast, by Application 2020 & 2033
- Table 33: United Kingdom Cell Therapy Manufacturing Market Revenue (billion) Forecast, by Application 2020 & 2033
- Table 34: United Kingdom Cell Therapy Manufacturing Market Volume (K Unit) Forecast, by Application 2020 & 2033
- Table 35: France Cell Therapy Manufacturing Market Revenue (billion) Forecast, by Application 2020 & 2033
- Table 36: France Cell Therapy Manufacturing Market Volume (K Unit) Forecast, by Application 2020 & 2033
- Table 37: Italy Cell Therapy Manufacturing Market Revenue (billion) Forecast, by Application 2020 & 2033
- Table 38: Italy Cell Therapy Manufacturing Market Volume (K Unit) Forecast, by Application 2020 & 2033
- Table 39: Spain Cell Therapy Manufacturing Market Revenue (billion) Forecast, by Application 2020 & 2033
- Table 40: Spain Cell Therapy Manufacturing Market Volume (K Unit) Forecast, by Application 2020 & 2033
- Table 41: Rest of Europe Cell Therapy Manufacturing Market Revenue (billion) Forecast, by Application 2020 & 2033
- Table 42: Rest of Europe Cell Therapy Manufacturing Market Volume (K Unit) Forecast, by Application 2020 & 2033
- Table 43: Global Cell Therapy Manufacturing Market Revenue billion Forecast, by Type 2020 & 2033
- Table 44: Global Cell Therapy Manufacturing Market Volume K Unit Forecast, by Type 2020 & 2033
- Table 45: Global Cell Therapy Manufacturing Market Revenue billion Forecast, by Therapy 2020 & 2033
- Table 46: Global Cell Therapy Manufacturing Market Volume K Unit Forecast, by Therapy 2020 & 2033
- Table 47: Global Cell Therapy Manufacturing Market Revenue billion Forecast, by Application 2020 & 2033
- Table 48: Global Cell Therapy Manufacturing Market Volume K Unit Forecast, by Application 2020 & 2033
- Table 49: Global Cell Therapy Manufacturing Market Revenue billion Forecast, by Country 2020 & 2033
- Table 50: Global Cell Therapy Manufacturing Market Volume K Unit Forecast, by Country 2020 & 2033
- Table 51: China Cell Therapy Manufacturing Market Revenue (billion) Forecast, by Application 2020 & 2033
- Table 52: China Cell Therapy Manufacturing Market Volume (K Unit) Forecast, by Application 2020 & 2033
- Table 53: Japan Cell Therapy Manufacturing Market Revenue (billion) Forecast, by Application 2020 & 2033
- Table 54: Japan Cell Therapy Manufacturing Market Volume (K Unit) Forecast, by Application 2020 & 2033
- Table 55: India Cell Therapy Manufacturing Market Revenue (billion) Forecast, by Application 2020 & 2033
- Table 56: India Cell Therapy Manufacturing Market Volume (K Unit) Forecast, by Application 2020 & 2033
- Table 57: Australia Cell Therapy Manufacturing Market Revenue (billion) Forecast, by Application 2020 & 2033
- Table 58: Australia Cell Therapy Manufacturing Market Volume (K Unit) Forecast, by Application 2020 & 2033
- Table 59: South Korea Cell Therapy Manufacturing Market Revenue (billion) Forecast, by Application 2020 & 2033
- Table 60: South Korea Cell Therapy Manufacturing Market Volume (K Unit) Forecast, by Application 2020 & 2033
- Table 61: Rest of Asia Pacific Cell Therapy Manufacturing Market Revenue (billion) Forecast, by Application 2020 & 2033
- Table 62: Rest of Asia Pacific Cell Therapy Manufacturing Market Volume (K Unit) Forecast, by Application 2020 & 2033
- Table 63: Global Cell Therapy Manufacturing Market Revenue billion Forecast, by Type 2020 & 2033
- Table 64: Global Cell Therapy Manufacturing Market Volume K Unit Forecast, by Type 2020 & 2033
- Table 65: Global Cell Therapy Manufacturing Market Revenue billion Forecast, by Therapy 2020 & 2033
- Table 66: Global Cell Therapy Manufacturing Market Volume K Unit Forecast, by Therapy 2020 & 2033
- Table 67: Global Cell Therapy Manufacturing Market Revenue billion Forecast, by Application 2020 & 2033
- Table 68: Global Cell Therapy Manufacturing Market Volume K Unit Forecast, by Application 2020 & 2033
- Table 69: Global Cell Therapy Manufacturing Market Revenue billion Forecast, by Country 2020 & 2033
- Table 70: Global Cell Therapy Manufacturing Market Volume K Unit Forecast, by Country 2020 & 2033
- Table 71: GCC Cell Therapy Manufacturing Market Revenue (billion) Forecast, by Application 2020 & 2033
- Table 72: GCC Cell Therapy Manufacturing Market Volume (K Unit) Forecast, by Application 2020 & 2033
- Table 73: South Africa Cell Therapy Manufacturing Market Revenue (billion) Forecast, by Application 2020 & 2033
- Table 74: South Africa Cell Therapy Manufacturing Market Volume (K Unit) Forecast, by Application 2020 & 2033
- Table 75: Rest of Middle East and Africa Cell Therapy Manufacturing Market Revenue (billion) Forecast, by Application 2020 & 2033
- Table 76: Rest of Middle East and Africa Cell Therapy Manufacturing Market Volume (K Unit) Forecast, by Application 2020 & 2033
- Table 77: Global Cell Therapy Manufacturing Market Revenue billion Forecast, by Type 2020 & 2033
- Table 78: Global Cell Therapy Manufacturing Market Volume K Unit Forecast, by Type 2020 & 2033
- Table 79: Global Cell Therapy Manufacturing Market Revenue billion Forecast, by Therapy 2020 & 2033
- Table 80: Global Cell Therapy Manufacturing Market Volume K Unit Forecast, by Therapy 2020 & 2033
- Table 81: Global Cell Therapy Manufacturing Market Revenue billion Forecast, by Application 2020 & 2033
- Table 82: Global Cell Therapy Manufacturing Market Volume K Unit Forecast, by Application 2020 & 2033
- Table 83: Global Cell Therapy Manufacturing Market Revenue billion Forecast, by Country 2020 & 2033
- Table 84: Global Cell Therapy Manufacturing Market Volume K Unit Forecast, by Country 2020 & 2033
- Table 85: Brazil Cell Therapy Manufacturing Market Revenue (billion) Forecast, by Application 2020 & 2033
- Table 86: Brazil Cell Therapy Manufacturing Market Volume (K Unit) Forecast, by Application 2020 & 2033
- Table 87: Argentina Cell Therapy Manufacturing Market Revenue (billion) Forecast, by Application 2020 & 2033
- Table 88: Argentina Cell Therapy Manufacturing Market Volume (K Unit) Forecast, by Application 2020 & 2033
- Table 89: Rest of South America Cell Therapy Manufacturing Market Revenue (billion) Forecast, by Application 2020 & 2033
- Table 90: Rest of South America Cell Therapy Manufacturing Market Volume (K Unit) Forecast, by Application 2020 & 2033
Frequently Asked Questions
1. What is the projected Compound Annual Growth Rate (CAGR) of the Cell Therapy Manufacturing Market?
The projected CAGR is approximately 19%.
2. Which companies are prominent players in the Cell Therapy Manufacturing Market?
Key companies in the market include Fibrocell Technologies Inc, Gilead Sciences Inc (Kite Pharma Inc ), Allogene Therapeutics Inc, Stempeutics Research Pvt Ltd, Pharmicell Co Ltd, Novartis AG, Anterogen Co Ltd, Chiesi Farmaceutici SpA, Nipro Corporation, TiGenix (Takeda Pharmaceuticals), Organogenesis Inc , Vericel Corporation, Tego Science, MEDIPOST Co Ltd, Corestem Inc.
3. What are the main segments of the Cell Therapy Manufacturing Market?
The market segments include Type, Therapy, Application.
4. Can you provide details about the market size?
The market size is estimated to be USD 9.5 billion as of 2022.
5. What are some drivers contributing to market growth?
Increasing Prevalence of Chronic Conditions; Rising Adoption of Regenerative Medicine; Rise in Number of Clinical Studies Pertaining to the Development of Cellular Therapies.
6. What are the notable trends driving market growth?
The Allogeneic Therapies Segment is Expected to Account for a Significant Share in the Cell Therapy Market.
7. Are there any restraints impacting market growth?
High Cost of Therapies.
8. Can you provide examples of recent developments in the market?
In January 2022, Immunocore received the Food and Drug Administration approval of KIMMTRAK (tebentafusp-tebn) for the treatment of unresectable or metastatic uveal melanoma.
9. What pricing options are available for accessing the report?
Pricing options include single-user, multi-user, and enterprise licenses priced at USD 4750, USD 5250, and USD 8750 respectively.
10. Is the market size provided in terms of value or volume?
The market size is provided in terms of value, measured in billion and volume, measured in K Unit.
11. Are there any specific market keywords associated with the report?
Yes, the market keyword associated with the report is "Cell Therapy Manufacturing Market," which aids in identifying and referencing the specific market segment covered.
12. How do I determine which pricing option suits my needs best?
The pricing options vary based on user requirements and access needs. Individual users may opt for single-user licenses, while businesses requiring broader access may choose multi-user or enterprise licenses for cost-effective access to the report.
13. Are there any additional resources or data provided in the Cell Therapy Manufacturing Market report?
While the report offers comprehensive insights, it's advisable to review the specific contents or supplementary materials provided to ascertain if additional resources or data are available.
14. How can I stay updated on further developments or reports in the Cell Therapy Manufacturing Market?
To stay informed about further developments, trends, and reports in the Cell Therapy Manufacturing Market, consider subscribing to industry newsletters, following relevant companies and organizations, or regularly checking reputable industry news sources and publications.
Methodology
Step 1 - Identification of Relevant Samples Size from Population Database


Step 2 - Approaches for Defining Global Market Size (Value, Volume* & Price*)

Note*: In applicable scenarios
Step 3 - Data Sources
Primary Research
- Web Analytics
- Survey Reports
- Research Institute
- Latest Research Reports
- Opinion Leaders
Secondary Research
- Annual Reports
- White Paper
- Latest Press Release
- Industry Association
- Paid Database
- Investor Presentations

Step 4 - Data Triangulation
Involves using different sources of information in order to increase the validity of a study
These sources are likely to be stakeholders in a program - participants, other researchers, program staff, other community members, and so on.
Then we put all data in single framework & apply various statistical tools to find out the dynamic on the market.
During the analysis stage, feedback from the stakeholder groups would be compared to determine areas of agreement as well as areas of divergence