

Key Insights
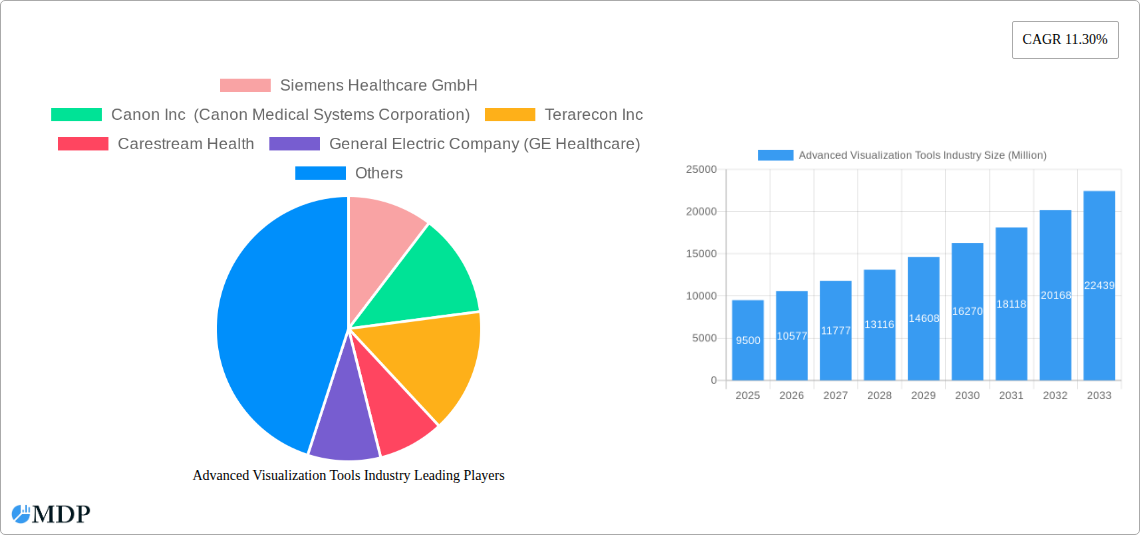
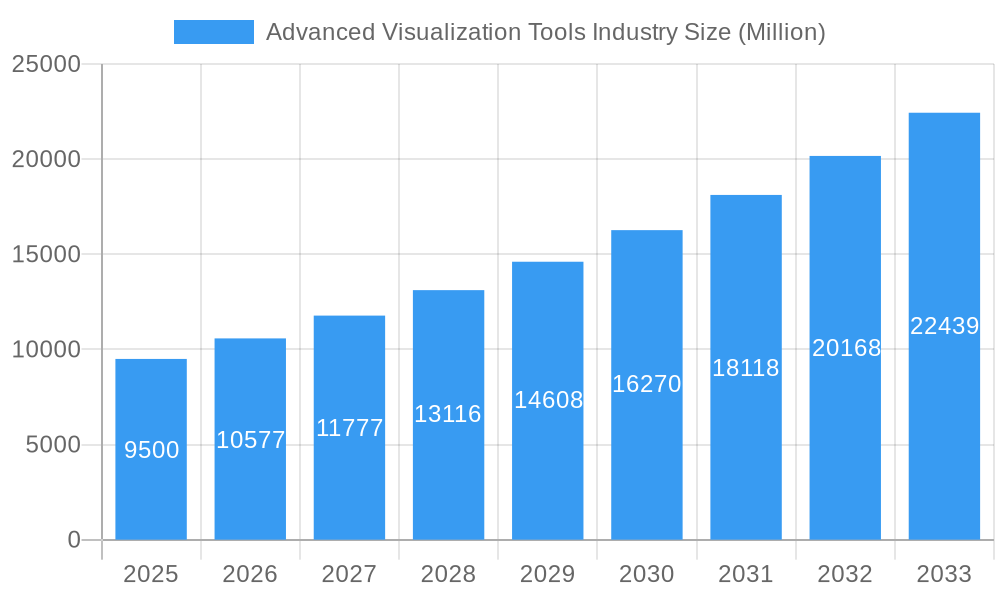
The Advanced Visualization Tools market is projected for substantial growth, with an estimated market size of $9.5 billion by 2025 and a Compound Annual Growth Rate (CAGR) of 11.30% through 2033. Key drivers include escalating demand for sophisticated diagnostic imaging, integration of AI/ML in visualization software, and increased adoption in oncology, neurology, and cardiovascular disease management. The emphasis on precision medicine and the need for enhanced diagnostic accuracy further fuel this growth. Continuous innovation in imaging modalities (MRI, CT, Ultrasound) and intuitive visualization software also contribute significantly. Emerging economies' investment in healthcare infrastructure is expanding adoption.
Advanced Visualization Tools Industry Market Size (In Billion)
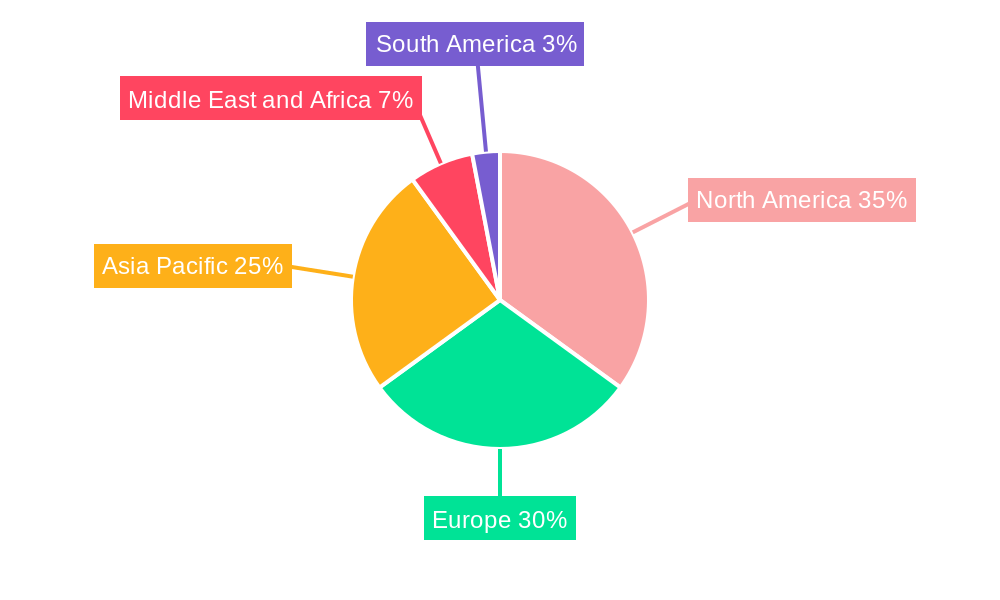
Market segmentation highlights the dominance of software and services within the Product and Service segment, while enterprise solutions lead in the Type of Solution segment. MRI and CT imaging modalities are primary consumers, with ultrasound and nuclear medicine experiencing accelerated adoption. Geographically, North America is forecast to lead with a 35% market share in 2025, followed by Europe with an estimated 30% share. The Asia Pacific region, with an estimated 25% share, is expected to exhibit the fastest growth, driven by a large patient pool and improving healthcare infrastructure.
Advanced Visualization Tools Industry Company Market Share
Gain comprehensive insights into the Advanced Visualization Tools market. This report provides a data-driven analysis of market dynamics, growth drivers, key players, and future trends, from 2019 to 2033, with a base year of 2025. Essential for medical imaging professionals, healthcare providers, software developers, and investors to make strategic decisions.
Advanced Visualization Tools Industry Market Dynamics & Concentration
The advanced visualization tools industry exhibits a moderate to high concentration, with a few key players dominating significant market share, estimated to be around 65% by 2025. Innovation remains a primary driver, fueled by continuous advancements in AI, machine learning, and cloud computing, leading to more sophisticated diagnostic and surgical planning capabilities. Regulatory frameworks, particularly in healthcare, play a crucial role, with stringent approval processes influencing market entry and product development. Product substitutes, while present in basic imaging, are less impactful for high-end visualization needs. End-user trends are heavily influenced by the increasing demand for minimally invasive procedures, personalized medicine, and remote patient monitoring, all of which benefit from advanced visualization. Merger and acquisition (M&A) activities are moderately active, with an estimated 15-20 significant deals annually, primarily focused on acquiring niche technologies or expanding market reach.
- Market Share Concentration: Top 5 players hold an estimated 65% market share in 2025.
- Innovation Drivers: AI/ML integration, cloud-based solutions, enhanced 3D rendering.
- Regulatory Influence: FDA, CE Mark approvals are critical for market access.
- M&A Activity: Approximately 15-20 significant deals per year.
Advanced Visualization Tools Industry Industry Trends & Analysis
The advanced visualization tools industry is poised for substantial growth, driven by an escalating demand for enhanced medical imaging analysis and interpretation. The global market is projected to witness a Compound Annual Growth Rate (CAGR) of approximately 12% from 2025 to 2033, reaching an estimated market size of over $50 Billion by the end of the forecast period. Technological disruptions, particularly the integration of artificial intelligence and machine learning algorithms into visualization software, are revolutionizing diagnostic accuracy and speed. AI-powered tools can now automate tedious tasks, identify subtle anomalies, and provide predictive insights, thereby improving patient outcomes. Consumer preferences are shifting towards solutions that offer greater diagnostic precision, workflow efficiency, and ease of use. Healthcare providers are increasingly investing in advanced visualization to support complex procedures, improve surgical planning, and enhance medical education. The competitive landscape is characterized by intense innovation and strategic partnerships, as companies strive to differentiate their offerings through superior performance, comprehensive features, and seamless integration with existing hospital IT infrastructures. The growing adoption of Picture Archiving and Communication Systems (PACS) and Electronic Health Records (EHR) further propels the demand for interoperable advanced visualization solutions. Furthermore, the increasing prevalence of chronic diseases globally necessitates more sophisticated diagnostic tools, directly contributing to market expansion. The penetration of advanced visualization technologies in emerging economies is also on the rise, as healthcare infrastructure improves and awareness of their benefits grows. This trend is expected to contribute significantly to overall market growth in the coming years.
Leading Markets & Segments in Advanced Visualization Tools Industry
North America currently leads the advanced visualization tools market, driven by early adoption of cutting-edge medical technologies, robust healthcare infrastructure, and significant R&D investments. The United States, in particular, accounts for a substantial portion of this regional dominance.
Product and Service:
- Software: This segment is experiencing the highest growth rate due to the increasing demand for AI-powered analytics, cloud-based platforms, and specialized application software for various clinical areas. Software is expected to capture over 55% of the market share by 2033.
- Hardware: While essential, hardware growth is steadier, driven by the need for high-performance workstations and specialized display technologies.
- Services: Growing demand for integration, training, and maintenance services supporting complex visualization systems.
Type of Solution:
- Enterprise Solutions: Dominant due to the integrated nature of hospital systems, offering comprehensive workflow management and data sharing capabilities.
- Standalone Solutions: Increasingly relevant for specialized clinical applications or research purposes.
Imaging Modality:
- Computed Tomography (CT): Continues to be a major driver, with advanced visualization enhancing the analysis of complex anatomical structures and pathologies.
- Magnetic Resonance Imaging (MRI): Significant growth driven by the increasing use of high-field MRI and the need for sophisticated visualization for neurological and musculoskeletal imaging.
- Ultrasound: Growing demand for advanced 3D/4D ultrasound and interventional guidance.
- Nuclear Medicine: Expanding applications with PET-CT and SPECT-CT integration.
Clinical Application:
- Cardiovascular: Leading segment due to the critical need for precise visualization of cardiac anatomy and blood flow for diagnosis and treatment planning of complex heart conditions.
- Oncology: Rapid growth driven by the demand for advanced imaging in cancer diagnosis, staging, treatment planning (radiotherapy), and monitoring.
- Neurology: Essential for analyzing brain structures, detecting neurological disorders, and planning neurosurgical interventions.
- Orthopedics: Increasing use for pre-operative planning of complex orthopedic surgeries and post-operative assessment.
Advanced Visualization Tools Industry Product Developments
Recent product developments in advanced visualization tools focus on enhancing diagnostic accuracy through AI-driven insights and improving surgical planning with immersive technologies. Innovations include real-time image processing, automated segmentation of anatomical structures, and the development of cloud-based platforms that facilitate seamless collaboration among geographically dispersed medical teams. These advancements offer competitive advantages by streamlining workflows, reducing scan times, and enabling more personalized patient care. The market is witnessing a surge in tools that integrate multi-modal imaging data for a holistic patient view, further solidifying their market fit.
Key Drivers of Advanced Visualization Tools Industry Growth
The advanced visualization tools industry is propelled by several key factors. Technological advancements, particularly in artificial intelligence and machine learning, are enhancing analytical capabilities and diagnostic precision. The growing global burden of chronic diseases necessitates more sophisticated imaging and interpretation, driving demand. Increasing healthcare expenditure worldwide, coupled with government initiatives to improve healthcare infrastructure, further fuels market expansion. Regulatory support for innovative medical technologies also plays a crucial role.
- Technological Advancements: AI/ML integration for enhanced diagnostics.
- Increasing Disease Prevalence: Rising cases of cardiovascular diseases, cancer, and neurological disorders.
- Healthcare Expenditure: Growth in global healthcare spending.
- Government Initiatives: Support for healthcare modernization and digital transformation.
Challenges in the Advanced Visualization Tools Industry Market
Despite robust growth, the advanced visualization tools industry faces several challenges. High implementation costs can be a significant barrier for smaller healthcare facilities. Stringent regulatory approval processes, while ensuring safety, can prolong time-to-market for new products. Data security and privacy concerns associated with handling sensitive patient imaging data are paramount and require robust cybersecurity measures. The need for specialized training for healthcare professionals to effectively utilize these advanced tools also presents a challenge.
- High Implementation Costs: Barrier for smaller healthcare providers.
- Regulatory Hurdles: Lengthy approval processes impacting time-to-market.
- Data Security & Privacy: Ensuring compliance and protecting patient information.
- Workforce Training: Requirement for specialized skills to operate advanced tools.
Emerging Opportunities in Advanced Visualization Tools Industry
Emerging opportunities in the advanced visualization tools industry are abundant, driven by technological breakthroughs and evolving healthcare needs. The integration of augmented reality (AR) and virtual reality (VR) for surgical training and intraoperative guidance presents a significant growth avenue. The expansion of cloud-based visualization platforms promises greater accessibility and scalability, especially for remote and underserved regions. Strategic partnerships between imaging equipment manufacturers, software developers, and AI specialists are creating synergistic solutions that address complex clinical challenges. The growing demand for personalized medicine, where visualization plays a critical role in tailoring treatments, offers further expansion potential.
Leading Players in the Advanced Visualization Tools Industry Sector
- Siemens Healthcare GmbH
- Canon Inc (Canon Medical Systems Corporation)
- Terarecon Inc
- Carestream Health
- General Electric Company (GE Healthcare)
- Koninklijke Philips NV
- Pro Medicus Ltd
- Agfa-Gevaert Group
- Fujifilm Holdings Corporation
Key Milestones in Advanced Visualization Tools Industry Industry
- August 2022: Kitware launched MIQA, a cloud-based application for medical image quality assurance. It facilitates collaboration and longitudinal studies by geographically diverse teams.
- February 2022: Siemens Healthineers and Universal Medical Imaging agreed to help primary healthcare institutions in China improve the efficiency of their image screening and disease diagnosis using advanced imaging diagnostic equipment and remote scanning assistant tools from Siemens Healthineers and the nationwide medical imaging experts at Universal Medical Imaging.
Strategic Outlook for Advanced Visualization Tools Industry Market
The strategic outlook for the advanced visualization tools industry is exceptionally positive, characterized by continuous innovation and expanding application horizons. Growth accelerators include the deepening integration of AI and machine learning for predictive diagnostics, the adoption of immersive technologies like AR/VR for surgical planning, and the expansion of cloud-based solutions for enhanced accessibility and collaboration. As healthcare systems globally prioritize efficiency, accuracy, and personalized patient care, the demand for sophisticated visualization tools will only intensify. Companies that focus on developing interoperable, user-friendly, and AI-enhanced platforms are best positioned for sustained success in this dynamic market.
Advanced Visualization Tools Industry Segmentation
-
1. Product and Service
- 1.1. Hardware
- 1.2. Software
- 1.3. Services
-
2. Type of Solution
- 2.1. Enterprise
- 2.2. Standalone
-
3. Imaging Modality
- 3.1. Magnetic Resonance Imaging (MRI)
- 3.2. Computed Tomography (CT)
- 3.3. Ultrasound
- 3.4. Nuclear Medicine
- 3.5. Other Imaging Modalities
-
4. Clinical Application
- 4.1. Oncology
- 4.2. Orthopedics
- 4.3. Cardiovascular
- 4.4. Neurology
- 4.5. Other Clinical Applications
Advanced Visualization Tools Industry Segmentation By Geography
-
1. North America
- 1.1. United States
- 1.2. Canada
- 1.3. Mexico
-
2. Europe
- 2.1. Germany
- 2.2. United Kingdom
- 2.3. France
- 2.4. Italy
- 2.5. Spain
- 2.6. Rest of Europe
-
3. Asia Pacific
- 3.1. China
- 3.2. Japan
- 3.3. India
- 3.4. Australia
- 3.5. South Korea
- 3.6. Rest of Asia Pacific
-
4. Middle East and Africa
- 4.1. GCC
- 4.2. South Africa
- 4.3. Rest of Middle East and Africa
-
5. South America
- 5.1. Brazil
- 5.2. Argentina
- 5.3. Rest of South America
Advanced Visualization Tools Industry Regional Market Share
Geographic Coverage of Advanced Visualization Tools Industry
Advanced Visualization Tools Industry REPORT HIGHLIGHTS
| Aspects | Details |
|---|---|
| Study Period | 2020-2034 |
| Base Year | 2025 |
| Estimated Year | 2026 |
| Forecast Period | 2026-2034 |
| Historical Period | 2020-2025 |
| Growth Rate | CAGR of 13.8% from 2020-2034 |
| Segmentation |
|
Table of Contents
- 1. Introduction
- 1.1. Research Scope
- 1.2. Market Segmentation
- 1.3. Research Objective
- 1.4. Definitions and Assumptions
- 2. Executive Summary
- 2.1. Market Snapshot
- 3. Market Dynamics
- 3.1. Market Drivers
- 3.2. Market Restrains
- 3.3. Market Trends
- 3.4. Market Opportunities
- 4. Market Factor Analysis
- 4.1. Porters Five Forces
- 4.1.1. Bargaining Power of Suppliers
- 4.1.2. Bargaining Power of Buyers
- 4.1.3. Threat of New Entrants
- 4.1.4. Threat of Substitutes
- 4.1.5. Competitive Rivalry
- 4.2. PESTEL analysis
- 4.3. BCG Analysis
- 4.3.1. Stars (High Growth, High Market Share)
- 4.3.2. Cash Cows (Low Growth, High Market Share)
- 4.3.3. Question Mark (High Growth, Low Market Share)
- 4.3.4. Dogs (Low Growth, Low Market Share)
- 4.4. Ansoff Matrix Analysis
- 4.5. Supply Chain Analysis
- 4.6. Regulatory Landscape
- 4.7. Current Market Potential and Opportunity Assessment (TAM–SAM–SOM Framework)
- 4.8. MDP Analyst Note
- 4.1. Porters Five Forces
- 5. Market Analysis, Insights and Forecast 2021-2033
- 5.1. Market Analysis, Insights and Forecast - by Product and Service
- 5.1.1. Hardware
- 5.1.2. Software
- 5.1.3. Services
- 5.2. Market Analysis, Insights and Forecast - by Type of Solution
- 5.2.1. Enterprise
- 5.2.2. Standalone
- 5.3. Market Analysis, Insights and Forecast - by Imaging Modality
- 5.3.1. Magnetic Resonance Imaging (MRI)
- 5.3.2. Computed Tomography (CT)
- 5.3.3. Ultrasound
- 5.3.4. Nuclear Medicine
- 5.3.5. Other Imaging Modalities
- 5.4. Market Analysis, Insights and Forecast - by Clinical Application
- 5.4.1. Oncology
- 5.4.2. Orthopedics
- 5.4.3. Cardiovascular
- 5.4.4. Neurology
- 5.4.5. Other Clinical Applications
- 5.5. Market Analysis, Insights and Forecast - by Region
- 5.5.1. North America
- 5.5.2. Europe
- 5.5.3. Asia Pacific
- 5.5.4. Middle East and Africa
- 5.5.5. South America
- 5.1. Market Analysis, Insights and Forecast - by Product and Service
- 6. Global Advanced Visualization Tools Industry Analysis, Insights and Forecast, 2021-2033
- 6.1. Market Analysis, Insights and Forecast - by Product and Service
- 6.1.1. Hardware
- 6.1.2. Software
- 6.1.3. Services
- 6.2. Market Analysis, Insights and Forecast - by Type of Solution
- 6.2.1. Enterprise
- 6.2.2. Standalone
- 6.3. Market Analysis, Insights and Forecast - by Imaging Modality
- 6.3.1. Magnetic Resonance Imaging (MRI)
- 6.3.2. Computed Tomography (CT)
- 6.3.3. Ultrasound
- 6.3.4. Nuclear Medicine
- 6.3.5. Other Imaging Modalities
- 6.4. Market Analysis, Insights and Forecast - by Clinical Application
- 6.4.1. Oncology
- 6.4.2. Orthopedics
- 6.4.3. Cardiovascular
- 6.4.4. Neurology
- 6.4.5. Other Clinical Applications
- 6.1. Market Analysis, Insights and Forecast - by Product and Service
- 7. North America Advanced Visualization Tools Industry Analysis, Insights and Forecast, 2020-2032
- 7.1. Market Analysis, Insights and Forecast - by Product and Service
- 7.1.1. Hardware
- 7.1.2. Software
- 7.1.3. Services
- 7.2. Market Analysis, Insights and Forecast - by Type of Solution
- 7.2.1. Enterprise
- 7.2.2. Standalone
- 7.3. Market Analysis, Insights and Forecast - by Imaging Modality
- 7.3.1. Magnetic Resonance Imaging (MRI)
- 7.3.2. Computed Tomography (CT)
- 7.3.3. Ultrasound
- 7.3.4. Nuclear Medicine
- 7.3.5. Other Imaging Modalities
- 7.4. Market Analysis, Insights and Forecast - by Clinical Application
- 7.4.1. Oncology
- 7.4.2. Orthopedics
- 7.4.3. Cardiovascular
- 7.4.4. Neurology
- 7.4.5. Other Clinical Applications
- 7.1. Market Analysis, Insights and Forecast - by Product and Service
- 8. Europe Advanced Visualization Tools Industry Analysis, Insights and Forecast, 2020-2032
- 8.1. Market Analysis, Insights and Forecast - by Product and Service
- 8.1.1. Hardware
- 8.1.2. Software
- 8.1.3. Services
- 8.2. Market Analysis, Insights and Forecast - by Type of Solution
- 8.2.1. Enterprise
- 8.2.2. Standalone
- 8.3. Market Analysis, Insights and Forecast - by Imaging Modality
- 8.3.1. Magnetic Resonance Imaging (MRI)
- 8.3.2. Computed Tomography (CT)
- 8.3.3. Ultrasound
- 8.3.4. Nuclear Medicine
- 8.3.5. Other Imaging Modalities
- 8.4. Market Analysis, Insights and Forecast - by Clinical Application
- 8.4.1. Oncology
- 8.4.2. Orthopedics
- 8.4.3. Cardiovascular
- 8.4.4. Neurology
- 8.4.5. Other Clinical Applications
- 8.1. Market Analysis, Insights and Forecast - by Product and Service
- 9. Asia Pacific Advanced Visualization Tools Industry Analysis, Insights and Forecast, 2020-2032
- 9.1. Market Analysis, Insights and Forecast - by Product and Service
- 9.1.1. Hardware
- 9.1.2. Software
- 9.1.3. Services
- 9.2. Market Analysis, Insights and Forecast - by Type of Solution
- 9.2.1. Enterprise
- 9.2.2. Standalone
- 9.3. Market Analysis, Insights and Forecast - by Imaging Modality
- 9.3.1. Magnetic Resonance Imaging (MRI)
- 9.3.2. Computed Tomography (CT)
- 9.3.3. Ultrasound
- 9.3.4. Nuclear Medicine
- 9.3.5. Other Imaging Modalities
- 9.4. Market Analysis, Insights and Forecast - by Clinical Application
- 9.4.1. Oncology
- 9.4.2. Orthopedics
- 9.4.3. Cardiovascular
- 9.4.4. Neurology
- 9.4.5. Other Clinical Applications
- 9.1. Market Analysis, Insights and Forecast - by Product and Service
- 10. Middle East and Africa Advanced Visualization Tools Industry Analysis, Insights and Forecast, 2020-2032
- 10.1. Market Analysis, Insights and Forecast - by Product and Service
- 10.1.1. Hardware
- 10.1.2. Software
- 10.1.3. Services
- 10.2. Market Analysis, Insights and Forecast - by Type of Solution
- 10.2.1. Enterprise
- 10.2.2. Standalone
- 10.3. Market Analysis, Insights and Forecast - by Imaging Modality
- 10.3.1. Magnetic Resonance Imaging (MRI)
- 10.3.2. Computed Tomography (CT)
- 10.3.3. Ultrasound
- 10.3.4. Nuclear Medicine
- 10.3.5. Other Imaging Modalities
- 10.4. Market Analysis, Insights and Forecast - by Clinical Application
- 10.4.1. Oncology
- 10.4.2. Orthopedics
- 10.4.3. Cardiovascular
- 10.4.4. Neurology
- 10.4.5. Other Clinical Applications
- 10.1. Market Analysis, Insights and Forecast - by Product and Service
- 11. South America Advanced Visualization Tools Industry Analysis, Insights and Forecast, 2020-2032
- 11.1. Market Analysis, Insights and Forecast - by Product and Service
- 11.1.1. Hardware
- 11.1.2. Software
- 11.1.3. Services
- 11.2. Market Analysis, Insights and Forecast - by Type of Solution
- 11.2.1. Enterprise
- 11.2.2. Standalone
- 11.3. Market Analysis, Insights and Forecast - by Imaging Modality
- 11.3.1. Magnetic Resonance Imaging (MRI)
- 11.3.2. Computed Tomography (CT)
- 11.3.3. Ultrasound
- 11.3.4. Nuclear Medicine
- 11.3.5. Other Imaging Modalities
- 11.4. Market Analysis, Insights and Forecast - by Clinical Application
- 11.4.1. Oncology
- 11.4.2. Orthopedics
- 11.4.3. Cardiovascular
- 11.4.4. Neurology
- 11.4.5. Other Clinical Applications
- 11.1. Market Analysis, Insights and Forecast - by Product and Service
- 12. Competitive Analysis
- 12.1. Company Profiles
- 12.1.1 Siemens Healthcare GmbH
- 12.1.1.1. Company Overview
- 12.1.1.2. Products
- 12.1.1.3. Company Financials
- 12.1.1.4. SWOT Analysis
- 12.1.2 Canon Inc (Canon Medical Systems Corporation)
- 12.1.2.1. Company Overview
- 12.1.2.2. Products
- 12.1.2.3. Company Financials
- 12.1.2.4. SWOT Analysis
- 12.1.3 Terarecon Inc
- 12.1.3.1. Company Overview
- 12.1.3.2. Products
- 12.1.3.3. Company Financials
- 12.1.3.4. SWOT Analysis
- 12.1.4 Carestream Health
- 12.1.4.1. Company Overview
- 12.1.4.2. Products
- 12.1.4.3. Company Financials
- 12.1.4.4. SWOT Analysis
- 12.1.5 General Electric Company (GE Healthcare)
- 12.1.5.1. Company Overview
- 12.1.5.2. Products
- 12.1.5.3. Company Financials
- 12.1.5.4. SWOT Analysis
- 12.1.6 Koninklijke Philips NV
- 12.1.6.1. Company Overview
- 12.1.6.2. Products
- 12.1.6.3. Company Financials
- 12.1.6.4. SWOT Analysis
- 12.1.7 Pro Medicus Ltd
- 12.1.7.1. Company Overview
- 12.1.7.2. Products
- 12.1.7.3. Company Financials
- 12.1.7.4. SWOT Analysis
- 12.1.8 Agfa-Gevaert Group
- 12.1.8.1. Company Overview
- 12.1.8.2. Products
- 12.1.8.3. Company Financials
- 12.1.8.4. SWOT Analysis
- 12.1.9 Fujifilm Holdings Corporation
- 12.1.9.1. Company Overview
- 12.1.9.2. Products
- 12.1.9.3. Company Financials
- 12.1.9.4. SWOT Analysis
- 12.1.1 Siemens Healthcare GmbH
- 12.2. Market Entropy
- 12.2.1 Company's Key Areas Served
- 12.2.2 Recent Developments
- 12.3. Company Market Share Analysis 2025
- 12.3.1 Top 5 Companies Market Share Analysis
- 12.3.2 Top 3 Companies Market Share Analysis
- 12.4. List of Potential Customers
- 13. Research Methodology
List of Figures
- Figure 1: Global Advanced Visualization Tools Industry Revenue Breakdown (billion, %) by Region 2025 & 2033
- Figure 2: Global Advanced Visualization Tools Industry Volume Breakdown (K Unit, %) by Region 2025 & 2033
- Figure 3: North America Advanced Visualization Tools Industry Revenue (billion), by Product and Service 2025 & 2033
- Figure 4: North America Advanced Visualization Tools Industry Volume (K Unit), by Product and Service 2025 & 2033
- Figure 5: North America Advanced Visualization Tools Industry Revenue Share (%), by Product and Service 2025 & 2033
- Figure 6: North America Advanced Visualization Tools Industry Volume Share (%), by Product and Service 2025 & 2033
- Figure 7: North America Advanced Visualization Tools Industry Revenue (billion), by Type of Solution 2025 & 2033
- Figure 8: North America Advanced Visualization Tools Industry Volume (K Unit), by Type of Solution 2025 & 2033
- Figure 9: North America Advanced Visualization Tools Industry Revenue Share (%), by Type of Solution 2025 & 2033
- Figure 10: North America Advanced Visualization Tools Industry Volume Share (%), by Type of Solution 2025 & 2033
- Figure 11: North America Advanced Visualization Tools Industry Revenue (billion), by Imaging Modality 2025 & 2033
- Figure 12: North America Advanced Visualization Tools Industry Volume (K Unit), by Imaging Modality 2025 & 2033
- Figure 13: North America Advanced Visualization Tools Industry Revenue Share (%), by Imaging Modality 2025 & 2033
- Figure 14: North America Advanced Visualization Tools Industry Volume Share (%), by Imaging Modality 2025 & 2033
- Figure 15: North America Advanced Visualization Tools Industry Revenue (billion), by Clinical Application 2025 & 2033
- Figure 16: North America Advanced Visualization Tools Industry Volume (K Unit), by Clinical Application 2025 & 2033
- Figure 17: North America Advanced Visualization Tools Industry Revenue Share (%), by Clinical Application 2025 & 2033
- Figure 18: North America Advanced Visualization Tools Industry Volume Share (%), by Clinical Application 2025 & 2033
- Figure 19: North America Advanced Visualization Tools Industry Revenue (billion), by Country 2025 & 2033
- Figure 20: North America Advanced Visualization Tools Industry Volume (K Unit), by Country 2025 & 2033
- Figure 21: North America Advanced Visualization Tools Industry Revenue Share (%), by Country 2025 & 2033
- Figure 22: North America Advanced Visualization Tools Industry Volume Share (%), by Country 2025 & 2033
- Figure 23: Europe Advanced Visualization Tools Industry Revenue (billion), by Product and Service 2025 & 2033
- Figure 24: Europe Advanced Visualization Tools Industry Volume (K Unit), by Product and Service 2025 & 2033
- Figure 25: Europe Advanced Visualization Tools Industry Revenue Share (%), by Product and Service 2025 & 2033
- Figure 26: Europe Advanced Visualization Tools Industry Volume Share (%), by Product and Service 2025 & 2033
- Figure 27: Europe Advanced Visualization Tools Industry Revenue (billion), by Type of Solution 2025 & 2033
- Figure 28: Europe Advanced Visualization Tools Industry Volume (K Unit), by Type of Solution 2025 & 2033
- Figure 29: Europe Advanced Visualization Tools Industry Revenue Share (%), by Type of Solution 2025 & 2033
- Figure 30: Europe Advanced Visualization Tools Industry Volume Share (%), by Type of Solution 2025 & 2033
- Figure 31: Europe Advanced Visualization Tools Industry Revenue (billion), by Imaging Modality 2025 & 2033
- Figure 32: Europe Advanced Visualization Tools Industry Volume (K Unit), by Imaging Modality 2025 & 2033
- Figure 33: Europe Advanced Visualization Tools Industry Revenue Share (%), by Imaging Modality 2025 & 2033
- Figure 34: Europe Advanced Visualization Tools Industry Volume Share (%), by Imaging Modality 2025 & 2033
- Figure 35: Europe Advanced Visualization Tools Industry Revenue (billion), by Clinical Application 2025 & 2033
- Figure 36: Europe Advanced Visualization Tools Industry Volume (K Unit), by Clinical Application 2025 & 2033
- Figure 37: Europe Advanced Visualization Tools Industry Revenue Share (%), by Clinical Application 2025 & 2033
- Figure 38: Europe Advanced Visualization Tools Industry Volume Share (%), by Clinical Application 2025 & 2033
- Figure 39: Europe Advanced Visualization Tools Industry Revenue (billion), by Country 2025 & 2033
- Figure 40: Europe Advanced Visualization Tools Industry Volume (K Unit), by Country 2025 & 2033
- Figure 41: Europe Advanced Visualization Tools Industry Revenue Share (%), by Country 2025 & 2033
- Figure 42: Europe Advanced Visualization Tools Industry Volume Share (%), by Country 2025 & 2033
- Figure 43: Asia Pacific Advanced Visualization Tools Industry Revenue (billion), by Product and Service 2025 & 2033
- Figure 44: Asia Pacific Advanced Visualization Tools Industry Volume (K Unit), by Product and Service 2025 & 2033
- Figure 45: Asia Pacific Advanced Visualization Tools Industry Revenue Share (%), by Product and Service 2025 & 2033
- Figure 46: Asia Pacific Advanced Visualization Tools Industry Volume Share (%), by Product and Service 2025 & 2033
- Figure 47: Asia Pacific Advanced Visualization Tools Industry Revenue (billion), by Type of Solution 2025 & 2033
- Figure 48: Asia Pacific Advanced Visualization Tools Industry Volume (K Unit), by Type of Solution 2025 & 2033
- Figure 49: Asia Pacific Advanced Visualization Tools Industry Revenue Share (%), by Type of Solution 2025 & 2033
- Figure 50: Asia Pacific Advanced Visualization Tools Industry Volume Share (%), by Type of Solution 2025 & 2033
- Figure 51: Asia Pacific Advanced Visualization Tools Industry Revenue (billion), by Imaging Modality 2025 & 2033
- Figure 52: Asia Pacific Advanced Visualization Tools Industry Volume (K Unit), by Imaging Modality 2025 & 2033
- Figure 53: Asia Pacific Advanced Visualization Tools Industry Revenue Share (%), by Imaging Modality 2025 & 2033
- Figure 54: Asia Pacific Advanced Visualization Tools Industry Volume Share (%), by Imaging Modality 2025 & 2033
- Figure 55: Asia Pacific Advanced Visualization Tools Industry Revenue (billion), by Clinical Application 2025 & 2033
- Figure 56: Asia Pacific Advanced Visualization Tools Industry Volume (K Unit), by Clinical Application 2025 & 2033
- Figure 57: Asia Pacific Advanced Visualization Tools Industry Revenue Share (%), by Clinical Application 2025 & 2033
- Figure 58: Asia Pacific Advanced Visualization Tools Industry Volume Share (%), by Clinical Application 2025 & 2033
- Figure 59: Asia Pacific Advanced Visualization Tools Industry Revenue (billion), by Country 2025 & 2033
- Figure 60: Asia Pacific Advanced Visualization Tools Industry Volume (K Unit), by Country 2025 & 2033
- Figure 61: Asia Pacific Advanced Visualization Tools Industry Revenue Share (%), by Country 2025 & 2033
- Figure 62: Asia Pacific Advanced Visualization Tools Industry Volume Share (%), by Country 2025 & 2033
- Figure 63: Middle East and Africa Advanced Visualization Tools Industry Revenue (billion), by Product and Service 2025 & 2033
- Figure 64: Middle East and Africa Advanced Visualization Tools Industry Volume (K Unit), by Product and Service 2025 & 2033
- Figure 65: Middle East and Africa Advanced Visualization Tools Industry Revenue Share (%), by Product and Service 2025 & 2033
- Figure 66: Middle East and Africa Advanced Visualization Tools Industry Volume Share (%), by Product and Service 2025 & 2033
- Figure 67: Middle East and Africa Advanced Visualization Tools Industry Revenue (billion), by Type of Solution 2025 & 2033
- Figure 68: Middle East and Africa Advanced Visualization Tools Industry Volume (K Unit), by Type of Solution 2025 & 2033
- Figure 69: Middle East and Africa Advanced Visualization Tools Industry Revenue Share (%), by Type of Solution 2025 & 2033
- Figure 70: Middle East and Africa Advanced Visualization Tools Industry Volume Share (%), by Type of Solution 2025 & 2033
- Figure 71: Middle East and Africa Advanced Visualization Tools Industry Revenue (billion), by Imaging Modality 2025 & 2033
- Figure 72: Middle East and Africa Advanced Visualization Tools Industry Volume (K Unit), by Imaging Modality 2025 & 2033
- Figure 73: Middle East and Africa Advanced Visualization Tools Industry Revenue Share (%), by Imaging Modality 2025 & 2033
- Figure 74: Middle East and Africa Advanced Visualization Tools Industry Volume Share (%), by Imaging Modality 2025 & 2033
- Figure 75: Middle East and Africa Advanced Visualization Tools Industry Revenue (billion), by Clinical Application 2025 & 2033
- Figure 76: Middle East and Africa Advanced Visualization Tools Industry Volume (K Unit), by Clinical Application 2025 & 2033
- Figure 77: Middle East and Africa Advanced Visualization Tools Industry Revenue Share (%), by Clinical Application 2025 & 2033
- Figure 78: Middle East and Africa Advanced Visualization Tools Industry Volume Share (%), by Clinical Application 2025 & 2033
- Figure 79: Middle East and Africa Advanced Visualization Tools Industry Revenue (billion), by Country 2025 & 2033
- Figure 80: Middle East and Africa Advanced Visualization Tools Industry Volume (K Unit), by Country 2025 & 2033
- Figure 81: Middle East and Africa Advanced Visualization Tools Industry Revenue Share (%), by Country 2025 & 2033
- Figure 82: Middle East and Africa Advanced Visualization Tools Industry Volume Share (%), by Country 2025 & 2033
- Figure 83: South America Advanced Visualization Tools Industry Revenue (billion), by Product and Service 2025 & 2033
- Figure 84: South America Advanced Visualization Tools Industry Volume (K Unit), by Product and Service 2025 & 2033
- Figure 85: South America Advanced Visualization Tools Industry Revenue Share (%), by Product and Service 2025 & 2033
- Figure 86: South America Advanced Visualization Tools Industry Volume Share (%), by Product and Service 2025 & 2033
- Figure 87: South America Advanced Visualization Tools Industry Revenue (billion), by Type of Solution 2025 & 2033
- Figure 88: South America Advanced Visualization Tools Industry Volume (K Unit), by Type of Solution 2025 & 2033
- Figure 89: South America Advanced Visualization Tools Industry Revenue Share (%), by Type of Solution 2025 & 2033
- Figure 90: South America Advanced Visualization Tools Industry Volume Share (%), by Type of Solution 2025 & 2033
- Figure 91: South America Advanced Visualization Tools Industry Revenue (billion), by Imaging Modality 2025 & 2033
- Figure 92: South America Advanced Visualization Tools Industry Volume (K Unit), by Imaging Modality 2025 & 2033
- Figure 93: South America Advanced Visualization Tools Industry Revenue Share (%), by Imaging Modality 2025 & 2033
- Figure 94: South America Advanced Visualization Tools Industry Volume Share (%), by Imaging Modality 2025 & 2033
- Figure 95: South America Advanced Visualization Tools Industry Revenue (billion), by Clinical Application 2025 & 2033
- Figure 96: South America Advanced Visualization Tools Industry Volume (K Unit), by Clinical Application 2025 & 2033
- Figure 97: South America Advanced Visualization Tools Industry Revenue Share (%), by Clinical Application 2025 & 2033
- Figure 98: South America Advanced Visualization Tools Industry Volume Share (%), by Clinical Application 2025 & 2033
- Figure 99: South America Advanced Visualization Tools Industry Revenue (billion), by Country 2025 & 2033
- Figure 100: South America Advanced Visualization Tools Industry Volume (K Unit), by Country 2025 & 2033
- Figure 101: South America Advanced Visualization Tools Industry Revenue Share (%), by Country 2025 & 2033
- Figure 102: South America Advanced Visualization Tools Industry Volume Share (%), by Country 2025 & 2033
List of Tables
- Table 1: Global Advanced Visualization Tools Industry Revenue billion Forecast, by Product and Service 2020 & 2033
- Table 2: Global Advanced Visualization Tools Industry Volume K Unit Forecast, by Product and Service 2020 & 2033
- Table 3: Global Advanced Visualization Tools Industry Revenue billion Forecast, by Type of Solution 2020 & 2033
- Table 4: Global Advanced Visualization Tools Industry Volume K Unit Forecast, by Type of Solution 2020 & 2033
- Table 5: Global Advanced Visualization Tools Industry Revenue billion Forecast, by Imaging Modality 2020 & 2033
- Table 6: Global Advanced Visualization Tools Industry Volume K Unit Forecast, by Imaging Modality 2020 & 2033
- Table 7: Global Advanced Visualization Tools Industry Revenue billion Forecast, by Clinical Application 2020 & 2033
- Table 8: Global Advanced Visualization Tools Industry Volume K Unit Forecast, by Clinical Application 2020 & 2033
- Table 9: Global Advanced Visualization Tools Industry Revenue billion Forecast, by Region 2020 & 2033
- Table 10: Global Advanced Visualization Tools Industry Volume K Unit Forecast, by Region 2020 & 2033
- Table 11: Global Advanced Visualization Tools Industry Revenue billion Forecast, by Product and Service 2020 & 2033
- Table 12: Global Advanced Visualization Tools Industry Volume K Unit Forecast, by Product and Service 2020 & 2033
- Table 13: Global Advanced Visualization Tools Industry Revenue billion Forecast, by Type of Solution 2020 & 2033
- Table 14: Global Advanced Visualization Tools Industry Volume K Unit Forecast, by Type of Solution 2020 & 2033
- Table 15: Global Advanced Visualization Tools Industry Revenue billion Forecast, by Imaging Modality 2020 & 2033
- Table 16: Global Advanced Visualization Tools Industry Volume K Unit Forecast, by Imaging Modality 2020 & 2033
- Table 17: Global Advanced Visualization Tools Industry Revenue billion Forecast, by Clinical Application 2020 & 2033
- Table 18: Global Advanced Visualization Tools Industry Volume K Unit Forecast, by Clinical Application 2020 & 2033
- Table 19: Global Advanced Visualization Tools Industry Revenue billion Forecast, by Country 2020 & 2033
- Table 20: Global Advanced Visualization Tools Industry Volume K Unit Forecast, by Country 2020 & 2033
- Table 21: United States Advanced Visualization Tools Industry Revenue (billion) Forecast, by Application 2020 & 2033
- Table 22: United States Advanced Visualization Tools Industry Volume (K Unit) Forecast, by Application 2020 & 2033
- Table 23: Canada Advanced Visualization Tools Industry Revenue (billion) Forecast, by Application 2020 & 2033
- Table 24: Canada Advanced Visualization Tools Industry Volume (K Unit) Forecast, by Application 2020 & 2033
- Table 25: Mexico Advanced Visualization Tools Industry Revenue (billion) Forecast, by Application 2020 & 2033
- Table 26: Mexico Advanced Visualization Tools Industry Volume (K Unit) Forecast, by Application 2020 & 2033
- Table 27: Global Advanced Visualization Tools Industry Revenue billion Forecast, by Product and Service 2020 & 2033
- Table 28: Global Advanced Visualization Tools Industry Volume K Unit Forecast, by Product and Service 2020 & 2033
- Table 29: Global Advanced Visualization Tools Industry Revenue billion Forecast, by Type of Solution 2020 & 2033
- Table 30: Global Advanced Visualization Tools Industry Volume K Unit Forecast, by Type of Solution 2020 & 2033
- Table 31: Global Advanced Visualization Tools Industry Revenue billion Forecast, by Imaging Modality 2020 & 2033
- Table 32: Global Advanced Visualization Tools Industry Volume K Unit Forecast, by Imaging Modality 2020 & 2033
- Table 33: Global Advanced Visualization Tools Industry Revenue billion Forecast, by Clinical Application 2020 & 2033
- Table 34: Global Advanced Visualization Tools Industry Volume K Unit Forecast, by Clinical Application 2020 & 2033
- Table 35: Global Advanced Visualization Tools Industry Revenue billion Forecast, by Country 2020 & 2033
- Table 36: Global Advanced Visualization Tools Industry Volume K Unit Forecast, by Country 2020 & 2033
- Table 37: Germany Advanced Visualization Tools Industry Revenue (billion) Forecast, by Application 2020 & 2033
- Table 38: Germany Advanced Visualization Tools Industry Volume (K Unit) Forecast, by Application 2020 & 2033
- Table 39: United Kingdom Advanced Visualization Tools Industry Revenue (billion) Forecast, by Application 2020 & 2033
- Table 40: United Kingdom Advanced Visualization Tools Industry Volume (K Unit) Forecast, by Application 2020 & 2033
- Table 41: France Advanced Visualization Tools Industry Revenue (billion) Forecast, by Application 2020 & 2033
- Table 42: France Advanced Visualization Tools Industry Volume (K Unit) Forecast, by Application 2020 & 2033
- Table 43: Italy Advanced Visualization Tools Industry Revenue (billion) Forecast, by Application 2020 & 2033
- Table 44: Italy Advanced Visualization Tools Industry Volume (K Unit) Forecast, by Application 2020 & 2033
- Table 45: Spain Advanced Visualization Tools Industry Revenue (billion) Forecast, by Application 2020 & 2033
- Table 46: Spain Advanced Visualization Tools Industry Volume (K Unit) Forecast, by Application 2020 & 2033
- Table 47: Rest of Europe Advanced Visualization Tools Industry Revenue (billion) Forecast, by Application 2020 & 2033
- Table 48: Rest of Europe Advanced Visualization Tools Industry Volume (K Unit) Forecast, by Application 2020 & 2033
- Table 49: Global Advanced Visualization Tools Industry Revenue billion Forecast, by Product and Service 2020 & 2033
- Table 50: Global Advanced Visualization Tools Industry Volume K Unit Forecast, by Product and Service 2020 & 2033
- Table 51: Global Advanced Visualization Tools Industry Revenue billion Forecast, by Type of Solution 2020 & 2033
- Table 52: Global Advanced Visualization Tools Industry Volume K Unit Forecast, by Type of Solution 2020 & 2033
- Table 53: Global Advanced Visualization Tools Industry Revenue billion Forecast, by Imaging Modality 2020 & 2033
- Table 54: Global Advanced Visualization Tools Industry Volume K Unit Forecast, by Imaging Modality 2020 & 2033
- Table 55: Global Advanced Visualization Tools Industry Revenue billion Forecast, by Clinical Application 2020 & 2033
- Table 56: Global Advanced Visualization Tools Industry Volume K Unit Forecast, by Clinical Application 2020 & 2033
- Table 57: Global Advanced Visualization Tools Industry Revenue billion Forecast, by Country 2020 & 2033
- Table 58: Global Advanced Visualization Tools Industry Volume K Unit Forecast, by Country 2020 & 2033
- Table 59: China Advanced Visualization Tools Industry Revenue (billion) Forecast, by Application 2020 & 2033
- Table 60: China Advanced Visualization Tools Industry Volume (K Unit) Forecast, by Application 2020 & 2033
- Table 61: Japan Advanced Visualization Tools Industry Revenue (billion) Forecast, by Application 2020 & 2033
- Table 62: Japan Advanced Visualization Tools Industry Volume (K Unit) Forecast, by Application 2020 & 2033
- Table 63: India Advanced Visualization Tools Industry Revenue (billion) Forecast, by Application 2020 & 2033
- Table 64: India Advanced Visualization Tools Industry Volume (K Unit) Forecast, by Application 2020 & 2033
- Table 65: Australia Advanced Visualization Tools Industry Revenue (billion) Forecast, by Application 2020 & 2033
- Table 66: Australia Advanced Visualization Tools Industry Volume (K Unit) Forecast, by Application 2020 & 2033
- Table 67: South Korea Advanced Visualization Tools Industry Revenue (billion) Forecast, by Application 2020 & 2033
- Table 68: South Korea Advanced Visualization Tools Industry Volume (K Unit) Forecast, by Application 2020 & 2033
- Table 69: Rest of Asia Pacific Advanced Visualization Tools Industry Revenue (billion) Forecast, by Application 2020 & 2033
- Table 70: Rest of Asia Pacific Advanced Visualization Tools Industry Volume (K Unit) Forecast, by Application 2020 & 2033
- Table 71: Global Advanced Visualization Tools Industry Revenue billion Forecast, by Product and Service 2020 & 2033
- Table 72: Global Advanced Visualization Tools Industry Volume K Unit Forecast, by Product and Service 2020 & 2033
- Table 73: Global Advanced Visualization Tools Industry Revenue billion Forecast, by Type of Solution 2020 & 2033
- Table 74: Global Advanced Visualization Tools Industry Volume K Unit Forecast, by Type of Solution 2020 & 2033
- Table 75: Global Advanced Visualization Tools Industry Revenue billion Forecast, by Imaging Modality 2020 & 2033
- Table 76: Global Advanced Visualization Tools Industry Volume K Unit Forecast, by Imaging Modality 2020 & 2033
- Table 77: Global Advanced Visualization Tools Industry Revenue billion Forecast, by Clinical Application 2020 & 2033
- Table 78: Global Advanced Visualization Tools Industry Volume K Unit Forecast, by Clinical Application 2020 & 2033
- Table 79: Global Advanced Visualization Tools Industry Revenue billion Forecast, by Country 2020 & 2033
- Table 80: Global Advanced Visualization Tools Industry Volume K Unit Forecast, by Country 2020 & 2033
- Table 81: GCC Advanced Visualization Tools Industry Revenue (billion) Forecast, by Application 2020 & 2033
- Table 82: GCC Advanced Visualization Tools Industry Volume (K Unit) Forecast, by Application 2020 & 2033
- Table 83: South Africa Advanced Visualization Tools Industry Revenue (billion) Forecast, by Application 2020 & 2033
- Table 84: South Africa Advanced Visualization Tools Industry Volume (K Unit) Forecast, by Application 2020 & 2033
- Table 85: Rest of Middle East and Africa Advanced Visualization Tools Industry Revenue (billion) Forecast, by Application 2020 & 2033
- Table 86: Rest of Middle East and Africa Advanced Visualization Tools Industry Volume (K Unit) Forecast, by Application 2020 & 2033
- Table 87: Global Advanced Visualization Tools Industry Revenue billion Forecast, by Product and Service 2020 & 2033
- Table 88: Global Advanced Visualization Tools Industry Volume K Unit Forecast, by Product and Service 2020 & 2033
- Table 89: Global Advanced Visualization Tools Industry Revenue billion Forecast, by Type of Solution 2020 & 2033
- Table 90: Global Advanced Visualization Tools Industry Volume K Unit Forecast, by Type of Solution 2020 & 2033
- Table 91: Global Advanced Visualization Tools Industry Revenue billion Forecast, by Imaging Modality 2020 & 2033
- Table 92: Global Advanced Visualization Tools Industry Volume K Unit Forecast, by Imaging Modality 2020 & 2033
- Table 93: Global Advanced Visualization Tools Industry Revenue billion Forecast, by Clinical Application 2020 & 2033
- Table 94: Global Advanced Visualization Tools Industry Volume K Unit Forecast, by Clinical Application 2020 & 2033
- Table 95: Global Advanced Visualization Tools Industry Revenue billion Forecast, by Country 2020 & 2033
- Table 96: Global Advanced Visualization Tools Industry Volume K Unit Forecast, by Country 2020 & 2033
- Table 97: Brazil Advanced Visualization Tools Industry Revenue (billion) Forecast, by Application 2020 & 2033
- Table 98: Brazil Advanced Visualization Tools Industry Volume (K Unit) Forecast, by Application 2020 & 2033
- Table 99: Argentina Advanced Visualization Tools Industry Revenue (billion) Forecast, by Application 2020 & 2033
- Table 100: Argentina Advanced Visualization Tools Industry Volume (K Unit) Forecast, by Application 2020 & 2033
- Table 101: Rest of South America Advanced Visualization Tools Industry Revenue (billion) Forecast, by Application 2020 & 2033
- Table 102: Rest of South America Advanced Visualization Tools Industry Volume (K Unit) Forecast, by Application 2020 & 2033
Frequently Asked Questions
1. What is the projected Compound Annual Growth Rate (CAGR) of the Advanced Visualization Tools Industry?
The projected CAGR is approximately 13.8%.
2. Which companies are prominent players in the Advanced Visualization Tools Industry?
Key companies in the market include Siemens Healthcare GmbH, Canon Inc (Canon Medical Systems Corporation), Terarecon Inc , Carestream Health, General Electric Company (GE Healthcare), Koninklijke Philips NV, Pro Medicus Ltd, Agfa-Gevaert Group, Fujifilm Holdings Corporation.
3. What are the main segments of the Advanced Visualization Tools Industry?
The market segments include Product and Service, Type of Solution, Imaging Modality, Clinical Application.
4. Can you provide details about the market size?
The market size is estimated to be USD 4.14 billion as of 2022.
5. What are some drivers contributing to market growth?
Increasing Prevalence of Chronic Diseases Coupled With Growing Geriatric Population; Rising Awareness of Benefits associated with Advanced Visualization Tools in Disease Diagnosis.
6. What are the notable trends driving market growth?
Oncology Under Clinical Application Expected to Grow Over the Forecast Period.
7. Are there any restraints impacting market growth?
Limited Availability of Reimbursements for Radiology-Based Diagnostic Procedures.
8. Can you provide examples of recent developments in the market?
August 2022: Kitware launched MIQA, a cloud-based application for medical image quality assurance. It facilitates collaboration and longitudinal studies by geographically diverse teams.
9. What pricing options are available for accessing the report?
Pricing options include single-user, multi-user, and enterprise licenses priced at USD 4750, USD 5250, and USD 8750 respectively.
10. Is the market size provided in terms of value or volume?
The market size is provided in terms of value, measured in billion and volume, measured in K Unit.
11. Are there any specific market keywords associated with the report?
Yes, the market keyword associated with the report is "Advanced Visualization Tools Industry," which aids in identifying and referencing the specific market segment covered.
12. How do I determine which pricing option suits my needs best?
The pricing options vary based on user requirements and access needs. Individual users may opt for single-user licenses, while businesses requiring broader access may choose multi-user or enterprise licenses for cost-effective access to the report.
13. Are there any additional resources or data provided in the Advanced Visualization Tools Industry report?
While the report offers comprehensive insights, it's advisable to review the specific contents or supplementary materials provided to ascertain if additional resources or data are available.
14. How can I stay updated on further developments or reports in the Advanced Visualization Tools Industry?
To stay informed about further developments, trends, and reports in the Advanced Visualization Tools Industry, consider subscribing to industry newsletters, following relevant companies and organizations, or regularly checking reputable industry news sources and publications.
Methodology
Step 1 - Identification of Relevant Samples Size from Population Database


Step 2 - Approaches for Defining Global Market Size (Value, Volume* & Price*)

Note*: In applicable scenarios
Step 3 - Data Sources
Primary Research
- Web Analytics
- Survey Reports
- Research Institute
- Latest Research Reports
- Opinion Leaders
Secondary Research
- Annual Reports
- White Paper
- Latest Press Release
- Industry Association
- Paid Database
- Investor Presentations

Step 4 - Data Triangulation
Involves using different sources of information in order to increase the validity of a study
These sources are likely to be stakeholders in a program - participants, other researchers, program staff, other community members, and so on.
Then we put all data in single framework & apply various statistical tools to find out the dynamic on the market.
During the analysis stage, feedback from the stakeholder groups would be compared to determine areas of agreement as well as areas of divergence