

Key Insights
The In Vitro Diagnostics (IVD) Quality Control market is projected to reach $5.5 billion by 2025, expanding at a Compound Annual Growth Rate (CAGR) of 4.1% through 2033. This growth is propelled by the escalating need for precise diagnostic results, the rise in infectious diseases, and continuous technological advancements. Stringent regulatory mandates for IVD product quality also drive significant investment in comprehensive quality control solutions. Enhanced healthcare infrastructure, particularly in emerging economies, and the increased adoption of automation in clinical laboratories present substantial market opportunities.
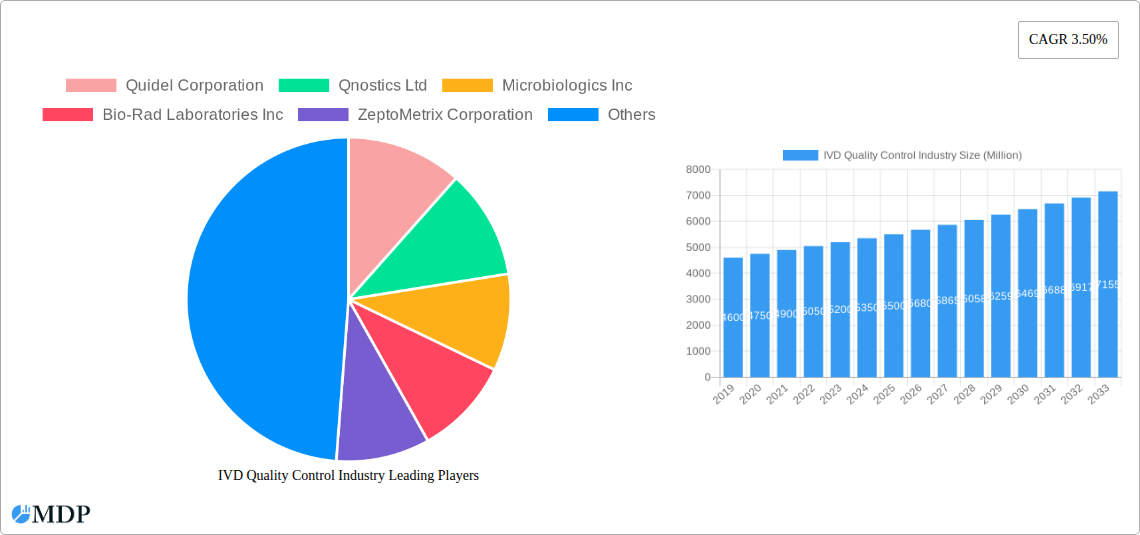
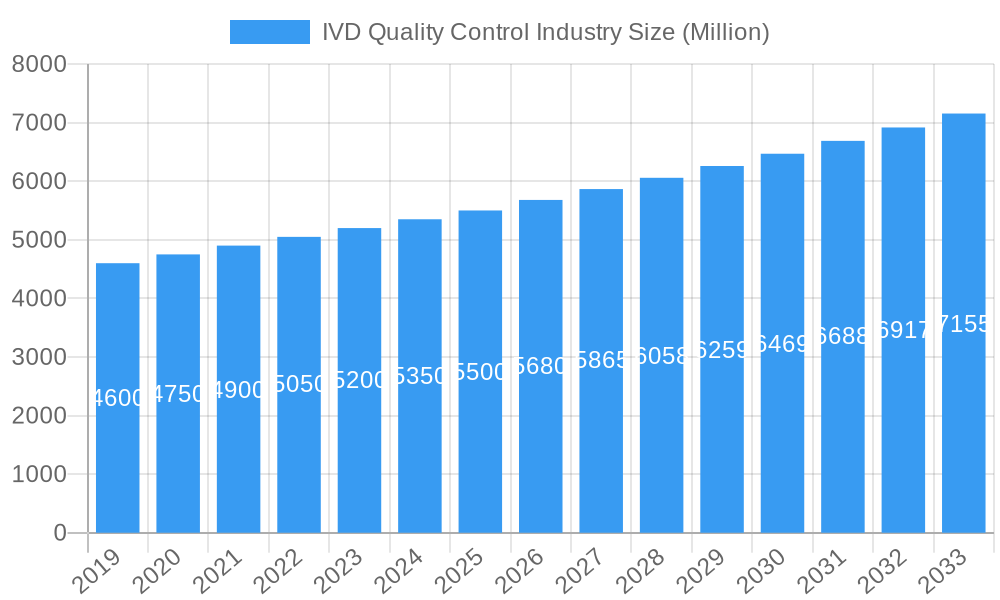
IVD Quality Control Industry Market Size (In Billion)
The IVD Quality Control sector encompasses Quality Control Products, Data Management Solutions, and Quality Assurance Services. Key application areas include Immunochemistry, Hematology, and Molecular Diagnostics, with the latter experiencing accelerated growth due to advancements in genetic testing and personalized medicine. Hospitals and Clinical Laboratories are the primary end-users, driven by high testing volumes. IVD Manufacturers and Contract Research Organizations (CROs) are also significant consumers. While North America and Europe currently lead, the Asia Pacific region is expected to exhibit the fastest growth due to its expanding healthcare sector and R&D investments. Potential challenges include the high cost of advanced quality control systems and a shortage of skilled professionals.
IVD Quality Control Industry Company Market Share
In-Depth IVD Quality Control Market Analysis: Forecasted Growth and Key Trends (Base Year: 2025)
This comprehensive report offers an in-depth analysis of the global In Vitro Diagnostics (IVD) Quality Control industry, essential for ensuring the accuracy, reliability, and regulatory compliance of diagnostic testing. Covering the period up to 2033, with a base year of 2025, this report examines market dynamics, emerging trends, key segments, product innovations, growth drivers, challenges, opportunities, leading players, and strategic outlooks. It is an indispensable resource for IVD manufacturers, clinical laboratories, CROs, regulatory bodies, and investors navigating this dynamic market.
IVD Quality Control Industry Market Dynamics & Concentration
The IVD Quality Control market is characterized by a moderate to high concentration, with a few dominant players holding significant market share. Key innovation drivers include the increasing demand for accurate and reliable diagnostic results, the growing burden of chronic diseases, and the continuous evolution of regulatory standards worldwide. Regulatory frameworks, such as those from the FDA and EMA, play a pivotal role in shaping market access and product development, often demanding stringent validation processes for IVD quality control solutions. Product substitutes exist, primarily in the form of manual validation processes or less sophisticated control materials, but advanced IVD quality control solutions offer superior accuracy and efficiency. End-user trends point towards a growing reliance on automation and data-driven insights within clinical laboratories, driving the adoption of advanced quality control systems. Mergers and acquisitions (M&A) activities have been a notable feature, with an estimated 50 significant M&A deals observed historically and projections indicating continued consolidation. Key companies like Abbott Laboratories, bioMerieux Inc., and F Hoffmann-La Roche AG are at the forefront, wielding substantial market influence. The market share of the top 5 players is estimated to be around 60%, highlighting the concentrated nature of this sector.
IVD Quality Control Industry Industry Trends & Analysis
The IVD Quality Control industry is experiencing robust growth, driven by an escalating global demand for precise diagnostic testing and an increasing prevalence of infectious diseases and chronic conditions. The Compound Annual Growth Rate (CAGR) is projected to be approximately 7.5% from 2025 to 2033. Technological disruptions are fundamentally reshaping the market, with a significant shift towards digital solutions for data management and real-time quality monitoring. The integration of artificial intelligence (AI) and machine learning (ML) into quality control platforms is enhancing predictive analytics and enabling proactive identification of potential testing errors. Consumer preferences are leaning towards more automated, user-friendly, and interconnected quality control systems that can seamlessly integrate with existing laboratory information systems (LIS). This shift is propelled by the need for increased laboratory efficiency and reduced operational costs. Competitive dynamics are intensifying, with companies focusing on developing comprehensive quality control portfolios that encompass both traditional control materials and sophisticated digital solutions. Market penetration for advanced IVD quality control solutions is projected to reach 70% by 2033, up from an estimated 45% in 2025. The increasing complexity of diagnostic assays, particularly in molecular diagnostics and personalized medicine, further necessitates robust quality control measures, acting as a significant market growth driver. Regulatory bodies are also continually updating guidelines to ensure higher standards of diagnostic accuracy, pushing manufacturers to invest in innovative quality control technologies. The global IVD quality control market size is estimated to be $7 billion in 2025, with strong growth anticipated in the coming years.
Leading Markets & Segments in IVD Quality Control Industry
The global IVD Quality Control market exhibits distinct leadership across various regions and segments.
- Dominant Region: North America currently leads the IVD Quality Control market, driven by a well-established healthcare infrastructure, high adoption rates of advanced diagnostic technologies, and significant R&D investments. The United States, in particular, represents a major market due to its large patient population and stringent regulatory requirements that necessitate robust quality control.
- Dominant Segment (Products and Services): Quality Control Products, including reagents, calibrators, and proficiency testing materials, represent the largest segment. This dominance is attributed to their foundational role in ensuring the accuracy of nearly all IVD assays.
- Key Drivers for Quality Control Products:
- Increasing volume of IVD testing across all applications.
- Development of complex assays requiring specialized control materials.
- Mandatory compliance with regulatory standards for all diagnostic tests.
- Key Drivers for Quality Control Products:
- Dominant Application: Molecular Diagnostics has emerged as a high-growth application segment.
- Key Drivers for Molecular Diagnostics:
- Rapid advancements in genetic testing and personalized medicine.
- Increased demand for infectious disease testing, particularly post-pandemic.
- Development of novel molecular diagnostic platforms requiring tailored quality control.
- Key Drivers for Molecular Diagnostics:
- Dominant End User: Hospitals and Clinical Laboratories constitute the largest end-user segment.
- Key Drivers for Hospitals & Clinical Laboratories:
- High volume of diagnostic testing performed daily.
- Direct impact of diagnostic accuracy on patient outcomes.
- Increasing investment in laboratory automation and advanced diagnostic equipment.
- Key Drivers for Hospitals & Clinical Laboratories:
- Data Management Solutions: This segment is experiencing rapid growth, fueled by the need for efficient data handling, regulatory compliance, and real-time quality monitoring.
- Quality Assurance Services: These services are gaining traction as laboratories seek external expertise to optimize their quality management systems.
- Immunochemistry & Hematology: These established applications continue to represent substantial market share due to their widespread use in routine diagnostics.
- Coagulation/Hemostasis: This segment is also significant, driven by the need for accurate monitoring of bleeding and clotting disorders.
- IVD Manufacturers & CROs: This end-user group is crucial, utilizing quality control not only for their internal processes but also for product development and validation. The global IVD Quality Control market size for these segments is projected to reach $12 billion by 2033.
IVD Quality Control Industry Product Developments
Product developments in the IVD Quality Control sector are primarily focused on enhancing accuracy, automation, and data integration. Innovations include the launch of advanced control materials with extended shelf-lives, multi-analyte controls for complex diagnostic panels, and digital quality control solutions that offer real-time monitoring and predictive analytics. Companies are emphasizing competitive advantages through AI-powered platforms that streamline workflows, reduce errors, and ensure compliance. The integration of these advanced products into existing diagnostic ecosystems is crucial for market adoption, catering to the evolving needs of laboratories seeking efficiency and precision in their testing processes.
Key Drivers of IVD Quality Control Industry Growth
Several factors are propelling the growth of the IVD Quality Control industry.
- Technological Advancements: The development of sophisticated diagnostic assays, particularly in molecular diagnostics and personalized medicine, necessitates highly accurate and reliable quality control solutions.
- Regulatory Mandates: Increasingly stringent regulatory requirements from bodies like the FDA and EMA are driving demand for robust quality control systems to ensure diagnostic accuracy and patient safety.
- Growing Disease Burden: The rising prevalence of chronic diseases and infectious diseases worldwide directly correlates with an increased volume of diagnostic testing, thereby boosting the need for quality control.
- Focus on Laboratory Efficiency: Laboratories are investing in automated and integrated quality control solutions to enhance operational efficiency, reduce costs, and minimize human error.
- Emergence of Point-of-Care (POC) Testing: The expansion of POC testing requires localized and accessible quality control measures, driving innovation in this sub-segment.
Challenges in the IVD Quality Control Industry Market
Despite robust growth, the IVD Quality Control industry faces several challenges.
- Regulatory Hurdles: Navigating the complex and evolving global regulatory landscape for IVD quality control products can be time-consuming and costly, impacting market entry and product launches.
- High Development Costs: Research and development for advanced quality control materials and digital platforms require significant investment, posing a barrier for smaller players.
- Interoperability Issues: Ensuring seamless integration of quality control solutions with diverse laboratory information systems and diagnostic instruments can be challenging.
- Supply Chain Disruptions: Geopolitical factors and global events can disrupt the supply of raw materials and finished goods, impacting product availability.
- Cost Pressures: Healthcare providers are constantly under pressure to reduce costs, which can translate into resistance to adopting premium-priced, albeit more advanced, quality control solutions.
Emerging Opportunities in IVD Quality Control Industry
The IVD Quality Control industry is ripe with emerging opportunities driven by technological breakthroughs and evolving market needs. The increasing demand for personalized medicine and companion diagnostics is creating a significant need for highly specialized and accurate quality control materials. The expansion of digital health and connected diagnostics platforms presents opportunities for integrated quality control solutions that offer real-time data analytics and remote monitoring capabilities. Strategic partnerships between IVD manufacturers and quality control providers are crucial for co-developing innovative solutions that meet specific assay requirements. Furthermore, the growing adoption of artificial intelligence (AI) and machine learning (ML) in diagnostics is opening avenues for predictive quality control, enabling proactive error detection and prevention. The expansion into emerging markets with growing healthcare infrastructures also offers substantial long-term growth potential.
Leading Players in the IVD Quality Control Industry Sector
- Quidel Corporation
- Qnostics Ltd
- Microbiologics Inc
- Bio-Rad Laboratories Inc
- ZeptoMetrix Corporation
- Abbott Laboratories
- bioMerieux Inc
- F Hoffmann-La Roche AG
- SeraCare Life Sciences Inc
- Thermo Fisher Scientific
Key Milestones in IVD Quality Control Industry Industry
- July 2022: BrightSight Inc. launched a digital Connected Diagnostics Platform at the 2022 AACC Annual Scientific Meeting and Clinical Lab Expo. This diagnostic platform is developed for in vitro diagnostics manufacturers that streamline workflows. It includes a Proxy Agent, Analytics Dashboards, Integration Middleware, and Workflow Portals.
- June 2022: EKF Diagnostics launched its new EKF Link digital connectivity solution for the secure management of point-of-care (POC) analyzers and associated data on one centralized platform.
Strategic Outlook for IVD Quality Control Industry Market
The strategic outlook for the IVD Quality Control industry is exceptionally promising, driven by continuous innovation and increasing demand for diagnostic accuracy. Growth accelerators include the expansion of digital quality control solutions, offering real-time monitoring and predictive analytics, and the development of specialized controls for emerging diagnostic areas like liquid biopsies and cell-free DNA testing. Strategic opportunities lie in fostering collaborations between IVD manufacturers, assay developers, and quality control providers to create integrated, end-to-end solutions. The growing emphasis on regulatory compliance and laboratory accreditation will continue to fuel the demand for robust quality assurance services. Furthermore, the increasing adoption of AI and machine learning in diagnostics presents a significant avenue for developing intelligent quality control systems that can proactively identify and mitigate potential testing errors, ensuring higher levels of diagnostic confidence and patient safety, with the market size projected to exceed $15 billion by 2033.
IVD Quality Control Industry Segmentation
-
1. Products and Services
- 1.1. Quality Control Products
- 1.2. Data Management Solutions
- 1.3. Quality Assurance Services
-
2. Application
- 2.1. Immunochemistry
- 2.2. Hematology
- 2.3. Molecular Diagnostics
- 2.4. Coagulation/Hemostasis
- 2.5. Other Applications
-
3. End Users
- 3.1. Hospitals
- 3.2. Clinical Laboratories
- 3.3. IVD Manufacturers & CROs
- 3.4. Other End Users
IVD Quality Control Industry Segmentation By Geography
-
1. North America
- 1.1. United States
- 1.2. Canada
- 1.3. Mexico
-
2. Europe
- 2.1. Germany
- 2.2. United Kingdom
- 2.3. France
- 2.4. Italy
- 2.5. Spain
- 2.6. Rest of Europe
-
3. Asia Pacific
- 3.1. China
- 3.2. Japan
- 3.3. India
- 3.4. Australia
- 3.5. South Korea
- 3.6. Rest of Asia Pacific
-
4. Middle East and Africa
- 4.1. GCC
- 4.2. South Africa
- 4.3. Rest of Middle East and Africa
-
5. South America
- 5.1. Brazil
- 5.2. Argentina
- 5.3. Rest of South America
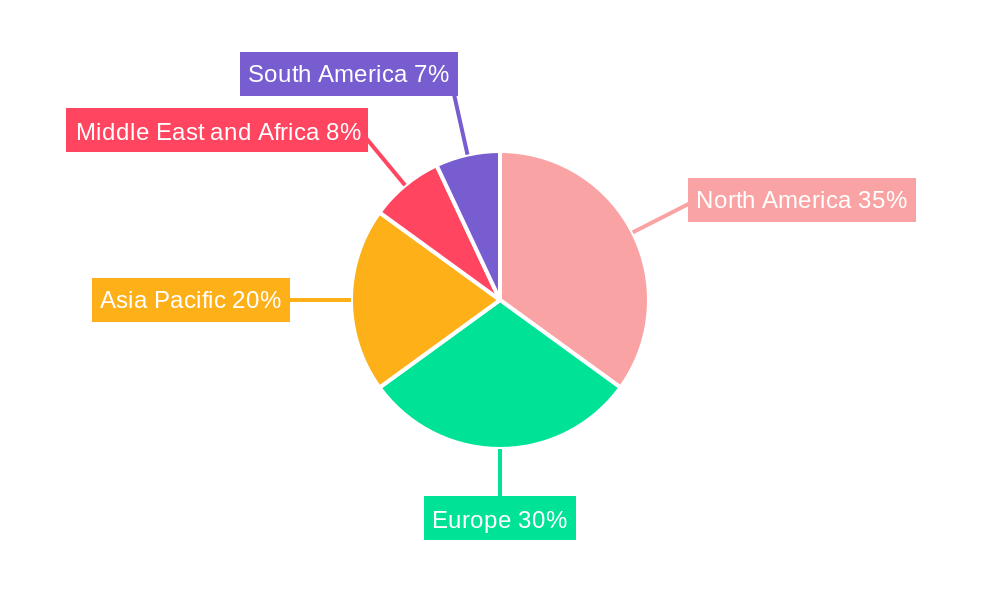
IVD Quality Control Industry Regional Market Share
Geographic Coverage of IVD Quality Control Industry
IVD Quality Control Industry REPORT HIGHLIGHTS
| Aspects | Details |
|---|---|
| Study Period | 2020-2034 |
| Base Year | 2025 |
| Estimated Year | 2026 |
| Forecast Period | 2026-2034 |
| Historical Period | 2020-2025 |
| Growth Rate | CAGR of 4.1% from 2020-2034 |
| Segmentation |
|
Table of Contents
- 1. Introduction
- 1.1. Research Scope
- 1.2. Market Segmentation
- 1.3. Research Methodology
- 1.4. Definitions and Assumptions
- 2. Executive Summary
- 2.1. Introduction
- 3. Market Dynamics
- 3.1. Introduction
- 3.2. Market Drivers
- 3.2.1 Increased Demand for Advanced Diagnostics for Sensitive Reports and Accurate Diagnosis; Rise in Global Incidence of Infectious Diseases
- 3.2.2 Cancers and Genetic Disorders; Rise in the Volume of Accredited Clinical Laboratories and Adoption of Third-Party Quality Controls
- 3.3. Market Restrains
- 3.3.1. Unfavorable Reimbursement Policies for IVD Industry; Lack of Stringent Regulations for Clinical Laboratory Accreditation in Several Emerging Economies
- 3.4. Market Trends
- 3.4.1. Molecular Diagnostics Segment is Expected to Register a Significant CAGR in the In-Vitro Diagnostics Quality Control Market Over the Forecast Period
- 4. Market Factor Analysis
- 4.1. Porters Five Forces
- 4.2. Supply/Value Chain
- 4.3. PESTEL analysis
- 4.4. Market Entropy
- 4.5. Patent/Trademark Analysis
- 5. Global IVD Quality Control Industry Analysis, Insights and Forecast, 2020-2032
- 5.1. Market Analysis, Insights and Forecast - by Products and Services
- 5.1.1. Quality Control Products
- 5.1.2. Data Management Solutions
- 5.1.3. Quality Assurance Services
- 5.2. Market Analysis, Insights and Forecast - by Application
- 5.2.1. Immunochemistry
- 5.2.2. Hematology
- 5.2.3. Molecular Diagnostics
- 5.2.4. Coagulation/Hemostasis
- 5.2.5. Other Applications
- 5.3. Market Analysis, Insights and Forecast - by End Users
- 5.3.1. Hospitals
- 5.3.2. Clinical Laboratories
- 5.3.3. IVD Manufacturers & CROs
- 5.3.4. Other End Users
- 5.4. Market Analysis, Insights and Forecast - by Region
- 5.4.1. North America
- 5.4.2. Europe
- 5.4.3. Asia Pacific
- 5.4.4. Middle East and Africa
- 5.4.5. South America
- 5.1. Market Analysis, Insights and Forecast - by Products and Services
- 6. North America IVD Quality Control Industry Analysis, Insights and Forecast, 2020-2032
- 6.1. Market Analysis, Insights and Forecast - by Products and Services
- 6.1.1. Quality Control Products
- 6.1.2. Data Management Solutions
- 6.1.3. Quality Assurance Services
- 6.2. Market Analysis, Insights and Forecast - by Application
- 6.2.1. Immunochemistry
- 6.2.2. Hematology
- 6.2.3. Molecular Diagnostics
- 6.2.4. Coagulation/Hemostasis
- 6.2.5. Other Applications
- 6.3. Market Analysis, Insights and Forecast - by End Users
- 6.3.1. Hospitals
- 6.3.2. Clinical Laboratories
- 6.3.3. IVD Manufacturers & CROs
- 6.3.4. Other End Users
- 6.1. Market Analysis, Insights and Forecast - by Products and Services
- 7. Europe IVD Quality Control Industry Analysis, Insights and Forecast, 2020-2032
- 7.1. Market Analysis, Insights and Forecast - by Products and Services
- 7.1.1. Quality Control Products
- 7.1.2. Data Management Solutions
- 7.1.3. Quality Assurance Services
- 7.2. Market Analysis, Insights and Forecast - by Application
- 7.2.1. Immunochemistry
- 7.2.2. Hematology
- 7.2.3. Molecular Diagnostics
- 7.2.4. Coagulation/Hemostasis
- 7.2.5. Other Applications
- 7.3. Market Analysis, Insights and Forecast - by End Users
- 7.3.1. Hospitals
- 7.3.2. Clinical Laboratories
- 7.3.3. IVD Manufacturers & CROs
- 7.3.4. Other End Users
- 7.1. Market Analysis, Insights and Forecast - by Products and Services
- 8. Asia Pacific IVD Quality Control Industry Analysis, Insights and Forecast, 2020-2032
- 8.1. Market Analysis, Insights and Forecast - by Products and Services
- 8.1.1. Quality Control Products
- 8.1.2. Data Management Solutions
- 8.1.3. Quality Assurance Services
- 8.2. Market Analysis, Insights and Forecast - by Application
- 8.2.1. Immunochemistry
- 8.2.2. Hematology
- 8.2.3. Molecular Diagnostics
- 8.2.4. Coagulation/Hemostasis
- 8.2.5. Other Applications
- 8.3. Market Analysis, Insights and Forecast - by End Users
- 8.3.1. Hospitals
- 8.3.2. Clinical Laboratories
- 8.3.3. IVD Manufacturers & CROs
- 8.3.4. Other End Users
- 8.1. Market Analysis, Insights and Forecast - by Products and Services
- 9. Middle East and Africa IVD Quality Control Industry Analysis, Insights and Forecast, 2020-2032
- 9.1. Market Analysis, Insights and Forecast - by Products and Services
- 9.1.1. Quality Control Products
- 9.1.2. Data Management Solutions
- 9.1.3. Quality Assurance Services
- 9.2. Market Analysis, Insights and Forecast - by Application
- 9.2.1. Immunochemistry
- 9.2.2. Hematology
- 9.2.3. Molecular Diagnostics
- 9.2.4. Coagulation/Hemostasis
- 9.2.5. Other Applications
- 9.3. Market Analysis, Insights and Forecast - by End Users
- 9.3.1. Hospitals
- 9.3.2. Clinical Laboratories
- 9.3.3. IVD Manufacturers & CROs
- 9.3.4. Other End Users
- 9.1. Market Analysis, Insights and Forecast - by Products and Services
- 10. South America IVD Quality Control Industry Analysis, Insights and Forecast, 2020-2032
- 10.1. Market Analysis, Insights and Forecast - by Products and Services
- 10.1.1. Quality Control Products
- 10.1.2. Data Management Solutions
- 10.1.3. Quality Assurance Services
- 10.2. Market Analysis, Insights and Forecast - by Application
- 10.2.1. Immunochemistry
- 10.2.2. Hematology
- 10.2.3. Molecular Diagnostics
- 10.2.4. Coagulation/Hemostasis
- 10.2.5. Other Applications
- 10.3. Market Analysis, Insights and Forecast - by End Users
- 10.3.1. Hospitals
- 10.3.2. Clinical Laboratories
- 10.3.3. IVD Manufacturers & CROs
- 10.3.4. Other End Users
- 10.1. Market Analysis, Insights and Forecast - by Products and Services
- 11. Competitive Analysis
- 11.1. Global Market Share Analysis 2025
- 11.2. Company Profiles
- 11.2.1 Quidel Corporation
- 11.2.1.1. Overview
- 11.2.1.2. Products
- 11.2.1.3. SWOT Analysis
- 11.2.1.4. Recent Developments
- 11.2.1.5. Financials (Based on Availability)
- 11.2.2 Qnostics Ltd
- 11.2.2.1. Overview
- 11.2.2.2. Products
- 11.2.2.3. SWOT Analysis
- 11.2.2.4. Recent Developments
- 11.2.2.5. Financials (Based on Availability)
- 11.2.3 Microbiologics Inc
- 11.2.3.1. Overview
- 11.2.3.2. Products
- 11.2.3.3. SWOT Analysis
- 11.2.3.4. Recent Developments
- 11.2.3.5. Financials (Based on Availability)
- 11.2.4 Bio-Rad Laboratories Inc
- 11.2.4.1. Overview
- 11.2.4.2. Products
- 11.2.4.3. SWOT Analysis
- 11.2.4.4. Recent Developments
- 11.2.4.5. Financials (Based on Availability)
- 11.2.5 ZeptoMetrix Corporation
- 11.2.5.1. Overview
- 11.2.5.2. Products
- 11.2.5.3. SWOT Analysis
- 11.2.5.4. Recent Developments
- 11.2.5.5. Financials (Based on Availability)
- 11.2.6 Abbott Laboratories
- 11.2.6.1. Overview
- 11.2.6.2. Products
- 11.2.6.3. SWOT Analysis
- 11.2.6.4. Recent Developments
- 11.2.6.5. Financials (Based on Availability)
- 11.2.7 bioMerieux Inc
- 11.2.7.1. Overview
- 11.2.7.2. Products
- 11.2.7.3. SWOT Analysis
- 11.2.7.4. Recent Developments
- 11.2.7.5. Financials (Based on Availability)
- 11.2.8 F Hoffmann-La Roche AG
- 11.2.8.1. Overview
- 11.2.8.2. Products
- 11.2.8.3. SWOT Analysis
- 11.2.8.4. Recent Developments
- 11.2.8.5. Financials (Based on Availability)
- 11.2.9 SeraCare Life Sciences Inc
- 11.2.9.1. Overview
- 11.2.9.2. Products
- 11.2.9.3. SWOT Analysis
- 11.2.9.4. Recent Developments
- 11.2.9.5. Financials (Based on Availability)
- 11.2.10 Thermo Fisher Scientific
- 11.2.10.1. Overview
- 11.2.10.2. Products
- 11.2.10.3. SWOT Analysis
- 11.2.10.4. Recent Developments
- 11.2.10.5. Financials (Based on Availability)
- 11.2.1 Quidel Corporation
List of Figures
- Figure 1: Global IVD Quality Control Industry Revenue Breakdown (billion, %) by Region 2025 & 2033
- Figure 2: Global IVD Quality Control Industry Volume Breakdown (K Unit, %) by Region 2025 & 2033
- Figure 3: North America IVD Quality Control Industry Revenue (billion), by Products and Services 2025 & 2033
- Figure 4: North America IVD Quality Control Industry Volume (K Unit), by Products and Services 2025 & 2033
- Figure 5: North America IVD Quality Control Industry Revenue Share (%), by Products and Services 2025 & 2033
- Figure 6: North America IVD Quality Control Industry Volume Share (%), by Products and Services 2025 & 2033
- Figure 7: North America IVD Quality Control Industry Revenue (billion), by Application 2025 & 2033
- Figure 8: North America IVD Quality Control Industry Volume (K Unit), by Application 2025 & 2033
- Figure 9: North America IVD Quality Control Industry Revenue Share (%), by Application 2025 & 2033
- Figure 10: North America IVD Quality Control Industry Volume Share (%), by Application 2025 & 2033
- Figure 11: North America IVD Quality Control Industry Revenue (billion), by End Users 2025 & 2033
- Figure 12: North America IVD Quality Control Industry Volume (K Unit), by End Users 2025 & 2033
- Figure 13: North America IVD Quality Control Industry Revenue Share (%), by End Users 2025 & 2033
- Figure 14: North America IVD Quality Control Industry Volume Share (%), by End Users 2025 & 2033
- Figure 15: North America IVD Quality Control Industry Revenue (billion), by Country 2025 & 2033
- Figure 16: North America IVD Quality Control Industry Volume (K Unit), by Country 2025 & 2033
- Figure 17: North America IVD Quality Control Industry Revenue Share (%), by Country 2025 & 2033
- Figure 18: North America IVD Quality Control Industry Volume Share (%), by Country 2025 & 2033
- Figure 19: Europe IVD Quality Control Industry Revenue (billion), by Products and Services 2025 & 2033
- Figure 20: Europe IVD Quality Control Industry Volume (K Unit), by Products and Services 2025 & 2033
- Figure 21: Europe IVD Quality Control Industry Revenue Share (%), by Products and Services 2025 & 2033
- Figure 22: Europe IVD Quality Control Industry Volume Share (%), by Products and Services 2025 & 2033
- Figure 23: Europe IVD Quality Control Industry Revenue (billion), by Application 2025 & 2033
- Figure 24: Europe IVD Quality Control Industry Volume (K Unit), by Application 2025 & 2033
- Figure 25: Europe IVD Quality Control Industry Revenue Share (%), by Application 2025 & 2033
- Figure 26: Europe IVD Quality Control Industry Volume Share (%), by Application 2025 & 2033
- Figure 27: Europe IVD Quality Control Industry Revenue (billion), by End Users 2025 & 2033
- Figure 28: Europe IVD Quality Control Industry Volume (K Unit), by End Users 2025 & 2033
- Figure 29: Europe IVD Quality Control Industry Revenue Share (%), by End Users 2025 & 2033
- Figure 30: Europe IVD Quality Control Industry Volume Share (%), by End Users 2025 & 2033
- Figure 31: Europe IVD Quality Control Industry Revenue (billion), by Country 2025 & 2033
- Figure 32: Europe IVD Quality Control Industry Volume (K Unit), by Country 2025 & 2033
- Figure 33: Europe IVD Quality Control Industry Revenue Share (%), by Country 2025 & 2033
- Figure 34: Europe IVD Quality Control Industry Volume Share (%), by Country 2025 & 2033
- Figure 35: Asia Pacific IVD Quality Control Industry Revenue (billion), by Products and Services 2025 & 2033
- Figure 36: Asia Pacific IVD Quality Control Industry Volume (K Unit), by Products and Services 2025 & 2033
- Figure 37: Asia Pacific IVD Quality Control Industry Revenue Share (%), by Products and Services 2025 & 2033
- Figure 38: Asia Pacific IVD Quality Control Industry Volume Share (%), by Products and Services 2025 & 2033
- Figure 39: Asia Pacific IVD Quality Control Industry Revenue (billion), by Application 2025 & 2033
- Figure 40: Asia Pacific IVD Quality Control Industry Volume (K Unit), by Application 2025 & 2033
- Figure 41: Asia Pacific IVD Quality Control Industry Revenue Share (%), by Application 2025 & 2033
- Figure 42: Asia Pacific IVD Quality Control Industry Volume Share (%), by Application 2025 & 2033
- Figure 43: Asia Pacific IVD Quality Control Industry Revenue (billion), by End Users 2025 & 2033
- Figure 44: Asia Pacific IVD Quality Control Industry Volume (K Unit), by End Users 2025 & 2033
- Figure 45: Asia Pacific IVD Quality Control Industry Revenue Share (%), by End Users 2025 & 2033
- Figure 46: Asia Pacific IVD Quality Control Industry Volume Share (%), by End Users 2025 & 2033
- Figure 47: Asia Pacific IVD Quality Control Industry Revenue (billion), by Country 2025 & 2033
- Figure 48: Asia Pacific IVD Quality Control Industry Volume (K Unit), by Country 2025 & 2033
- Figure 49: Asia Pacific IVD Quality Control Industry Revenue Share (%), by Country 2025 & 2033
- Figure 50: Asia Pacific IVD Quality Control Industry Volume Share (%), by Country 2025 & 2033
- Figure 51: Middle East and Africa IVD Quality Control Industry Revenue (billion), by Products and Services 2025 & 2033
- Figure 52: Middle East and Africa IVD Quality Control Industry Volume (K Unit), by Products and Services 2025 & 2033
- Figure 53: Middle East and Africa IVD Quality Control Industry Revenue Share (%), by Products and Services 2025 & 2033
- Figure 54: Middle East and Africa IVD Quality Control Industry Volume Share (%), by Products and Services 2025 & 2033
- Figure 55: Middle East and Africa IVD Quality Control Industry Revenue (billion), by Application 2025 & 2033
- Figure 56: Middle East and Africa IVD Quality Control Industry Volume (K Unit), by Application 2025 & 2033
- Figure 57: Middle East and Africa IVD Quality Control Industry Revenue Share (%), by Application 2025 & 2033
- Figure 58: Middle East and Africa IVD Quality Control Industry Volume Share (%), by Application 2025 & 2033
- Figure 59: Middle East and Africa IVD Quality Control Industry Revenue (billion), by End Users 2025 & 2033
- Figure 60: Middle East and Africa IVD Quality Control Industry Volume (K Unit), by End Users 2025 & 2033
- Figure 61: Middle East and Africa IVD Quality Control Industry Revenue Share (%), by End Users 2025 & 2033
- Figure 62: Middle East and Africa IVD Quality Control Industry Volume Share (%), by End Users 2025 & 2033
- Figure 63: Middle East and Africa IVD Quality Control Industry Revenue (billion), by Country 2025 & 2033
- Figure 64: Middle East and Africa IVD Quality Control Industry Volume (K Unit), by Country 2025 & 2033
- Figure 65: Middle East and Africa IVD Quality Control Industry Revenue Share (%), by Country 2025 & 2033
- Figure 66: Middle East and Africa IVD Quality Control Industry Volume Share (%), by Country 2025 & 2033
- Figure 67: South America IVD Quality Control Industry Revenue (billion), by Products and Services 2025 & 2033
- Figure 68: South America IVD Quality Control Industry Volume (K Unit), by Products and Services 2025 & 2033
- Figure 69: South America IVD Quality Control Industry Revenue Share (%), by Products and Services 2025 & 2033
- Figure 70: South America IVD Quality Control Industry Volume Share (%), by Products and Services 2025 & 2033
- Figure 71: South America IVD Quality Control Industry Revenue (billion), by Application 2025 & 2033
- Figure 72: South America IVD Quality Control Industry Volume (K Unit), by Application 2025 & 2033
- Figure 73: South America IVD Quality Control Industry Revenue Share (%), by Application 2025 & 2033
- Figure 74: South America IVD Quality Control Industry Volume Share (%), by Application 2025 & 2033
- Figure 75: South America IVD Quality Control Industry Revenue (billion), by End Users 2025 & 2033
- Figure 76: South America IVD Quality Control Industry Volume (K Unit), by End Users 2025 & 2033
- Figure 77: South America IVD Quality Control Industry Revenue Share (%), by End Users 2025 & 2033
- Figure 78: South America IVD Quality Control Industry Volume Share (%), by End Users 2025 & 2033
- Figure 79: South America IVD Quality Control Industry Revenue (billion), by Country 2025 & 2033
- Figure 80: South America IVD Quality Control Industry Volume (K Unit), by Country 2025 & 2033
- Figure 81: South America IVD Quality Control Industry Revenue Share (%), by Country 2025 & 2033
- Figure 82: South America IVD Quality Control Industry Volume Share (%), by Country 2025 & 2033
List of Tables
- Table 1: Global IVD Quality Control Industry Revenue billion Forecast, by Products and Services 2020 & 2033
- Table 2: Global IVD Quality Control Industry Volume K Unit Forecast, by Products and Services 2020 & 2033
- Table 3: Global IVD Quality Control Industry Revenue billion Forecast, by Application 2020 & 2033
- Table 4: Global IVD Quality Control Industry Volume K Unit Forecast, by Application 2020 & 2033
- Table 5: Global IVD Quality Control Industry Revenue billion Forecast, by End Users 2020 & 2033
- Table 6: Global IVD Quality Control Industry Volume K Unit Forecast, by End Users 2020 & 2033
- Table 7: Global IVD Quality Control Industry Revenue billion Forecast, by Region 2020 & 2033
- Table 8: Global IVD Quality Control Industry Volume K Unit Forecast, by Region 2020 & 2033
- Table 9: Global IVD Quality Control Industry Revenue billion Forecast, by Products and Services 2020 & 2033
- Table 10: Global IVD Quality Control Industry Volume K Unit Forecast, by Products and Services 2020 & 2033
- Table 11: Global IVD Quality Control Industry Revenue billion Forecast, by Application 2020 & 2033
- Table 12: Global IVD Quality Control Industry Volume K Unit Forecast, by Application 2020 & 2033
- Table 13: Global IVD Quality Control Industry Revenue billion Forecast, by End Users 2020 & 2033
- Table 14: Global IVD Quality Control Industry Volume K Unit Forecast, by End Users 2020 & 2033
- Table 15: Global IVD Quality Control Industry Revenue billion Forecast, by Country 2020 & 2033
- Table 16: Global IVD Quality Control Industry Volume K Unit Forecast, by Country 2020 & 2033
- Table 17: United States IVD Quality Control Industry Revenue (billion) Forecast, by Application 2020 & 2033
- Table 18: United States IVD Quality Control Industry Volume (K Unit) Forecast, by Application 2020 & 2033
- Table 19: Canada IVD Quality Control Industry Revenue (billion) Forecast, by Application 2020 & 2033
- Table 20: Canada IVD Quality Control Industry Volume (K Unit) Forecast, by Application 2020 & 2033
- Table 21: Mexico IVD Quality Control Industry Revenue (billion) Forecast, by Application 2020 & 2033
- Table 22: Mexico IVD Quality Control Industry Volume (K Unit) Forecast, by Application 2020 & 2033
- Table 23: Global IVD Quality Control Industry Revenue billion Forecast, by Products and Services 2020 & 2033
- Table 24: Global IVD Quality Control Industry Volume K Unit Forecast, by Products and Services 2020 & 2033
- Table 25: Global IVD Quality Control Industry Revenue billion Forecast, by Application 2020 & 2033
- Table 26: Global IVD Quality Control Industry Volume K Unit Forecast, by Application 2020 & 2033
- Table 27: Global IVD Quality Control Industry Revenue billion Forecast, by End Users 2020 & 2033
- Table 28: Global IVD Quality Control Industry Volume K Unit Forecast, by End Users 2020 & 2033
- Table 29: Global IVD Quality Control Industry Revenue billion Forecast, by Country 2020 & 2033
- Table 30: Global IVD Quality Control Industry Volume K Unit Forecast, by Country 2020 & 2033
- Table 31: Germany IVD Quality Control Industry Revenue (billion) Forecast, by Application 2020 & 2033
- Table 32: Germany IVD Quality Control Industry Volume (K Unit) Forecast, by Application 2020 & 2033
- Table 33: United Kingdom IVD Quality Control Industry Revenue (billion) Forecast, by Application 2020 & 2033
- Table 34: United Kingdom IVD Quality Control Industry Volume (K Unit) Forecast, by Application 2020 & 2033
- Table 35: France IVD Quality Control Industry Revenue (billion) Forecast, by Application 2020 & 2033
- Table 36: France IVD Quality Control Industry Volume (K Unit) Forecast, by Application 2020 & 2033
- Table 37: Italy IVD Quality Control Industry Revenue (billion) Forecast, by Application 2020 & 2033
- Table 38: Italy IVD Quality Control Industry Volume (K Unit) Forecast, by Application 2020 & 2033
- Table 39: Spain IVD Quality Control Industry Revenue (billion) Forecast, by Application 2020 & 2033
- Table 40: Spain IVD Quality Control Industry Volume (K Unit) Forecast, by Application 2020 & 2033
- Table 41: Rest of Europe IVD Quality Control Industry Revenue (billion) Forecast, by Application 2020 & 2033
- Table 42: Rest of Europe IVD Quality Control Industry Volume (K Unit) Forecast, by Application 2020 & 2033
- Table 43: Global IVD Quality Control Industry Revenue billion Forecast, by Products and Services 2020 & 2033
- Table 44: Global IVD Quality Control Industry Volume K Unit Forecast, by Products and Services 2020 & 2033
- Table 45: Global IVD Quality Control Industry Revenue billion Forecast, by Application 2020 & 2033
- Table 46: Global IVD Quality Control Industry Volume K Unit Forecast, by Application 2020 & 2033
- Table 47: Global IVD Quality Control Industry Revenue billion Forecast, by End Users 2020 & 2033
- Table 48: Global IVD Quality Control Industry Volume K Unit Forecast, by End Users 2020 & 2033
- Table 49: Global IVD Quality Control Industry Revenue billion Forecast, by Country 2020 & 2033
- Table 50: Global IVD Quality Control Industry Volume K Unit Forecast, by Country 2020 & 2033
- Table 51: China IVD Quality Control Industry Revenue (billion) Forecast, by Application 2020 & 2033
- Table 52: China IVD Quality Control Industry Volume (K Unit) Forecast, by Application 2020 & 2033
- Table 53: Japan IVD Quality Control Industry Revenue (billion) Forecast, by Application 2020 & 2033
- Table 54: Japan IVD Quality Control Industry Volume (K Unit) Forecast, by Application 2020 & 2033
- Table 55: India IVD Quality Control Industry Revenue (billion) Forecast, by Application 2020 & 2033
- Table 56: India IVD Quality Control Industry Volume (K Unit) Forecast, by Application 2020 & 2033
- Table 57: Australia IVD Quality Control Industry Revenue (billion) Forecast, by Application 2020 & 2033
- Table 58: Australia IVD Quality Control Industry Volume (K Unit) Forecast, by Application 2020 & 2033
- Table 59: South Korea IVD Quality Control Industry Revenue (billion) Forecast, by Application 2020 & 2033
- Table 60: South Korea IVD Quality Control Industry Volume (K Unit) Forecast, by Application 2020 & 2033
- Table 61: Rest of Asia Pacific IVD Quality Control Industry Revenue (billion) Forecast, by Application 2020 & 2033
- Table 62: Rest of Asia Pacific IVD Quality Control Industry Volume (K Unit) Forecast, by Application 2020 & 2033
- Table 63: Global IVD Quality Control Industry Revenue billion Forecast, by Products and Services 2020 & 2033
- Table 64: Global IVD Quality Control Industry Volume K Unit Forecast, by Products and Services 2020 & 2033
- Table 65: Global IVD Quality Control Industry Revenue billion Forecast, by Application 2020 & 2033
- Table 66: Global IVD Quality Control Industry Volume K Unit Forecast, by Application 2020 & 2033
- Table 67: Global IVD Quality Control Industry Revenue billion Forecast, by End Users 2020 & 2033
- Table 68: Global IVD Quality Control Industry Volume K Unit Forecast, by End Users 2020 & 2033
- Table 69: Global IVD Quality Control Industry Revenue billion Forecast, by Country 2020 & 2033
- Table 70: Global IVD Quality Control Industry Volume K Unit Forecast, by Country 2020 & 2033
- Table 71: GCC IVD Quality Control Industry Revenue (billion) Forecast, by Application 2020 & 2033
- Table 72: GCC IVD Quality Control Industry Volume (K Unit) Forecast, by Application 2020 & 2033
- Table 73: South Africa IVD Quality Control Industry Revenue (billion) Forecast, by Application 2020 & 2033
- Table 74: South Africa IVD Quality Control Industry Volume (K Unit) Forecast, by Application 2020 & 2033
- Table 75: Rest of Middle East and Africa IVD Quality Control Industry Revenue (billion) Forecast, by Application 2020 & 2033
- Table 76: Rest of Middle East and Africa IVD Quality Control Industry Volume (K Unit) Forecast, by Application 2020 & 2033
- Table 77: Global IVD Quality Control Industry Revenue billion Forecast, by Products and Services 2020 & 2033
- Table 78: Global IVD Quality Control Industry Volume K Unit Forecast, by Products and Services 2020 & 2033
- Table 79: Global IVD Quality Control Industry Revenue billion Forecast, by Application 2020 & 2033
- Table 80: Global IVD Quality Control Industry Volume K Unit Forecast, by Application 2020 & 2033
- Table 81: Global IVD Quality Control Industry Revenue billion Forecast, by End Users 2020 & 2033
- Table 82: Global IVD Quality Control Industry Volume K Unit Forecast, by End Users 2020 & 2033
- Table 83: Global IVD Quality Control Industry Revenue billion Forecast, by Country 2020 & 2033
- Table 84: Global IVD Quality Control Industry Volume K Unit Forecast, by Country 2020 & 2033
- Table 85: Brazil IVD Quality Control Industry Revenue (billion) Forecast, by Application 2020 & 2033
- Table 86: Brazil IVD Quality Control Industry Volume (K Unit) Forecast, by Application 2020 & 2033
- Table 87: Argentina IVD Quality Control Industry Revenue (billion) Forecast, by Application 2020 & 2033
- Table 88: Argentina IVD Quality Control Industry Volume (K Unit) Forecast, by Application 2020 & 2033
- Table 89: Rest of South America IVD Quality Control Industry Revenue (billion) Forecast, by Application 2020 & 2033
- Table 90: Rest of South America IVD Quality Control Industry Volume (K Unit) Forecast, by Application 2020 & 2033
Frequently Asked Questions
1. What is the projected Compound Annual Growth Rate (CAGR) of the IVD Quality Control Industry?
The projected CAGR is approximately 4.1%.
2. Which companies are prominent players in the IVD Quality Control Industry?
Key companies in the market include Quidel Corporation, Qnostics Ltd, Microbiologics Inc, Bio-Rad Laboratories Inc, ZeptoMetrix Corporation, Abbott Laboratories, bioMerieux Inc, F Hoffmann-La Roche AG, SeraCare Life Sciences Inc, Thermo Fisher Scientific.
3. What are the main segments of the IVD Quality Control Industry?
The market segments include Products and Services, Application, End Users.
4. Can you provide details about the market size?
The market size is estimated to be USD 1.21 billion as of 2022.
5. What are some drivers contributing to market growth?
Increased Demand for Advanced Diagnostics for Sensitive Reports and Accurate Diagnosis; Rise in Global Incidence of Infectious Diseases. Cancers and Genetic Disorders; Rise in the Volume of Accredited Clinical Laboratories and Adoption of Third-Party Quality Controls.
6. What are the notable trends driving market growth?
Molecular Diagnostics Segment is Expected to Register a Significant CAGR in the In-Vitro Diagnostics Quality Control Market Over the Forecast Period.
7. Are there any restraints impacting market growth?
Unfavorable Reimbursement Policies for IVD Industry; Lack of Stringent Regulations for Clinical Laboratory Accreditation in Several Emerging Economies.
8. Can you provide examples of recent developments in the market?
In July 2022, BrightSight Inc. launched a digital Connected Diagnostics Platform at the 2022 AACC Annual Scientific Meeting and Clinical Lab Expo. This diagnostic platform is developed for in vitro diagnostics manufacturers that streamline workflows. It includes a Proxy Agent, Analytics Dashboards, Integration Middleware, and Workflow Portals.
9. What pricing options are available for accessing the report?
Pricing options include single-user, multi-user, and enterprise licenses priced at USD 4750, USD 5250, and USD 8750 respectively.
10. Is the market size provided in terms of value or volume?
The market size is provided in terms of value, measured in billion and volume, measured in K Unit.
11. Are there any specific market keywords associated with the report?
Yes, the market keyword associated with the report is "IVD Quality Control Industry," which aids in identifying and referencing the specific market segment covered.
12. How do I determine which pricing option suits my needs best?
The pricing options vary based on user requirements and access needs. Individual users may opt for single-user licenses, while businesses requiring broader access may choose multi-user or enterprise licenses for cost-effective access to the report.
13. Are there any additional resources or data provided in the IVD Quality Control Industry report?
While the report offers comprehensive insights, it's advisable to review the specific contents or supplementary materials provided to ascertain if additional resources or data are available.
14. How can I stay updated on further developments or reports in the IVD Quality Control Industry?
To stay informed about further developments, trends, and reports in the IVD Quality Control Industry, consider subscribing to industry newsletters, following relevant companies and organizations, or regularly checking reputable industry news sources and publications.
Methodology
Step 1 - Identification of Relevant Samples Size from Population Database


Step 2 - Approaches for Defining Global Market Size (Value, Volume* & Price*)

Note*: In applicable scenarios
Step 3 - Data Sources
Primary Research
- Web Analytics
- Survey Reports
- Research Institute
- Latest Research Reports
- Opinion Leaders
Secondary Research
- Annual Reports
- White Paper
- Latest Press Release
- Industry Association
- Paid Database
- Investor Presentations

Step 4 - Data Triangulation
Involves using different sources of information in order to increase the validity of a study
These sources are likely to be stakeholders in a program - participants, other researchers, program staff, other community members, and so on.
Then we put all data in single framework & apply various statistical tools to find out the dynamic on the market.
During the analysis stage, feedback from the stakeholder groups would be compared to determine areas of agreement as well as areas of divergence