

Key Insights
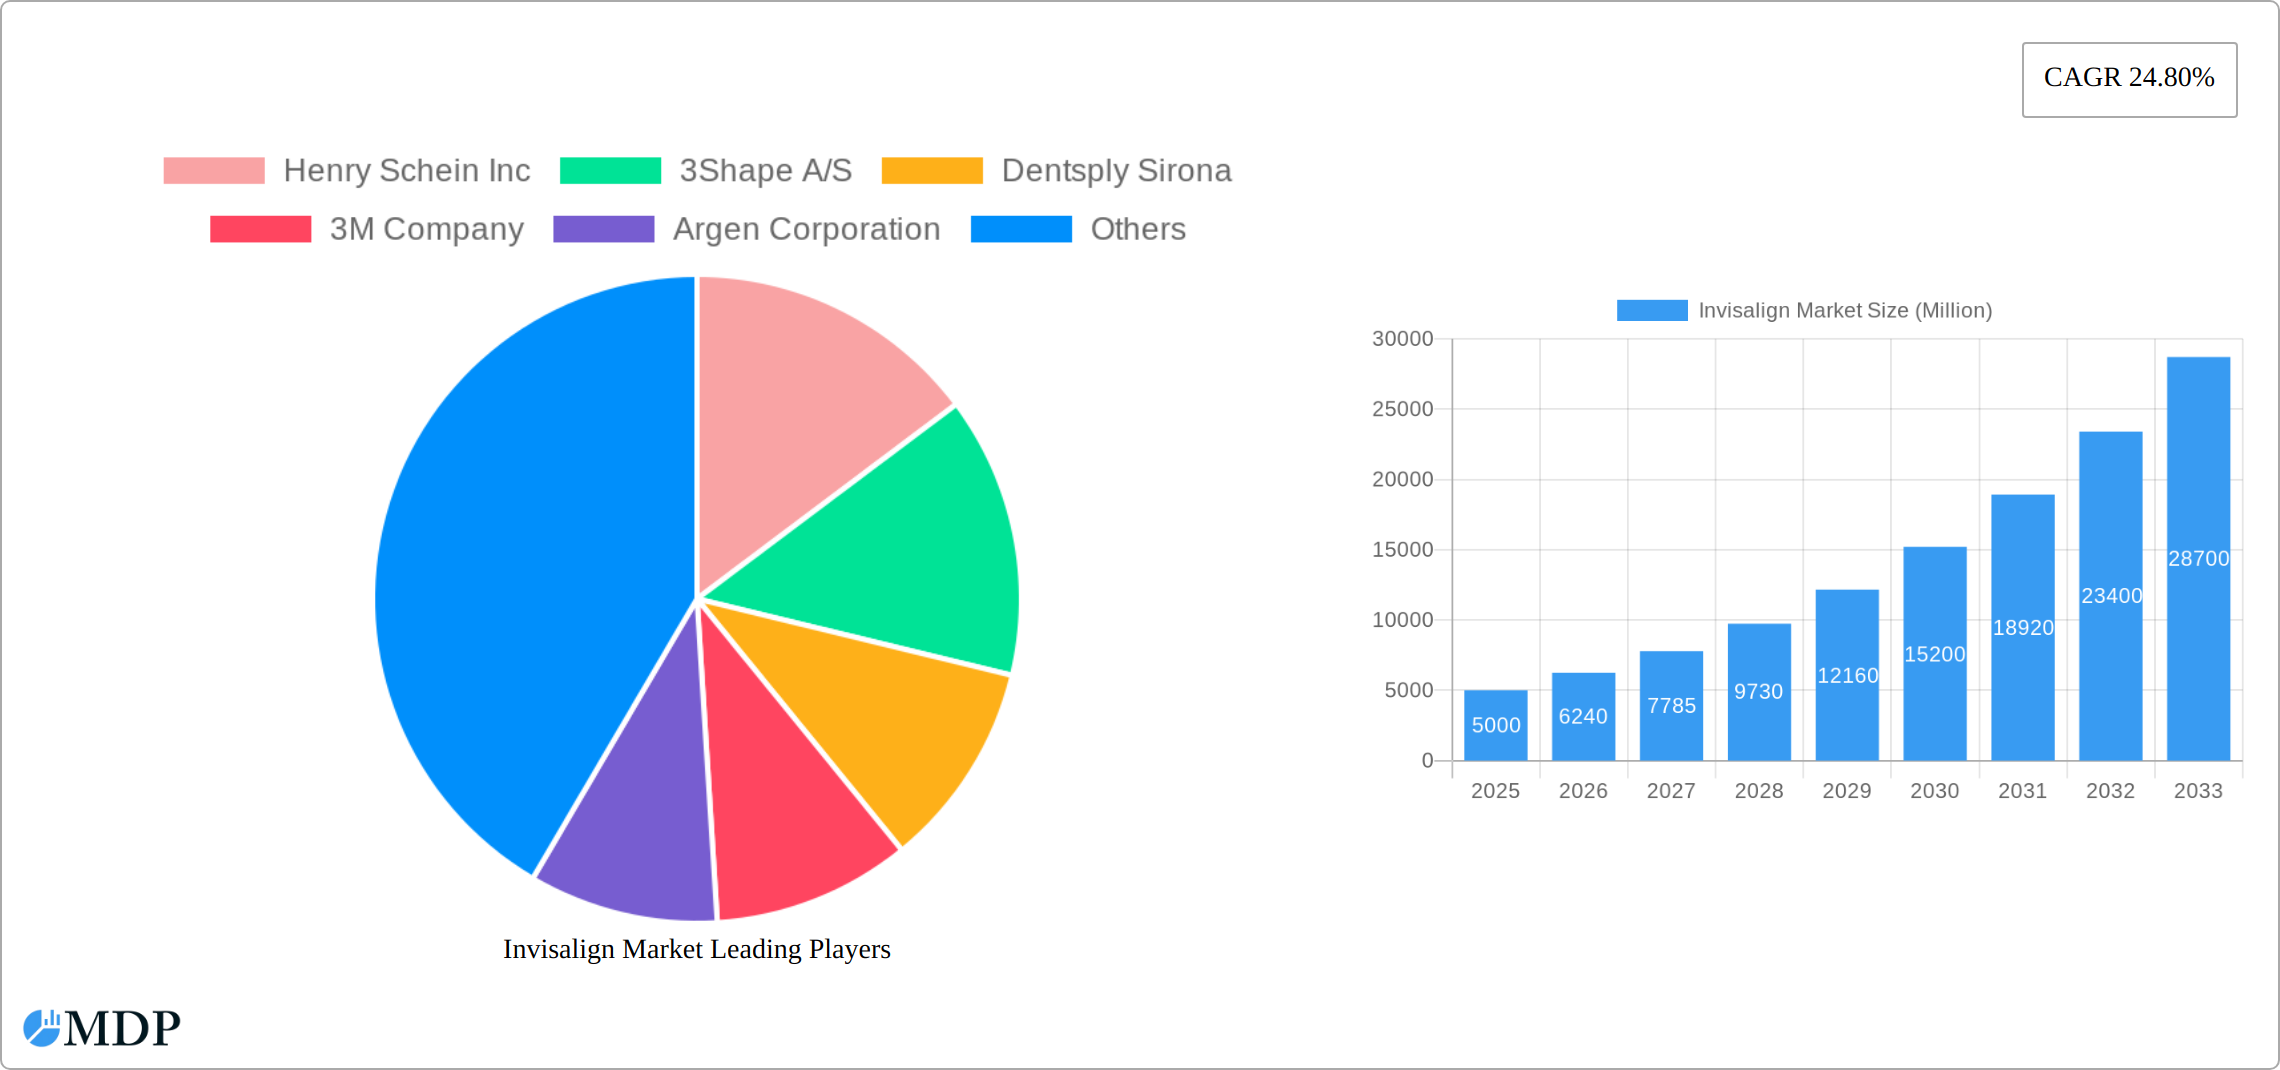
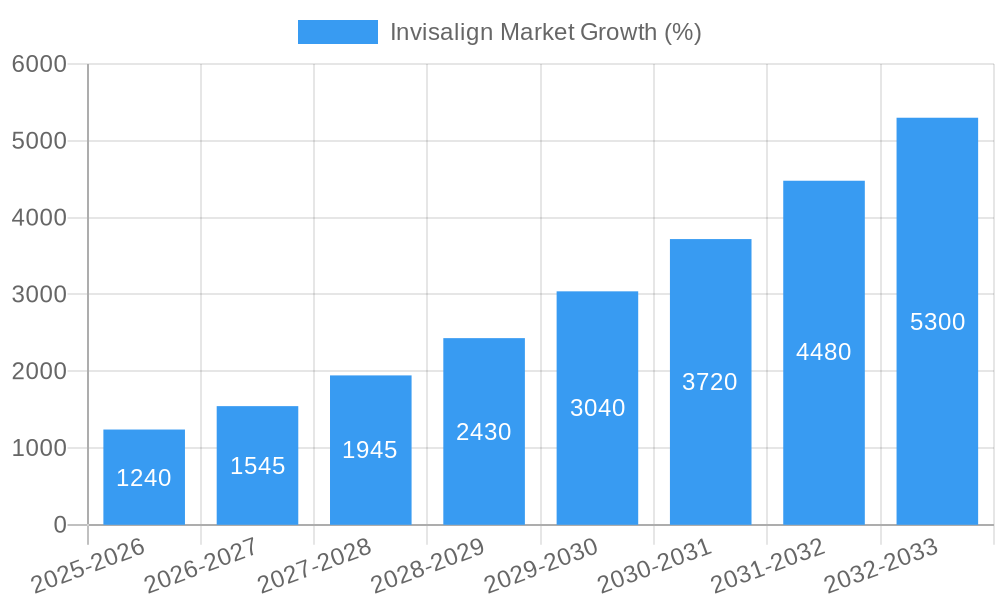
The Invisalign market, valued at approximately $5 billion in 2025, is experiencing robust growth, projected to reach over $15 billion by 2033, driven by a 24.80% CAGR. This expansion is fueled by several key factors. Firstly, increasing consumer awareness and demand for aesthetically pleasing orthodontic solutions are significantly boosting market adoption. The preference for clear aligners over traditional metal braces, owing to their discreet nature and enhanced comfort, is a major contributor. Secondly, technological advancements in aligner design and manufacturing processes are leading to improved treatment efficacy and reduced treatment times, further enhancing market appeal. The rise of teledentistry and remote monitoring options also contributes to market expansion, making treatment more accessible and convenient. Finally, the expanding adult demographic seeking orthodontic correction is a significant driver, as many adults now view straight teeth as essential for both aesthetic and functional reasons. The market segmentation reveals a substantial contribution from both the adult and teen age groups, with the adult segment exhibiting particularly strong growth potential. Hospitals and dental/orthodontic clinics remain the dominant end-users, though the increasing penetration of direct-to-consumer models is expected to influence the distribution landscape in the coming years.
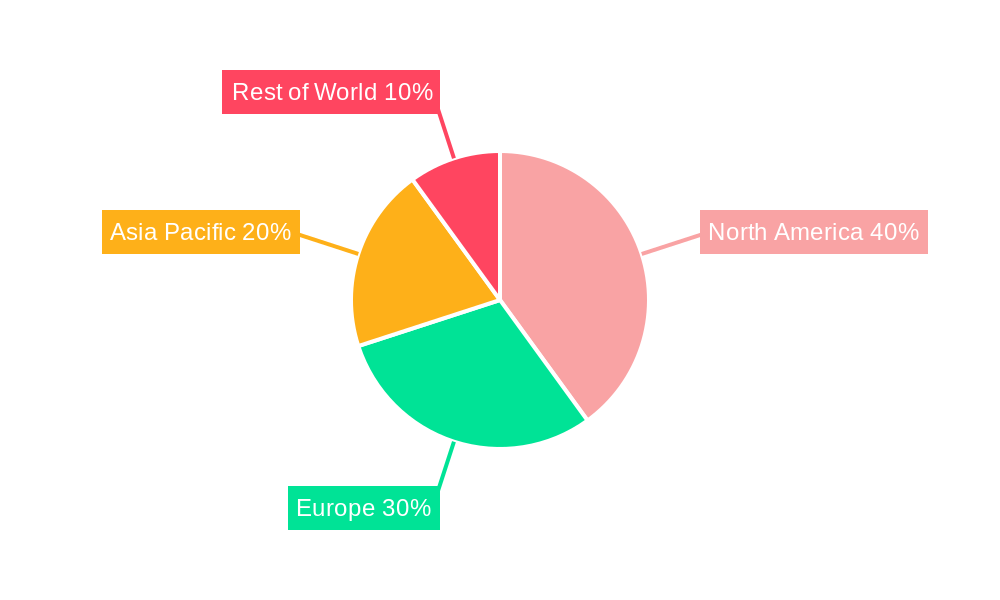
Geographic distribution reveals strong market concentration in North America and Europe, with the Asia-Pacific region showing significant growth potential driven by rising disposable incomes and increasing awareness of orthodontic treatments. While high initial costs and potential treatment limitations compared to traditional methods represent some constraints, these are mitigated by the ongoing innovation and improvements within the Invisalign technology, as well as the development of more affordable treatment options to broaden access. The competitive landscape is dominated by established players like Align Technology, 3M, and Dentsply Sirona, yet the market also presents opportunities for emerging companies offering innovative solutions or focusing on niche segments. Continued innovation in materials science, treatment planning software, and patient engagement technologies will be crucial for maintaining the market's dynamic growth trajectory over the forecast period.
Invisalign Market: A Comprehensive Report (2019-2033)
This comprehensive report provides an in-depth analysis of the Invisalign market, offering invaluable insights for industry stakeholders, investors, and strategic decision-makers. Covering the period from 2019 to 2033, with a base year of 2025 and a forecast period of 2025-2033, this report unveils the market dynamics, key trends, leading players, and future growth opportunities within the global Invisalign sector. The report analyzes the market valued at xx Million in 2024, projecting a substantial increase to xx Million by 2033, exhibiting a robust CAGR of xx% during the forecast period.
Invisalign Market Dynamics & Concentration
The Invisalign market is characterized by a moderate level of concentration, with several key players holding significant market share. Align Technology Inc. currently dominates the market, commanding an estimated xx% market share in 2024, followed by Dentsply Sirona with approximately xx%, and 3M Company holding around xx%. However, the market is witnessing increased competition from emerging players. Innovation is a key driver, with companies continuously striving to improve aligner technology, materials, and treatment processes. Regulatory frameworks, particularly those related to medical device approvals and safety standards, play a significant role in shaping market dynamics. Clear aligners face competition from traditional orthodontic methods like braces, although the demand for clear aligner systems is consistently rising due to their aesthetic appeal and improved comfort. The market has witnessed notable M&A activity in recent years, with xx mergers and acquisitions recorded between 2019 and 2024, largely driven by efforts to expand product portfolios and market reach.
- Market Concentration: Highly concentrated, with Align Technology Inc. holding a significant market share.
- Innovation Drivers: Continuous advancements in aligner materials, software, and treatment planning.
- Regulatory Frameworks: Stringent regulations governing medical devices impact market entry and product development.
- Product Substitutes: Traditional metal braces remain a significant competitor.
- End-User Trends: Increasing preference for aesthetically pleasing and comfortable orthodontic treatments.
- M&A Activity: Significant M&A activity observed in the recent past, indicating consolidation and expansion strategies.
Invisalign Market Industry Trends & Analysis
The Invisalign market is experiencing robust growth, propelled by several key factors. Increasing awareness of cosmetic dentistry and a rising demand for aesthetically pleasing orthodontic solutions are major drivers. Technological advancements, such as AI-powered treatment planning software and improved aligner materials, are enhancing treatment efficacy and patient experience. Consumer preferences are shifting towards minimally invasive, comfortable, and removable orthodontic appliances. The competitive landscape is dynamic, with established players focused on innovation and expansion, while new entrants bring fresh perspectives and technologies. The market's growth is further fueled by increasing disposable incomes in developing economies, which are expanding access to premium dental care. The market penetration rate of clear aligners is steadily increasing, currently estimated at approximately xx% in 2024, projected to reach xx% by 2033. This growth trajectory is expected to continue, driven by the aforementioned factors.
Leading Markets & Segments in Invisalign Market
The global Invisalign market is experiencing robust growth, with North America currently holding the largest market share, accounting for approximately [Insert Updated Percentage]% of the total revenue in 2024. This dominance is fueled by several key factors:
- High Disposable Incomes and Increased Healthcare Spending: North America's robust economy and high disposable incomes translate to greater access to advanced dental care, including premium orthodontic solutions like Invisalign.
- Advanced Dental Infrastructure and Skilled Professionals: A well-established network of dental clinics and highly skilled orthodontists provides a supportive ecosystem for Invisalign adoption and successful treatment outcomes.
- Strong Awareness and Demand for Cosmetic Dentistry: The growing emphasis on aesthetic appeal and improved oral health fuels consumer demand for discreet and effective orthodontic solutions such as Invisalign.
- Favorable Regulatory Landscape: Supportive regulatory frameworks facilitate the market penetration and widespread availability of Invisalign technology.
While the adult segment currently holds a larger market share (approximately [Insert Updated Percentage]% in 2024) due to higher disposable income and increased awareness of cosmetic dentistry, the teen segment is also demonstrating significant growth potential. Dental and Orthodontic Clinics remain the primary end-users, accounting for [Insert Updated Percentage]% of the market in 2024, followed by Hospitals at [Insert Updated Percentage]%. The expanding role of direct-to-consumer telehealth platforms is also worth noting, as it presents new avenues for market access.
Invisalign Market Product Developments
Recent product developments focus on enhancing aligner comfort, durability, and treatment speed. Companies are investing in advanced materials, such as biocompatible polymers, and incorporating smart technologies to personalize treatment plans and monitor patient progress. This emphasis on personalization and improved outcomes is driving market growth and attracting new patients. The development of innovative software solutions for treatment planning and monitoring further enhances the efficiency and accuracy of Invisalign treatments.
Key Drivers of Invisalign Market Growth
The continued expansion of the Invisalign market is driven by a confluence of factors:
- Technological Advancements: Continuous innovation in aligner materials, software, and treatment planning leads to faster, more comfortable, and effective treatments, enhancing patient satisfaction.
- Rising Disposable Incomes and Expanding Middle Class Globally: Increasing affluence in various regions is expanding the market for premium healthcare options, including Invisalign.
- Increased Awareness of Cosmetic Dentistry and Orthodontic Treatments: Growing consumer awareness of the aesthetic and health benefits of straight teeth is driving demand for discreet orthodontic solutions.
- Favorable Regulatory Environment and Expanding Reimbursement Coverage: Supportive regulations and potential expansions of insurance coverage are increasing market accessibility.
- Strategic Partnerships and Collaborations: Strategic alliances between Invisalign providers, dental clinics, and technology companies are streamlining the delivery of Invisalign services and enhancing market penetration.
Challenges in the Invisalign Market Market
The Invisalign market faces several challenges:
- High treatment costs: Limiting access for patients with limited financial resources.
- Competition from traditional braces: Maintaining market share against established orthodontic treatment methods.
- Supply chain disruptions: Potentially affecting the availability of aligners and related materials.
Emerging Opportunities in Invisalign Market
The Invisalign market presents several opportunities for future growth:
- Expansion into emerging markets: Reaching new customer segments in developing economies.
- Strategic partnerships: Collaborations with dental professionals to expand market reach.
- Technological breakthroughs: Development of AI-powered treatment planning and monitoring systems.
Leading Players in the Invisalign Market Sector
- Henry Schein Inc
- 3Shape A/S
- Dentsply Sirona
- 3M Company
- Argen Corporation
- Angelalign Technology
- Align Technology Inc
- TP Orthodontics Inc
- Patterson Companies Inc
- Institut Straumann AG
Key Milestones in Invisalign Market Industry
- February 2022: Bausch Health Companies Inc. launched its OraFit custom clear aligner system in the US market, introducing a new competitor with a three-layer design.
- August 2022: Orthobrain launched SimplyClear, a comprehensive orthodontic solution combining high-quality clear aligners with a support model, potentially disrupting the market with its integrated approach.
Strategic Outlook for Invisalign Market Market
The Invisalign market is poised for continued growth driven by technological innovation, expansion into new markets, and increasing consumer demand for aesthetic orthodontic solutions. Strategic partnerships and collaborations will play a crucial role in shaping the market's future. Companies focusing on personalization, technological advancements, and efficient supply chains will be best positioned to capture significant market share in the years to come.
Invisalign Market Segmentation
-
1. Age
- 1.1. Adult
- 1.2. Teens
-
2. End User
- 2.1. Hospitals
- 2.2. Dental and Orthodontic Clinics
Invisalign Market Segmentation By Geography
-
1. North America
- 1.1. United States
- 1.2. Canada
- 1.3. Mexico
-
2. Europe
- 2.1. Germany
- 2.2. United Kingdom
- 2.3. France
- 2.4. Italy
- 2.5. Spain
- 2.6. Rest of Europe
-
3. Asia Pacific
- 3.1. China
- 3.2. Japan
- 3.3. India
- 3.4. Australia
- 3.5. South Korea
- 3.6. Rest of Asia Pacific
-
4. Middle East and Africa
- 4.1. GCC
- 4.2. South Africa
- 4.3. Rest of Middle East and Africa
-
5. South America
- 5.1. Brazil
- 5.2. Argentina
- 5.3. Rest of South America
Invisalign Market REPORT HIGHLIGHTS
| Aspects | Details |
|---|---|
| Study Period | 2019-2033 |
| Base Year | 2024 |
| Estimated Year | 2025 |
| Forecast Period | 2025-2033 |
| Historical Period | 2019-2024 |
| Growth Rate | CAGR of 24.80% from 2019-2033 |
| Segmentation |
|
Table of Contents
- 1. Introduction
- 1.1. Research Scope
- 1.2. Market Segmentation
- 1.3. Research Methodology
- 1.4. Definitions and Assumptions
- 2. Executive Summary
- 2.1. Introduction
- 3. Market Dynamics
- 3.1. Introduction
- 3.2. Market Drivers
- 3.2.1 Increasing Dental Problems like Malocclusions
- 3.2.2 Crowding
- 3.2.3 etc.; Rising Digital Technologies in Dentistry
- 3.3. Market Restrains
- 3.3.1. Huge Cost of Clear Aligners
- 3.4. Market Trends
- 3.4.1. Adult Segment is Expected to Have the Significant Market Share
- 4. Market Factor Analysis
- 4.1. Porters Five Forces
- 4.2. Supply/Value Chain
- 4.3. PESTEL analysis
- 4.4. Market Entropy
- 4.5. Patent/Trademark Analysis
- 5. Global Invisalign Market Analysis, Insights and Forecast, 2019-2031
- 5.1. Market Analysis, Insights and Forecast - by Age
- 5.1.1. Adult
- 5.1.2. Teens
- 5.2. Market Analysis, Insights and Forecast - by End User
- 5.2.1. Hospitals
- 5.2.2. Dental and Orthodontic Clinics
- 5.3. Market Analysis, Insights and Forecast - by Region
- 5.3.1. North America
- 5.3.2. Europe
- 5.3.3. Asia Pacific
- 5.3.4. Middle East and Africa
- 5.3.5. South America
- 5.1. Market Analysis, Insights and Forecast - by Age
- 6. North America Invisalign Market Analysis, Insights and Forecast, 2019-2031
- 6.1. Market Analysis, Insights and Forecast - by Age
- 6.1.1. Adult
- 6.1.2. Teens
- 6.2. Market Analysis, Insights and Forecast - by End User
- 6.2.1. Hospitals
- 6.2.2. Dental and Orthodontic Clinics
- 6.1. Market Analysis, Insights and Forecast - by Age
- 7. Europe Invisalign Market Analysis, Insights and Forecast, 2019-2031
- 7.1. Market Analysis, Insights and Forecast - by Age
- 7.1.1. Adult
- 7.1.2. Teens
- 7.2. Market Analysis, Insights and Forecast - by End User
- 7.2.1. Hospitals
- 7.2.2. Dental and Orthodontic Clinics
- 7.1. Market Analysis, Insights and Forecast - by Age
- 8. Asia Pacific Invisalign Market Analysis, Insights and Forecast, 2019-2031
- 8.1. Market Analysis, Insights and Forecast - by Age
- 8.1.1. Adult
- 8.1.2. Teens
- 8.2. Market Analysis, Insights and Forecast - by End User
- 8.2.1. Hospitals
- 8.2.2. Dental and Orthodontic Clinics
- 8.1. Market Analysis, Insights and Forecast - by Age
- 9. Middle East and Africa Invisalign Market Analysis, Insights and Forecast, 2019-2031
- 9.1. Market Analysis, Insights and Forecast - by Age
- 9.1.1. Adult
- 9.1.2. Teens
- 9.2. Market Analysis, Insights and Forecast - by End User
- 9.2.1. Hospitals
- 9.2.2. Dental and Orthodontic Clinics
- 9.1. Market Analysis, Insights and Forecast - by Age
- 10. South America Invisalign Market Analysis, Insights and Forecast, 2019-2031
- 10.1. Market Analysis, Insights and Forecast - by Age
- 10.1.1. Adult
- 10.1.2. Teens
- 10.2. Market Analysis, Insights and Forecast - by End User
- 10.2.1. Hospitals
- 10.2.2. Dental and Orthodontic Clinics
- 10.1. Market Analysis, Insights and Forecast - by Age
- 11. North America Invisalign Market Analysis, Insights and Forecast, 2019-2031
- 11.1. Market Analysis, Insights and Forecast - By Country/Sub-region
- 11.1.1 United States
- 11.1.2 Canada
- 11.1.3 Mexico
- 12. Europe Invisalign Market Analysis, Insights and Forecast, 2019-2031
- 12.1. Market Analysis, Insights and Forecast - By Country/Sub-region
- 12.1.1 Germany
- 12.1.2 United Kingdom
- 12.1.3 France
- 12.1.4 Italy
- 12.1.5 Spain
- 12.1.6 Rest of Europe
- 13. Asia Pacific Invisalign Market Analysis, Insights and Forecast, 2019-2031
- 13.1. Market Analysis, Insights and Forecast - By Country/Sub-region
- 13.1.1 China
- 13.1.2 Japan
- 13.1.3 India
- 13.1.4 Australia
- 13.1.5 South Korea
- 13.1.6 Rest of Asia Pacific
- 14. Middle East and Africa Invisalign Market Analysis, Insights and Forecast, 2019-2031
- 14.1. Market Analysis, Insights and Forecast - By Country/Sub-region
- 14.1.1 GCC
- 14.1.2 South Africa
- 14.1.3 Rest of Middle East and Africa
- 15. South America Invisalign Market Analysis, Insights and Forecast, 2019-2031
- 15.1. Market Analysis, Insights and Forecast - By Country/Sub-region
- 15.1.1 Brazil
- 15.1.2 Argentina
- 15.1.3 Rest of South America
- 16. Competitive Analysis
- 16.1. Global Market Share Analysis 2024
- 16.2. Company Profiles
- 16.2.1 Henry Schein Inc
- 16.2.1.1. Overview
- 16.2.1.2. Products
- 16.2.1.3. SWOT Analysis
- 16.2.1.4. Recent Developments
- 16.2.1.5. Financials (Based on Availability)
- 16.2.2 3Shape A/S
- 16.2.2.1. Overview
- 16.2.2.2. Products
- 16.2.2.3. SWOT Analysis
- 16.2.2.4. Recent Developments
- 16.2.2.5. Financials (Based on Availability)
- 16.2.3 Dentsply Sirona
- 16.2.3.1. Overview
- 16.2.3.2. Products
- 16.2.3.3. SWOT Analysis
- 16.2.3.4. Recent Developments
- 16.2.3.5. Financials (Based on Availability)
- 16.2.4 3M Company
- 16.2.4.1. Overview
- 16.2.4.2. Products
- 16.2.4.3. SWOT Analysis
- 16.2.4.4. Recent Developments
- 16.2.4.5. Financials (Based on Availability)
- 16.2.5 Argen Corporation
- 16.2.5.1. Overview
- 16.2.5.2. Products
- 16.2.5.3. SWOT Analysis
- 16.2.5.4. Recent Developments
- 16.2.5.5. Financials (Based on Availability)
- 16.2.6 Angelalign Technology
- 16.2.6.1. Overview
- 16.2.6.2. Products
- 16.2.6.3. SWOT Analysis
- 16.2.6.4. Recent Developments
- 16.2.6.5. Financials (Based on Availability)
- 16.2.7 Align Technology Inc
- 16.2.7.1. Overview
- 16.2.7.2. Products
- 16.2.7.3. SWOT Analysis
- 16.2.7.4. Recent Developments
- 16.2.7.5. Financials (Based on Availability)
- 16.2.8 TP Orthodontics Inc
- 16.2.8.1. Overview
- 16.2.8.2. Products
- 16.2.8.3. SWOT Analysis
- 16.2.8.4. Recent Developments
- 16.2.8.5. Financials (Based on Availability)
- 16.2.9 Patterson Companies Inc
- 16.2.9.1. Overview
- 16.2.9.2. Products
- 16.2.9.3. SWOT Analysis
- 16.2.9.4. Recent Developments
- 16.2.9.5. Financials (Based on Availability)
- 16.2.10 Institut Straumann AG
- 16.2.10.1. Overview
- 16.2.10.2. Products
- 16.2.10.3. SWOT Analysis
- 16.2.10.4. Recent Developments
- 16.2.10.5. Financials (Based on Availability)
- 16.2.1 Henry Schein Inc
List of Figures
- Figure 1: Global Invisalign Market Revenue Breakdown (Million, %) by Region 2024 & 2032
- Figure 2: Global Invisalign Market Volume Breakdown (K Unit, %) by Region 2024 & 2032
- Figure 3: North America Invisalign Market Revenue (Million), by Country 2024 & 2032
- Figure 4: North America Invisalign Market Volume (K Unit), by Country 2024 & 2032
- Figure 5: North America Invisalign Market Revenue Share (%), by Country 2024 & 2032
- Figure 6: North America Invisalign Market Volume Share (%), by Country 2024 & 2032
- Figure 7: Europe Invisalign Market Revenue (Million), by Country 2024 & 2032
- Figure 8: Europe Invisalign Market Volume (K Unit), by Country 2024 & 2032
- Figure 9: Europe Invisalign Market Revenue Share (%), by Country 2024 & 2032
- Figure 10: Europe Invisalign Market Volume Share (%), by Country 2024 & 2032
- Figure 11: Asia Pacific Invisalign Market Revenue (Million), by Country 2024 & 2032
- Figure 12: Asia Pacific Invisalign Market Volume (K Unit), by Country 2024 & 2032
- Figure 13: Asia Pacific Invisalign Market Revenue Share (%), by Country 2024 & 2032
- Figure 14: Asia Pacific Invisalign Market Volume Share (%), by Country 2024 & 2032
- Figure 15: Middle East and Africa Invisalign Market Revenue (Million), by Country 2024 & 2032
- Figure 16: Middle East and Africa Invisalign Market Volume (K Unit), by Country 2024 & 2032
- Figure 17: Middle East and Africa Invisalign Market Revenue Share (%), by Country 2024 & 2032
- Figure 18: Middle East and Africa Invisalign Market Volume Share (%), by Country 2024 & 2032
- Figure 19: South America Invisalign Market Revenue (Million), by Country 2024 & 2032
- Figure 20: South America Invisalign Market Volume (K Unit), by Country 2024 & 2032
- Figure 21: South America Invisalign Market Revenue Share (%), by Country 2024 & 2032
- Figure 22: South America Invisalign Market Volume Share (%), by Country 2024 & 2032
- Figure 23: North America Invisalign Market Revenue (Million), by Age 2024 & 2032
- Figure 24: North America Invisalign Market Volume (K Unit), by Age 2024 & 2032
- Figure 25: North America Invisalign Market Revenue Share (%), by Age 2024 & 2032
- Figure 26: North America Invisalign Market Volume Share (%), by Age 2024 & 2032
- Figure 27: North America Invisalign Market Revenue (Million), by End User 2024 & 2032
- Figure 28: North America Invisalign Market Volume (K Unit), by End User 2024 & 2032
- Figure 29: North America Invisalign Market Revenue Share (%), by End User 2024 & 2032
- Figure 30: North America Invisalign Market Volume Share (%), by End User 2024 & 2032
- Figure 31: North America Invisalign Market Revenue (Million), by Country 2024 & 2032
- Figure 32: North America Invisalign Market Volume (K Unit), by Country 2024 & 2032
- Figure 33: North America Invisalign Market Revenue Share (%), by Country 2024 & 2032
- Figure 34: North America Invisalign Market Volume Share (%), by Country 2024 & 2032
- Figure 35: Europe Invisalign Market Revenue (Million), by Age 2024 & 2032
- Figure 36: Europe Invisalign Market Volume (K Unit), by Age 2024 & 2032
- Figure 37: Europe Invisalign Market Revenue Share (%), by Age 2024 & 2032
- Figure 38: Europe Invisalign Market Volume Share (%), by Age 2024 & 2032
- Figure 39: Europe Invisalign Market Revenue (Million), by End User 2024 & 2032
- Figure 40: Europe Invisalign Market Volume (K Unit), by End User 2024 & 2032
- Figure 41: Europe Invisalign Market Revenue Share (%), by End User 2024 & 2032
- Figure 42: Europe Invisalign Market Volume Share (%), by End User 2024 & 2032
- Figure 43: Europe Invisalign Market Revenue (Million), by Country 2024 & 2032
- Figure 44: Europe Invisalign Market Volume (K Unit), by Country 2024 & 2032
- Figure 45: Europe Invisalign Market Revenue Share (%), by Country 2024 & 2032
- Figure 46: Europe Invisalign Market Volume Share (%), by Country 2024 & 2032
- Figure 47: Asia Pacific Invisalign Market Revenue (Million), by Age 2024 & 2032
- Figure 48: Asia Pacific Invisalign Market Volume (K Unit), by Age 2024 & 2032
- Figure 49: Asia Pacific Invisalign Market Revenue Share (%), by Age 2024 & 2032
- Figure 50: Asia Pacific Invisalign Market Volume Share (%), by Age 2024 & 2032
- Figure 51: Asia Pacific Invisalign Market Revenue (Million), by End User 2024 & 2032
- Figure 52: Asia Pacific Invisalign Market Volume (K Unit), by End User 2024 & 2032
- Figure 53: Asia Pacific Invisalign Market Revenue Share (%), by End User 2024 & 2032
- Figure 54: Asia Pacific Invisalign Market Volume Share (%), by End User 2024 & 2032
- Figure 55: Asia Pacific Invisalign Market Revenue (Million), by Country 2024 & 2032
- Figure 56: Asia Pacific Invisalign Market Volume (K Unit), by Country 2024 & 2032
- Figure 57: Asia Pacific Invisalign Market Revenue Share (%), by Country 2024 & 2032
- Figure 58: Asia Pacific Invisalign Market Volume Share (%), by Country 2024 & 2032
- Figure 59: Middle East and Africa Invisalign Market Revenue (Million), by Age 2024 & 2032
- Figure 60: Middle East and Africa Invisalign Market Volume (K Unit), by Age 2024 & 2032
- Figure 61: Middle East and Africa Invisalign Market Revenue Share (%), by Age 2024 & 2032
- Figure 62: Middle East and Africa Invisalign Market Volume Share (%), by Age 2024 & 2032
- Figure 63: Middle East and Africa Invisalign Market Revenue (Million), by End User 2024 & 2032
- Figure 64: Middle East and Africa Invisalign Market Volume (K Unit), by End User 2024 & 2032
- Figure 65: Middle East and Africa Invisalign Market Revenue Share (%), by End User 2024 & 2032
- Figure 66: Middle East and Africa Invisalign Market Volume Share (%), by End User 2024 & 2032
- Figure 67: Middle East and Africa Invisalign Market Revenue (Million), by Country 2024 & 2032
- Figure 68: Middle East and Africa Invisalign Market Volume (K Unit), by Country 2024 & 2032
- Figure 69: Middle East and Africa Invisalign Market Revenue Share (%), by Country 2024 & 2032
- Figure 70: Middle East and Africa Invisalign Market Volume Share (%), by Country 2024 & 2032
- Figure 71: South America Invisalign Market Revenue (Million), by Age 2024 & 2032
- Figure 72: South America Invisalign Market Volume (K Unit), by Age 2024 & 2032
- Figure 73: South America Invisalign Market Revenue Share (%), by Age 2024 & 2032
- Figure 74: South America Invisalign Market Volume Share (%), by Age 2024 & 2032
- Figure 75: South America Invisalign Market Revenue (Million), by End User 2024 & 2032
- Figure 76: South America Invisalign Market Volume (K Unit), by End User 2024 & 2032
- Figure 77: South America Invisalign Market Revenue Share (%), by End User 2024 & 2032
- Figure 78: South America Invisalign Market Volume Share (%), by End User 2024 & 2032
- Figure 79: South America Invisalign Market Revenue (Million), by Country 2024 & 2032
- Figure 80: South America Invisalign Market Volume (K Unit), by Country 2024 & 2032
- Figure 81: South America Invisalign Market Revenue Share (%), by Country 2024 & 2032
- Figure 82: South America Invisalign Market Volume Share (%), by Country 2024 & 2032
List of Tables
- Table 1: Global Invisalign Market Revenue Million Forecast, by Region 2019 & 2032
- Table 2: Global Invisalign Market Volume K Unit Forecast, by Region 2019 & 2032
- Table 3: Global Invisalign Market Revenue Million Forecast, by Age 2019 & 2032
- Table 4: Global Invisalign Market Volume K Unit Forecast, by Age 2019 & 2032
- Table 5: Global Invisalign Market Revenue Million Forecast, by End User 2019 & 2032
- Table 6: Global Invisalign Market Volume K Unit Forecast, by End User 2019 & 2032
- Table 7: Global Invisalign Market Revenue Million Forecast, by Region 2019 & 2032
- Table 8: Global Invisalign Market Volume K Unit Forecast, by Region 2019 & 2032
- Table 9: Global Invisalign Market Revenue Million Forecast, by Country 2019 & 2032
- Table 10: Global Invisalign Market Volume K Unit Forecast, by Country 2019 & 2032
- Table 11: United States Invisalign Market Revenue (Million) Forecast, by Application 2019 & 2032
- Table 12: United States Invisalign Market Volume (K Unit) Forecast, by Application 2019 & 2032
- Table 13: Canada Invisalign Market Revenue (Million) Forecast, by Application 2019 & 2032
- Table 14: Canada Invisalign Market Volume (K Unit) Forecast, by Application 2019 & 2032
- Table 15: Mexico Invisalign Market Revenue (Million) Forecast, by Application 2019 & 2032
- Table 16: Mexico Invisalign Market Volume (K Unit) Forecast, by Application 2019 & 2032
- Table 17: Global Invisalign Market Revenue Million Forecast, by Country 2019 & 2032
- Table 18: Global Invisalign Market Volume K Unit Forecast, by Country 2019 & 2032
- Table 19: Germany Invisalign Market Revenue (Million) Forecast, by Application 2019 & 2032
- Table 20: Germany Invisalign Market Volume (K Unit) Forecast, by Application 2019 & 2032
- Table 21: United Kingdom Invisalign Market Revenue (Million) Forecast, by Application 2019 & 2032
- Table 22: United Kingdom Invisalign Market Volume (K Unit) Forecast, by Application 2019 & 2032
- Table 23: France Invisalign Market Revenue (Million) Forecast, by Application 2019 & 2032
- Table 24: France Invisalign Market Volume (K Unit) Forecast, by Application 2019 & 2032
- Table 25: Italy Invisalign Market Revenue (Million) Forecast, by Application 2019 & 2032
- Table 26: Italy Invisalign Market Volume (K Unit) Forecast, by Application 2019 & 2032
- Table 27: Spain Invisalign Market Revenue (Million) Forecast, by Application 2019 & 2032
- Table 28: Spain Invisalign Market Volume (K Unit) Forecast, by Application 2019 & 2032
- Table 29: Rest of Europe Invisalign Market Revenue (Million) Forecast, by Application 2019 & 2032
- Table 30: Rest of Europe Invisalign Market Volume (K Unit) Forecast, by Application 2019 & 2032
- Table 31: Global Invisalign Market Revenue Million Forecast, by Country 2019 & 2032
- Table 32: Global Invisalign Market Volume K Unit Forecast, by Country 2019 & 2032
- Table 33: China Invisalign Market Revenue (Million) Forecast, by Application 2019 & 2032
- Table 34: China Invisalign Market Volume (K Unit) Forecast, by Application 2019 & 2032
- Table 35: Japan Invisalign Market Revenue (Million) Forecast, by Application 2019 & 2032
- Table 36: Japan Invisalign Market Volume (K Unit) Forecast, by Application 2019 & 2032
- Table 37: India Invisalign Market Revenue (Million) Forecast, by Application 2019 & 2032
- Table 38: India Invisalign Market Volume (K Unit) Forecast, by Application 2019 & 2032
- Table 39: Australia Invisalign Market Revenue (Million) Forecast, by Application 2019 & 2032
- Table 40: Australia Invisalign Market Volume (K Unit) Forecast, by Application 2019 & 2032
- Table 41: South Korea Invisalign Market Revenue (Million) Forecast, by Application 2019 & 2032
- Table 42: South Korea Invisalign Market Volume (K Unit) Forecast, by Application 2019 & 2032
- Table 43: Rest of Asia Pacific Invisalign Market Revenue (Million) Forecast, by Application 2019 & 2032
- Table 44: Rest of Asia Pacific Invisalign Market Volume (K Unit) Forecast, by Application 2019 & 2032
- Table 45: Global Invisalign Market Revenue Million Forecast, by Country 2019 & 2032
- Table 46: Global Invisalign Market Volume K Unit Forecast, by Country 2019 & 2032
- Table 47: GCC Invisalign Market Revenue (Million) Forecast, by Application 2019 & 2032
- Table 48: GCC Invisalign Market Volume (K Unit) Forecast, by Application 2019 & 2032
- Table 49: South Africa Invisalign Market Revenue (Million) Forecast, by Application 2019 & 2032
- Table 50: South Africa Invisalign Market Volume (K Unit) Forecast, by Application 2019 & 2032
- Table 51: Rest of Middle East and Africa Invisalign Market Revenue (Million) Forecast, by Application 2019 & 2032
- Table 52: Rest of Middle East and Africa Invisalign Market Volume (K Unit) Forecast, by Application 2019 & 2032
- Table 53: Global Invisalign Market Revenue Million Forecast, by Country 2019 & 2032
- Table 54: Global Invisalign Market Volume K Unit Forecast, by Country 2019 & 2032
- Table 55: Brazil Invisalign Market Revenue (Million) Forecast, by Application 2019 & 2032
- Table 56: Brazil Invisalign Market Volume (K Unit) Forecast, by Application 2019 & 2032
- Table 57: Argentina Invisalign Market Revenue (Million) Forecast, by Application 2019 & 2032
- Table 58: Argentina Invisalign Market Volume (K Unit) Forecast, by Application 2019 & 2032
- Table 59: Rest of South America Invisalign Market Revenue (Million) Forecast, by Application 2019 & 2032
- Table 60: Rest of South America Invisalign Market Volume (K Unit) Forecast, by Application 2019 & 2032
- Table 61: Global Invisalign Market Revenue Million Forecast, by Age 2019 & 2032
- Table 62: Global Invisalign Market Volume K Unit Forecast, by Age 2019 & 2032
- Table 63: Global Invisalign Market Revenue Million Forecast, by End User 2019 & 2032
- Table 64: Global Invisalign Market Volume K Unit Forecast, by End User 2019 & 2032
- Table 65: Global Invisalign Market Revenue Million Forecast, by Country 2019 & 2032
- Table 66: Global Invisalign Market Volume K Unit Forecast, by Country 2019 & 2032
- Table 67: United States Invisalign Market Revenue (Million) Forecast, by Application 2019 & 2032
- Table 68: United States Invisalign Market Volume (K Unit) Forecast, by Application 2019 & 2032
- Table 69: Canada Invisalign Market Revenue (Million) Forecast, by Application 2019 & 2032
- Table 70: Canada Invisalign Market Volume (K Unit) Forecast, by Application 2019 & 2032
- Table 71: Mexico Invisalign Market Revenue (Million) Forecast, by Application 2019 & 2032
- Table 72: Mexico Invisalign Market Volume (K Unit) Forecast, by Application 2019 & 2032
- Table 73: Global Invisalign Market Revenue Million Forecast, by Age 2019 & 2032
- Table 74: Global Invisalign Market Volume K Unit Forecast, by Age 2019 & 2032
- Table 75: Global Invisalign Market Revenue Million Forecast, by End User 2019 & 2032
- Table 76: Global Invisalign Market Volume K Unit Forecast, by End User 2019 & 2032
- Table 77: Global Invisalign Market Revenue Million Forecast, by Country 2019 & 2032
- Table 78: Global Invisalign Market Volume K Unit Forecast, by Country 2019 & 2032
- Table 79: Germany Invisalign Market Revenue (Million) Forecast, by Application 2019 & 2032
- Table 80: Germany Invisalign Market Volume (K Unit) Forecast, by Application 2019 & 2032
- Table 81: United Kingdom Invisalign Market Revenue (Million) Forecast, by Application 2019 & 2032
- Table 82: United Kingdom Invisalign Market Volume (K Unit) Forecast, by Application 2019 & 2032
- Table 83: France Invisalign Market Revenue (Million) Forecast, by Application 2019 & 2032
- Table 84: France Invisalign Market Volume (K Unit) Forecast, by Application 2019 & 2032
- Table 85: Italy Invisalign Market Revenue (Million) Forecast, by Application 2019 & 2032
- Table 86: Italy Invisalign Market Volume (K Unit) Forecast, by Application 2019 & 2032
- Table 87: Spain Invisalign Market Revenue (Million) Forecast, by Application 2019 & 2032
- Table 88: Spain Invisalign Market Volume (K Unit) Forecast, by Application 2019 & 2032
- Table 89: Rest of Europe Invisalign Market Revenue (Million) Forecast, by Application 2019 & 2032
- Table 90: Rest of Europe Invisalign Market Volume (K Unit) Forecast, by Application 2019 & 2032
- Table 91: Global Invisalign Market Revenue Million Forecast, by Age 2019 & 2032
- Table 92: Global Invisalign Market Volume K Unit Forecast, by Age 2019 & 2032
- Table 93: Global Invisalign Market Revenue Million Forecast, by End User 2019 & 2032
- Table 94: Global Invisalign Market Volume K Unit Forecast, by End User 2019 & 2032
- Table 95: Global Invisalign Market Revenue Million Forecast, by Country 2019 & 2032
- Table 96: Global Invisalign Market Volume K Unit Forecast, by Country 2019 & 2032
- Table 97: China Invisalign Market Revenue (Million) Forecast, by Application 2019 & 2032
- Table 98: China Invisalign Market Volume (K Unit) Forecast, by Application 2019 & 2032
- Table 99: Japan Invisalign Market Revenue (Million) Forecast, by Application 2019 & 2032
- Table 100: Japan Invisalign Market Volume (K Unit) Forecast, by Application 2019 & 2032
- Table 101: India Invisalign Market Revenue (Million) Forecast, by Application 2019 & 2032
- Table 102: India Invisalign Market Volume (K Unit) Forecast, by Application 2019 & 2032
- Table 103: Australia Invisalign Market Revenue (Million) Forecast, by Application 2019 & 2032
- Table 104: Australia Invisalign Market Volume (K Unit) Forecast, by Application 2019 & 2032
- Table 105: South Korea Invisalign Market Revenue (Million) Forecast, by Application 2019 & 2032
- Table 106: South Korea Invisalign Market Volume (K Unit) Forecast, by Application 2019 & 2032
- Table 107: Rest of Asia Pacific Invisalign Market Revenue (Million) Forecast, by Application 2019 & 2032
- Table 108: Rest of Asia Pacific Invisalign Market Volume (K Unit) Forecast, by Application 2019 & 2032
- Table 109: Global Invisalign Market Revenue Million Forecast, by Age 2019 & 2032
- Table 110: Global Invisalign Market Volume K Unit Forecast, by Age 2019 & 2032
- Table 111: Global Invisalign Market Revenue Million Forecast, by End User 2019 & 2032
- Table 112: Global Invisalign Market Volume K Unit Forecast, by End User 2019 & 2032
- Table 113: Global Invisalign Market Revenue Million Forecast, by Country 2019 & 2032
- Table 114: Global Invisalign Market Volume K Unit Forecast, by Country 2019 & 2032
- Table 115: GCC Invisalign Market Revenue (Million) Forecast, by Application 2019 & 2032
- Table 116: GCC Invisalign Market Volume (K Unit) Forecast, by Application 2019 & 2032
- Table 117: South Africa Invisalign Market Revenue (Million) Forecast, by Application 2019 & 2032
- Table 118: South Africa Invisalign Market Volume (K Unit) Forecast, by Application 2019 & 2032
- Table 119: Rest of Middle East and Africa Invisalign Market Revenue (Million) Forecast, by Application 2019 & 2032
- Table 120: Rest of Middle East and Africa Invisalign Market Volume (K Unit) Forecast, by Application 2019 & 2032
- Table 121: Global Invisalign Market Revenue Million Forecast, by Age 2019 & 2032
- Table 122: Global Invisalign Market Volume K Unit Forecast, by Age 2019 & 2032
- Table 123: Global Invisalign Market Revenue Million Forecast, by End User 2019 & 2032
- Table 124: Global Invisalign Market Volume K Unit Forecast, by End User 2019 & 2032
- Table 125: Global Invisalign Market Revenue Million Forecast, by Country 2019 & 2032
- Table 126: Global Invisalign Market Volume K Unit Forecast, by Country 2019 & 2032
- Table 127: Brazil Invisalign Market Revenue (Million) Forecast, by Application 2019 & 2032
- Table 128: Brazil Invisalign Market Volume (K Unit) Forecast, by Application 2019 & 2032
- Table 129: Argentina Invisalign Market Revenue (Million) Forecast, by Application 2019 & 2032
- Table 130: Argentina Invisalign Market Volume (K Unit) Forecast, by Application 2019 & 2032
- Table 131: Rest of South America Invisalign Market Revenue (Million) Forecast, by Application 2019 & 2032
- Table 132: Rest of South America Invisalign Market Volume (K Unit) Forecast, by Application 2019 & 2032
Frequently Asked Questions
1. What is the projected Compound Annual Growth Rate (CAGR) of the Invisalign Market?
The projected CAGR is approximately 24.80%.
2. Which companies are prominent players in the Invisalign Market?
Key companies in the market include Henry Schein Inc, 3Shape A/S, Dentsply Sirona, 3M Company, Argen Corporation, Angelalign Technology, Align Technology Inc, TP Orthodontics Inc, Patterson Companies Inc, Institut Straumann AG.
3. What are the main segments of the Invisalign Market?
The market segments include Age, End User.
4. Can you provide details about the market size?
The market size is estimated to be USD XX Million as of 2022.
5. What are some drivers contributing to market growth?
Increasing Dental Problems like Malocclusions. Crowding. etc.; Rising Digital Technologies in Dentistry.
6. What are the notable trends driving market growth?
Adult Segment is Expected to Have the Significant Market Share.
7. Are there any restraints impacting market growth?
Huge Cost of Clear Aligners.
8. Can you provide examples of recent developments in the market?
August 2022: Orthobrain, an Ohio-based orthodontic growth system, launched SimplyClear, a total solution for orthodontic growth that combines high-quality clear aligners with the proven support model that drives successful orthodontic programs and long-term revenue growth.
9. What pricing options are available for accessing the report?
Pricing options include single-user, multi-user, and enterprise licenses priced at USD 4750, USD 5250, and USD 8750 respectively.
10. Is the market size provided in terms of value or volume?
The market size is provided in terms of value, measured in Million and volume, measured in K Unit.
11. Are there any specific market keywords associated with the report?
Yes, the market keyword associated with the report is "Invisalign Market," which aids in identifying and referencing the specific market segment covered.
12. How do I determine which pricing option suits my needs best?
The pricing options vary based on user requirements and access needs. Individual users may opt for single-user licenses, while businesses requiring broader access may choose multi-user or enterprise licenses for cost-effective access to the report.
13. Are there any additional resources or data provided in the Invisalign Market report?
While the report offers comprehensive insights, it's advisable to review the specific contents or supplementary materials provided to ascertain if additional resources or data are available.
14. How can I stay updated on further developments or reports in the Invisalign Market?
To stay informed about further developments, trends, and reports in the Invisalign Market, consider subscribing to industry newsletters, following relevant companies and organizations, or regularly checking reputable industry news sources and publications.
Methodology
Step 1 - Identification of Relevant Samples Size from Population Database


Step 2 - Approaches for Defining Global Market Size (Value, Volume* & Price*)

Note*: In applicable scenarios
Step 3 - Data Sources
Primary Research
- Web Analytics
- Survey Reports
- Research Institute
- Latest Research Reports
- Opinion Leaders
Secondary Research
- Annual Reports
- White Paper
- Latest Press Release
- Industry Association
- Paid Database
- Investor Presentations

Step 4 - Data Triangulation
Involves using different sources of information in order to increase the validity of a study
These sources are likely to be stakeholders in a program - participants, other researchers, program staff, other community members, and so on.
Then we put all data in single framework & apply various statistical tools to find out the dynamic on the market.
During the analysis stage, feedback from the stakeholder groups would be compared to determine areas of agreement as well as areas of divergence
