

Key Insights
The GaN fast charge control chip market is experiencing robust growth, driven by the increasing demand for faster charging solutions in consumer electronics and electric vehicles. The market's expansion is fueled by the superior efficiency and power density offered by GaN technology compared to traditional silicon-based solutions. This translates to smaller, lighter, and more energy-efficient chargers, a crucial factor for mobile devices and portable power banks. The market segmentation reveals significant growth potential across various power ranges (0-50W and 50-100W) and control chip types (QR, LLC, ACF). While precise market sizing requires proprietary data, a conservative estimate, considering the high CAGR of similar semiconductor markets and the rapid adoption of GaN technology, suggests a market value exceeding $1 billion by 2025, with a projected Compound Annual Growth Rate (CAGR) of 25% from 2025 to 2033. This growth trajectory is further supported by the increasing number of players entering the market, including established semiconductor companies and emerging innovators, indicating significant investment and belief in the technology's future. This competitive landscape is fostering innovation in both chip design and manufacturing, driving down costs and making GaN fast charge control chips accessible to a broader range of applications.
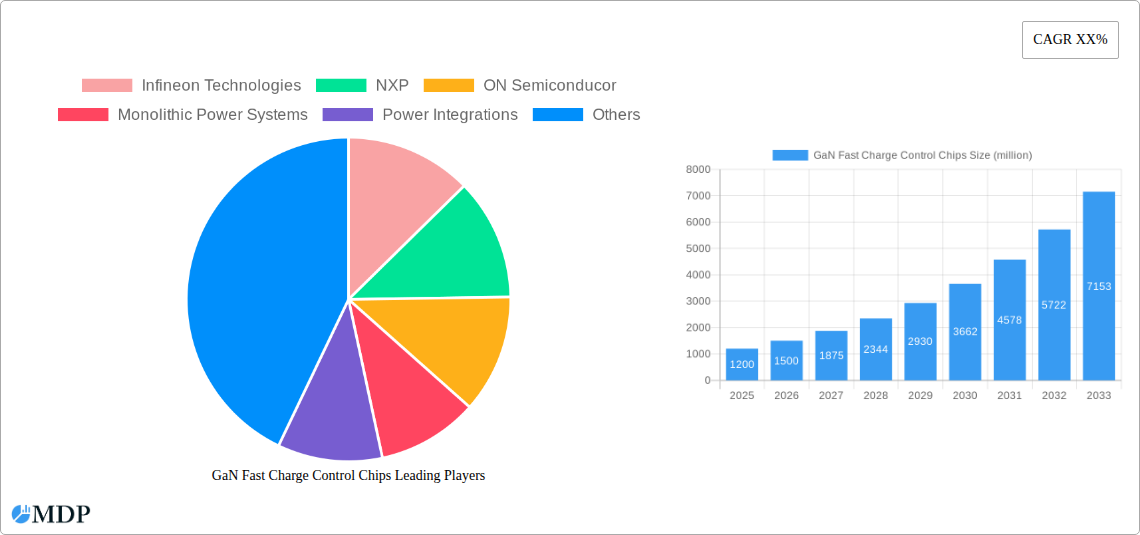
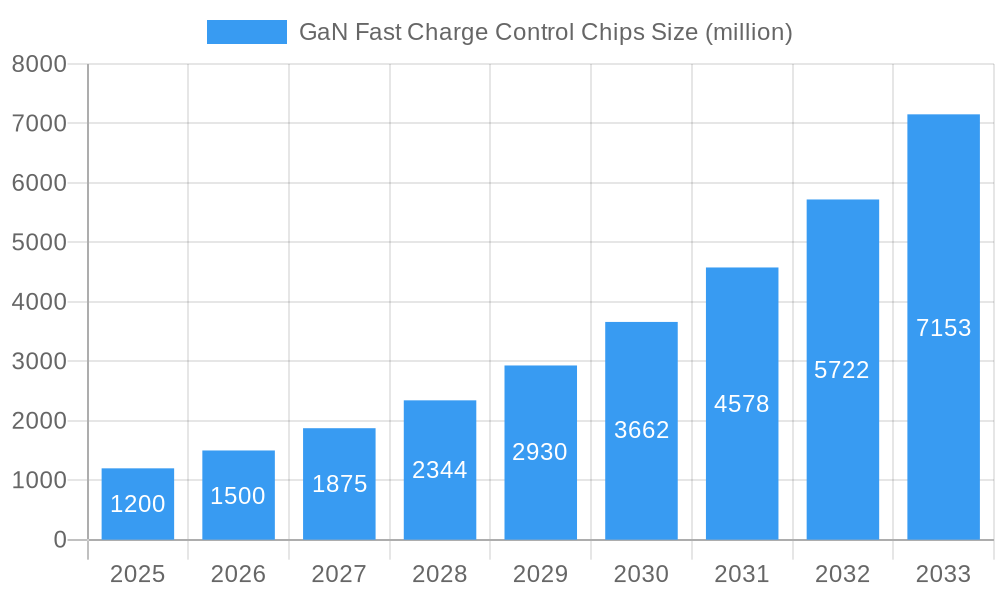
GaN Fast Charge Control Chips Market Size (In Billion)
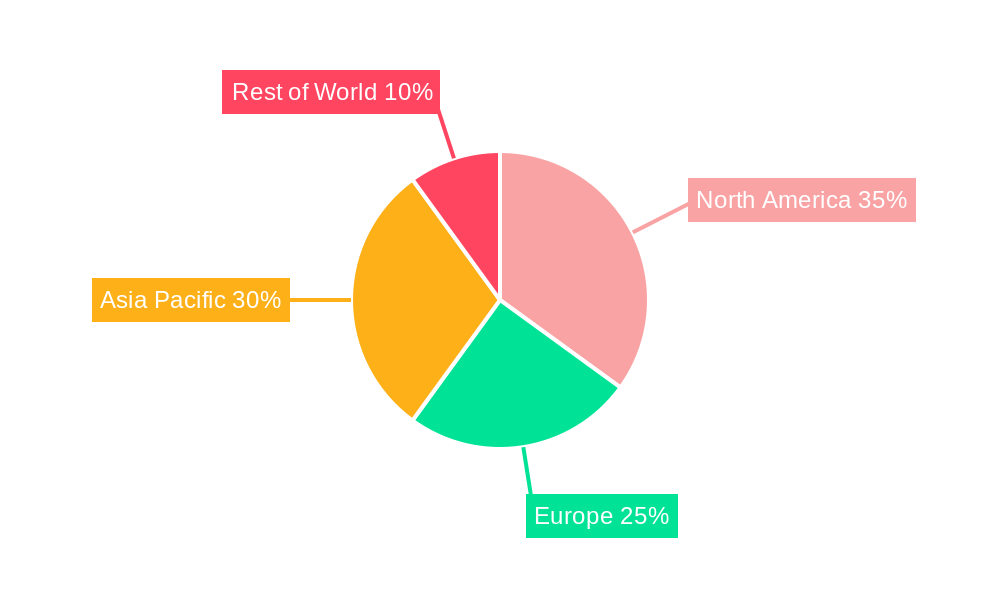
Despite the positive outlook, challenges remain. The higher initial cost of GaN compared to silicon poses a barrier to entry for some manufacturers. Furthermore, the market faces potential restraints from technological limitations in high-power applications and the ongoing development of alternative fast-charging technologies. However, ongoing research and development are addressing these limitations, paving the way for further market penetration. Regional adoption varies; North America and Asia-Pacific are expected to lead the market, driven by strong consumer demand and substantial manufacturing capacity in these regions. The market's growth will largely depend on the successful integration of GaN technology into various device types, consistent improvement in cost-effectiveness, and addressing the challenges related to high-power applications and overall standardization.
GaN Fast Charge Control Chips Company Market Share
This comprehensive report provides an in-depth analysis of the GaN Fast Charge Control Chips market, offering invaluable insights for industry stakeholders, investors, and strategic decision-makers. Covering the period from 2019 to 2033, with a focus on 2025, this report unveils the market dynamics, competitive landscape, and future growth trajectory of this rapidly evolving sector. The market is projected to reach xx million USD by 2033, exhibiting a CAGR of xx% during the forecast period (2025-2033).
GaN Fast Charge Control Chips Market Dynamics & Concentration
This section analyzes the market concentration, innovation drivers, regulatory landscape, product substitutes, end-user trends, and mergers & acquisitions (M&A) activities within the GaN Fast Charge Control Chips market. The market is characterized by a moderately concentrated landscape, with key players such as Infineon Technologies, NXP, ON Semiconductor, and Monolithic Power Systems holding significant market share. However, the emergence of several smaller, innovative players is increasing competition.
- Market Share: Infineon Technologies holds an estimated xx% market share in 2025, followed by NXP at xx%, ON Semiconductor at xx%, and MPS at xx%. The remaining market share is distributed among other players, including Power Integrations, Texas Instruments, and several smaller companies.
- M&A Activity: The historical period (2019-2024) witnessed approximately xx M&A deals in the GaN fast-charging space, primarily focused on consolidating technologies and expanding market reach. The forecast period is expected to see a further increase in M&A activity, driven by the need for enhanced technological capabilities and global expansion.
- Innovation Drivers: Continuous advancements in GaN technology, driving increased efficiency and power density, are key innovation drivers. Stricter energy efficiency regulations globally are also fueling demand for GaN-based fast-charging solutions.
- Regulatory Frameworks: Government regulations promoting energy efficiency and environmental sustainability are creating a favorable environment for GaN fast-charging technology adoption. However, variations in regulatory frameworks across different regions may pose challenges.
- Product Substitutes: While GaN technology offers significant advantages, existing silicon-based solutions remain competitive in certain segments. The report analyzes the competitive landscape considering substitute technologies and their market implications.
- End-User Trends: Growing demand for fast-charging solutions from consumers and the increasing adoption of mobile devices and electric vehicles are driving the market's growth.
GaN Fast Charge Control Chips Industry Trends & Analysis
This section delves into the key trends shaping the GaN fast-charge control chips market. The market is experiencing robust growth, fueled by several factors. The increasing adoption of smartphones, laptops, and electric vehicles demanding faster charging capabilities significantly boosts the demand for GaN-based fast charging solutions. Moreover, technological advancements in GaN technology are enhancing efficiency and power density, making it more attractive to manufacturers.
The market is expected to witness significant technological disruptions in the coming years, with the development of more efficient and compact GaN devices. This will lead to smaller, lighter, and more efficient chargers, catering to the growing consumer preference for portable and powerful charging solutions. The competitive landscape is dynamic, with both established players and emerging companies investing heavily in R&D and expanding their product portfolios. The market penetration of GaN fast charging solutions is growing rapidly, with an expected xx% penetration rate by 2033.
Leading Markets & Segments in GaN Fast Charge Control Chips
The report identifies key regional and segmental dominance within the GaN Fast Charge Control Chips market.
Dominant Regions: Asia-Pacific is expected to be the leading market due to the high concentration of electronic manufacturing hubs and rapid growth in consumer electronics demand. North America and Europe are also significant markets, driven by high consumer disposable income and the adoption of advanced charging technologies.
Dominant Segments:
Application: The 0-50W GaN charger segment currently holds the largest market share, driven by widespread adoption in mobile device charging. However, the 50-100W segment is expected to experience significant growth due to increasing demand for fast charging of laptops and other high-power devices.
Types: The QR (Quasi-Resonant) topology dominates the market due to its high efficiency and ease of implementation. However, LLC (LLC resonant) and ACF (Active Clamp Flyback) topologies are gaining traction, offering improved performance in specific applications.
Key Drivers (Bullet Points):
- Asia-Pacific: Strong economic growth, large consumer base, and expanding manufacturing infrastructure.
- North America: High adoption of advanced technologies, strong consumer demand for high-power chargers, favorable regulatory policies.
- Europe: Growing focus on energy efficiency, stringent environmental regulations, and increasing adoption of electric vehicles.
- QR Topology: High efficiency, cost-effectiveness, and ease of implementation.
- 0-50W Application: Large market size due to widespread adoption in mobile device charging.
GaN Fast Charge Control Chips Product Developments
Recent product innovations focus on higher efficiency, smaller form factors, and wider input voltage ranges to address diverse applications. The integration of advanced control algorithms improves performance and reliability. Manufacturers are increasingly emphasizing the competitive advantages of their GaN-based solutions through improved thermal management, enhanced power density, and lower cost per watt. The market is also seeing the introduction of integrated GaN solutions, combining GaN transistors with other necessary components to simplify design and reduce production costs.
Key Drivers of GaN Fast Charge Control Chips Growth
Several factors are driving the growth of the GaN fast charge control chips market. These include:
- Technological Advancements: Continuous improvements in GaN technology lead to higher efficiency, smaller size, and lower cost.
- Increased Demand for Fast Charging: Consumers demand faster charging speeds for their electronic devices.
- Stringent Energy Efficiency Regulations: Governments worldwide are enacting stricter energy efficiency regulations, making GaN technology more appealing.
- Growth of Electric Vehicles: The rapid increase in electric vehicle adoption is driving demand for high-power fast-charging solutions.
Challenges in the GaN Fast Charge Control Chips Market
The market faces challenges such as:
- High Initial Costs: The cost of GaN technology is still higher compared to traditional silicon-based solutions, limiting its adoption in some price-sensitive markets.
- Supply Chain Issues: The global chip shortage impacts the availability of GaN-based components, creating potential supply chain disruptions.
- Competition from Established Players: Established players in the power semiconductor market pose a significant challenge to GaN technology adoption.
- Thermal Management: Effective thermal management remains a challenge, requiring robust solutions for higher-power GaN-based chargers.
Emerging Opportunities in GaN Fast Charge Control Chips
Emerging opportunities include the expansion into new application areas like electric vehicles, industrial equipment, and data centers. Strategic partnerships and collaborations between GaN chip manufacturers and system integrators will drive market penetration. Further breakthroughs in GaN technology, such as higher switching frequencies and improved thermal management, will unlock new market segments and create substantial growth opportunities.
Leading Players in the GaN Fast Charge Control Chips Sector
- Infineon Technologies
- NXP
- ON Semiconductor
- Monolithic Power Systems
- Power Integrations
- Texas Instruments
- Joulwatt Technology Co
- Anhui Dongke Semiconductor Co
- Kiwi
- MIX-DESIGN
- Silergy
- Southchip
- Reactor Micro
Key Milestones in GaN Fast Charge Control Chips Industry
- 2020: Several key players announced significant investments in GaN technology R&D.
- 2021: Launch of several high-power GaN-based fast chargers for electric vehicles.
- 2022: Increased adoption of GaN technology in consumer electronics, leading to a surge in market demand.
- 2023: Several mergers and acquisitions within the GaN industry, leading to further consolidation.
- 2024: Continued advancements in GaN technology, resulting in improved efficiency and lower costs.
Strategic Outlook for GaN Fast Charge Control Chips Market
The GaN fast charge control chips market is poised for sustained growth, driven by technological advancements, increasing demand for fast charging, and favorable regulatory environments. Strategic partnerships, focused R&D efforts, and expansion into new applications will be crucial for success. The market's long-term potential is significant, presenting attractive opportunities for both established players and new entrants.
GaN Fast Charge Control Chips Segmentation
-
1. Application
- 1.1. 0-50W GaN Chargers
- 1.2. 50-100W GaN Chargers
-
2. Types
- 2.1. QR
- 2.2. LLC
- 2.3. ACF
- 2.4. Other
GaN Fast Charge Control Chips Segmentation By Geography
-
1. North America
- 1.1. United States
- 1.2. Canada
- 1.3. Mexico
-
2. South America
- 2.1. Brazil
- 2.2. Argentina
- 2.3. Rest of South America
-
3. Europe
- 3.1. United Kingdom
- 3.2. Germany
- 3.3. France
- 3.4. Italy
- 3.5. Spain
- 3.6. Russia
- 3.7. Benelux
- 3.8. Nordics
- 3.9. Rest of Europe
-
4. Middle East & Africa
- 4.1. Turkey
- 4.2. Israel
- 4.3. GCC
- 4.4. North Africa
- 4.5. South Africa
- 4.6. Rest of Middle East & Africa
-
5. Asia Pacific
- 5.1. China
- 5.2. India
- 5.3. Japan
- 5.4. South Korea
- 5.5. ASEAN
- 5.6. Oceania
- 5.7. Rest of Asia Pacific
GaN Fast Charge Control Chips Regional Market Share
Geographic Coverage of GaN Fast Charge Control Chips
GaN Fast Charge Control Chips REPORT HIGHLIGHTS
| Aspects | Details |
|---|---|
| Study Period | 2020-2034 |
| Base Year | 2025 |
| Estimated Year | 2026 |
| Forecast Period | 2026-2034 |
| Historical Period | 2020-2025 |
| Growth Rate | CAGR of 18.2% from 2020-2034 |
| Segmentation |
|
Table of Contents
- 1. Introduction
- 1.1. Research Scope
- 1.2. Market Segmentation
- 1.3. Research Methodology
- 1.4. Definitions and Assumptions
- 2. Executive Summary
- 2.1. Introduction
- 3. Market Dynamics
- 3.1. Introduction
- 3.2. Market Drivers
- 3.3. Market Restrains
- 3.4. Market Trends
- 4. Market Factor Analysis
- 4.1. Porters Five Forces
- 4.2. Supply/Value Chain
- 4.3. PESTEL analysis
- 4.4. Market Entropy
- 4.5. Patent/Trademark Analysis
- 5. Global GaN Fast Charge Control Chips Analysis, Insights and Forecast, 2020-2032
- 5.1. Market Analysis, Insights and Forecast - by Application
- 5.1.1. 0-50W GaN Chargers
- 5.1.2. 50-100W GaN Chargers
- 5.2. Market Analysis, Insights and Forecast - by Types
- 5.2.1. QR
- 5.2.2. LLC
- 5.2.3. ACF
- 5.2.4. Other
- 5.3. Market Analysis, Insights and Forecast - by Region
- 5.3.1. North America
- 5.3.2. South America
- 5.3.3. Europe
- 5.3.4. Middle East & Africa
- 5.3.5. Asia Pacific
- 5.1. Market Analysis, Insights and Forecast - by Application
- 6. North America GaN Fast Charge Control Chips Analysis, Insights and Forecast, 2020-2032
- 6.1. Market Analysis, Insights and Forecast - by Application
- 6.1.1. 0-50W GaN Chargers
- 6.1.2. 50-100W GaN Chargers
- 6.2. Market Analysis, Insights and Forecast - by Types
- 6.2.1. QR
- 6.2.2. LLC
- 6.2.3. ACF
- 6.2.4. Other
- 6.1. Market Analysis, Insights and Forecast - by Application
- 7. South America GaN Fast Charge Control Chips Analysis, Insights and Forecast, 2020-2032
- 7.1. Market Analysis, Insights and Forecast - by Application
- 7.1.1. 0-50W GaN Chargers
- 7.1.2. 50-100W GaN Chargers
- 7.2. Market Analysis, Insights and Forecast - by Types
- 7.2.1. QR
- 7.2.2. LLC
- 7.2.3. ACF
- 7.2.4. Other
- 7.1. Market Analysis, Insights and Forecast - by Application
- 8. Europe GaN Fast Charge Control Chips Analysis, Insights and Forecast, 2020-2032
- 8.1. Market Analysis, Insights and Forecast - by Application
- 8.1.1. 0-50W GaN Chargers
- 8.1.2. 50-100W GaN Chargers
- 8.2. Market Analysis, Insights and Forecast - by Types
- 8.2.1. QR
- 8.2.2. LLC
- 8.2.3. ACF
- 8.2.4. Other
- 8.1. Market Analysis, Insights and Forecast - by Application
- 9. Middle East & Africa GaN Fast Charge Control Chips Analysis, Insights and Forecast, 2020-2032
- 9.1. Market Analysis, Insights and Forecast - by Application
- 9.1.1. 0-50W GaN Chargers
- 9.1.2. 50-100W GaN Chargers
- 9.2. Market Analysis, Insights and Forecast - by Types
- 9.2.1. QR
- 9.2.2. LLC
- 9.2.3. ACF
- 9.2.4. Other
- 9.1. Market Analysis, Insights and Forecast - by Application
- 10. Asia Pacific GaN Fast Charge Control Chips Analysis, Insights and Forecast, 2020-2032
- 10.1. Market Analysis, Insights and Forecast - by Application
- 10.1.1. 0-50W GaN Chargers
- 10.1.2. 50-100W GaN Chargers
- 10.2. Market Analysis, Insights and Forecast - by Types
- 10.2.1. QR
- 10.2.2. LLC
- 10.2.3. ACF
- 10.2.4. Other
- 10.1. Market Analysis, Insights and Forecast - by Application
- 11. Competitive Analysis
- 11.1. Global Market Share Analysis 2025
- 11.2. Company Profiles
- 11.2.1 Infineon Technologies
- 11.2.1.1. Overview
- 11.2.1.2. Products
- 11.2.1.3. SWOT Analysis
- 11.2.1.4. Recent Developments
- 11.2.1.5. Financials (Based on Availability)
- 11.2.2 NXP
- 11.2.2.1. Overview
- 11.2.2.2. Products
- 11.2.2.3. SWOT Analysis
- 11.2.2.4. Recent Developments
- 11.2.2.5. Financials (Based on Availability)
- 11.2.3 ON Semiconducor
- 11.2.3.1. Overview
- 11.2.3.2. Products
- 11.2.3.3. SWOT Analysis
- 11.2.3.4. Recent Developments
- 11.2.3.5. Financials (Based on Availability)
- 11.2.4 Monolithic Power Systems
- 11.2.4.1. Overview
- 11.2.4.2. Products
- 11.2.4.3. SWOT Analysis
- 11.2.4.4. Recent Developments
- 11.2.4.5. Financials (Based on Availability)
- 11.2.5 Power Integrations
- 11.2.5.1. Overview
- 11.2.5.2. Products
- 11.2.5.3. SWOT Analysis
- 11.2.5.4. Recent Developments
- 11.2.5.5. Financials (Based on Availability)
- 11.2.6 Texas Instruments
- 11.2.6.1. Overview
- 11.2.6.2. Products
- 11.2.6.3. SWOT Analysis
- 11.2.6.4. Recent Developments
- 11.2.6.5. Financials (Based on Availability)
- 11.2.7 Joulwatt Technology Co
- 11.2.7.1. Overview
- 11.2.7.2. Products
- 11.2.7.3. SWOT Analysis
- 11.2.7.4. Recent Developments
- 11.2.7.5. Financials (Based on Availability)
- 11.2.8 Anhui Dongke Semiconducor Co
- 11.2.8.1. Overview
- 11.2.8.2. Products
- 11.2.8.3. SWOT Analysis
- 11.2.8.4. Recent Developments
- 11.2.8.5. Financials (Based on Availability)
- 11.2.9 Kiwi
- 11.2.9.1. Overview
- 11.2.9.2. Products
- 11.2.9.3. SWOT Analysis
- 11.2.9.4. Recent Developments
- 11.2.9.5. Financials (Based on Availability)
- 11.2.10 MIX-DESIGN
- 11.2.10.1. Overview
- 11.2.10.2. Products
- 11.2.10.3. SWOT Analysis
- 11.2.10.4. Recent Developments
- 11.2.10.5. Financials (Based on Availability)
- 11.2.11 Silergy
- 11.2.11.1. Overview
- 11.2.11.2. Products
- 11.2.11.3. SWOT Analysis
- 11.2.11.4. Recent Developments
- 11.2.11.5. Financials (Based on Availability)
- 11.2.12 Southchip
- 11.2.12.1. Overview
- 11.2.12.2. Products
- 11.2.12.3. SWOT Analysis
- 11.2.12.4. Recent Developments
- 11.2.12.5. Financials (Based on Availability)
- 11.2.13 Reactor Micro
- 11.2.13.1. Overview
- 11.2.13.2. Products
- 11.2.13.3. SWOT Analysis
- 11.2.13.4. Recent Developments
- 11.2.13.5. Financials (Based on Availability)
- 11.2.1 Infineon Technologies
List of Figures
- Figure 1: Global GaN Fast Charge Control Chips Revenue Breakdown (undefined, %) by Region 2025 & 2033
- Figure 2: North America GaN Fast Charge Control Chips Revenue (undefined), by Application 2025 & 2033
- Figure 3: North America GaN Fast Charge Control Chips Revenue Share (%), by Application 2025 & 2033
- Figure 4: North America GaN Fast Charge Control Chips Revenue (undefined), by Types 2025 & 2033
- Figure 5: North America GaN Fast Charge Control Chips Revenue Share (%), by Types 2025 & 2033
- Figure 6: North America GaN Fast Charge Control Chips Revenue (undefined), by Country 2025 & 2033
- Figure 7: North America GaN Fast Charge Control Chips Revenue Share (%), by Country 2025 & 2033
- Figure 8: South America GaN Fast Charge Control Chips Revenue (undefined), by Application 2025 & 2033
- Figure 9: South America GaN Fast Charge Control Chips Revenue Share (%), by Application 2025 & 2033
- Figure 10: South America GaN Fast Charge Control Chips Revenue (undefined), by Types 2025 & 2033
- Figure 11: South America GaN Fast Charge Control Chips Revenue Share (%), by Types 2025 & 2033
- Figure 12: South America GaN Fast Charge Control Chips Revenue (undefined), by Country 2025 & 2033
- Figure 13: South America GaN Fast Charge Control Chips Revenue Share (%), by Country 2025 & 2033
- Figure 14: Europe GaN Fast Charge Control Chips Revenue (undefined), by Application 2025 & 2033
- Figure 15: Europe GaN Fast Charge Control Chips Revenue Share (%), by Application 2025 & 2033
- Figure 16: Europe GaN Fast Charge Control Chips Revenue (undefined), by Types 2025 & 2033
- Figure 17: Europe GaN Fast Charge Control Chips Revenue Share (%), by Types 2025 & 2033
- Figure 18: Europe GaN Fast Charge Control Chips Revenue (undefined), by Country 2025 & 2033
- Figure 19: Europe GaN Fast Charge Control Chips Revenue Share (%), by Country 2025 & 2033
- Figure 20: Middle East & Africa GaN Fast Charge Control Chips Revenue (undefined), by Application 2025 & 2033
- Figure 21: Middle East & Africa GaN Fast Charge Control Chips Revenue Share (%), by Application 2025 & 2033
- Figure 22: Middle East & Africa GaN Fast Charge Control Chips Revenue (undefined), by Types 2025 & 2033
- Figure 23: Middle East & Africa GaN Fast Charge Control Chips Revenue Share (%), by Types 2025 & 2033
- Figure 24: Middle East & Africa GaN Fast Charge Control Chips Revenue (undefined), by Country 2025 & 2033
- Figure 25: Middle East & Africa GaN Fast Charge Control Chips Revenue Share (%), by Country 2025 & 2033
- Figure 26: Asia Pacific GaN Fast Charge Control Chips Revenue (undefined), by Application 2025 & 2033
- Figure 27: Asia Pacific GaN Fast Charge Control Chips Revenue Share (%), by Application 2025 & 2033
- Figure 28: Asia Pacific GaN Fast Charge Control Chips Revenue (undefined), by Types 2025 & 2033
- Figure 29: Asia Pacific GaN Fast Charge Control Chips Revenue Share (%), by Types 2025 & 2033
- Figure 30: Asia Pacific GaN Fast Charge Control Chips Revenue (undefined), by Country 2025 & 2033
- Figure 31: Asia Pacific GaN Fast Charge Control Chips Revenue Share (%), by Country 2025 & 2033
List of Tables
- Table 1: Global GaN Fast Charge Control Chips Revenue undefined Forecast, by Application 2020 & 2033
- Table 2: Global GaN Fast Charge Control Chips Revenue undefined Forecast, by Types 2020 & 2033
- Table 3: Global GaN Fast Charge Control Chips Revenue undefined Forecast, by Region 2020 & 2033
- Table 4: Global GaN Fast Charge Control Chips Revenue undefined Forecast, by Application 2020 & 2033
- Table 5: Global GaN Fast Charge Control Chips Revenue undefined Forecast, by Types 2020 & 2033
- Table 6: Global GaN Fast Charge Control Chips Revenue undefined Forecast, by Country 2020 & 2033
- Table 7: United States GaN Fast Charge Control Chips Revenue (undefined) Forecast, by Application 2020 & 2033
- Table 8: Canada GaN Fast Charge Control Chips Revenue (undefined) Forecast, by Application 2020 & 2033
- Table 9: Mexico GaN Fast Charge Control Chips Revenue (undefined) Forecast, by Application 2020 & 2033
- Table 10: Global GaN Fast Charge Control Chips Revenue undefined Forecast, by Application 2020 & 2033
- Table 11: Global GaN Fast Charge Control Chips Revenue undefined Forecast, by Types 2020 & 2033
- Table 12: Global GaN Fast Charge Control Chips Revenue undefined Forecast, by Country 2020 & 2033
- Table 13: Brazil GaN Fast Charge Control Chips Revenue (undefined) Forecast, by Application 2020 & 2033
- Table 14: Argentina GaN Fast Charge Control Chips Revenue (undefined) Forecast, by Application 2020 & 2033
- Table 15: Rest of South America GaN Fast Charge Control Chips Revenue (undefined) Forecast, by Application 2020 & 2033
- Table 16: Global GaN Fast Charge Control Chips Revenue undefined Forecast, by Application 2020 & 2033
- Table 17: Global GaN Fast Charge Control Chips Revenue undefined Forecast, by Types 2020 & 2033
- Table 18: Global GaN Fast Charge Control Chips Revenue undefined Forecast, by Country 2020 & 2033
- Table 19: United Kingdom GaN Fast Charge Control Chips Revenue (undefined) Forecast, by Application 2020 & 2033
- Table 20: Germany GaN Fast Charge Control Chips Revenue (undefined) Forecast, by Application 2020 & 2033
- Table 21: France GaN Fast Charge Control Chips Revenue (undefined) Forecast, by Application 2020 & 2033
- Table 22: Italy GaN Fast Charge Control Chips Revenue (undefined) Forecast, by Application 2020 & 2033
- Table 23: Spain GaN Fast Charge Control Chips Revenue (undefined) Forecast, by Application 2020 & 2033
- Table 24: Russia GaN Fast Charge Control Chips Revenue (undefined) Forecast, by Application 2020 & 2033
- Table 25: Benelux GaN Fast Charge Control Chips Revenue (undefined) Forecast, by Application 2020 & 2033
- Table 26: Nordics GaN Fast Charge Control Chips Revenue (undefined) Forecast, by Application 2020 & 2033
- Table 27: Rest of Europe GaN Fast Charge Control Chips Revenue (undefined) Forecast, by Application 2020 & 2033
- Table 28: Global GaN Fast Charge Control Chips Revenue undefined Forecast, by Application 2020 & 2033
- Table 29: Global GaN Fast Charge Control Chips Revenue undefined Forecast, by Types 2020 & 2033
- Table 30: Global GaN Fast Charge Control Chips Revenue undefined Forecast, by Country 2020 & 2033
- Table 31: Turkey GaN Fast Charge Control Chips Revenue (undefined) Forecast, by Application 2020 & 2033
- Table 32: Israel GaN Fast Charge Control Chips Revenue (undefined) Forecast, by Application 2020 & 2033
- Table 33: GCC GaN Fast Charge Control Chips Revenue (undefined) Forecast, by Application 2020 & 2033
- Table 34: North Africa GaN Fast Charge Control Chips Revenue (undefined) Forecast, by Application 2020 & 2033
- Table 35: South Africa GaN Fast Charge Control Chips Revenue (undefined) Forecast, by Application 2020 & 2033
- Table 36: Rest of Middle East & Africa GaN Fast Charge Control Chips Revenue (undefined) Forecast, by Application 2020 & 2033
- Table 37: Global GaN Fast Charge Control Chips Revenue undefined Forecast, by Application 2020 & 2033
- Table 38: Global GaN Fast Charge Control Chips Revenue undefined Forecast, by Types 2020 & 2033
- Table 39: Global GaN Fast Charge Control Chips Revenue undefined Forecast, by Country 2020 & 2033
- Table 40: China GaN Fast Charge Control Chips Revenue (undefined) Forecast, by Application 2020 & 2033
- Table 41: India GaN Fast Charge Control Chips Revenue (undefined) Forecast, by Application 2020 & 2033
- Table 42: Japan GaN Fast Charge Control Chips Revenue (undefined) Forecast, by Application 2020 & 2033
- Table 43: South Korea GaN Fast Charge Control Chips Revenue (undefined) Forecast, by Application 2020 & 2033
- Table 44: ASEAN GaN Fast Charge Control Chips Revenue (undefined) Forecast, by Application 2020 & 2033
- Table 45: Oceania GaN Fast Charge Control Chips Revenue (undefined) Forecast, by Application 2020 & 2033
- Table 46: Rest of Asia Pacific GaN Fast Charge Control Chips Revenue (undefined) Forecast, by Application 2020 & 2033
Frequently Asked Questions
1. What is the projected Compound Annual Growth Rate (CAGR) of the GaN Fast Charge Control Chips?
The projected CAGR is approximately 18.2%.
2. Which companies are prominent players in the GaN Fast Charge Control Chips?
Key companies in the market include Infineon Technologies, NXP, ON Semiconducor, Monolithic Power Systems, Power Integrations, Texas Instruments, Joulwatt Technology Co, Anhui Dongke Semiconducor Co, Kiwi, MIX-DESIGN, Silergy, Southchip, Reactor Micro.
3. What are the main segments of the GaN Fast Charge Control Chips?
The market segments include Application, Types.
4. Can you provide details about the market size?
The market size is estimated to be USD XXX N/A as of 2022.
5. What are some drivers contributing to market growth?
N/A
6. What are the notable trends driving market growth?
N/A
7. Are there any restraints impacting market growth?
N/A
8. Can you provide examples of recent developments in the market?
N/A
9. What pricing options are available for accessing the report?
Pricing options include single-user, multi-user, and enterprise licenses priced at USD 4900.00, USD 7350.00, and USD 9800.00 respectively.
10. Is the market size provided in terms of value or volume?
The market size is provided in terms of value, measured in N/A.
11. Are there any specific market keywords associated with the report?
Yes, the market keyword associated with the report is "GaN Fast Charge Control Chips," which aids in identifying and referencing the specific market segment covered.
12. How do I determine which pricing option suits my needs best?
The pricing options vary based on user requirements and access needs. Individual users may opt for single-user licenses, while businesses requiring broader access may choose multi-user or enterprise licenses for cost-effective access to the report.
13. Are there any additional resources or data provided in the GaN Fast Charge Control Chips report?
While the report offers comprehensive insights, it's advisable to review the specific contents or supplementary materials provided to ascertain if additional resources or data are available.
14. How can I stay updated on further developments or reports in the GaN Fast Charge Control Chips?
To stay informed about further developments, trends, and reports in the GaN Fast Charge Control Chips, consider subscribing to industry newsletters, following relevant companies and organizations, or regularly checking reputable industry news sources and publications.
Methodology
Step 1 - Identification of Relevant Samples Size from Population Database


Step 2 - Approaches for Defining Global Market Size (Value, Volume* & Price*)

Note*: In applicable scenarios
Step 3 - Data Sources
Primary Research
- Web Analytics
- Survey Reports
- Research Institute
- Latest Research Reports
- Opinion Leaders
Secondary Research
- Annual Reports
- White Paper
- Latest Press Release
- Industry Association
- Paid Database
- Investor Presentations

Step 4 - Data Triangulation
Involves using different sources of information in order to increase the validity of a study
These sources are likely to be stakeholders in a program - participants, other researchers, program staff, other community members, and so on.
Then we put all data in single framework & apply various statistical tools to find out the dynamic on the market.
During the analysis stage, feedback from the stakeholder groups would be compared to determine areas of agreement as well as areas of divergence