

Key Insights
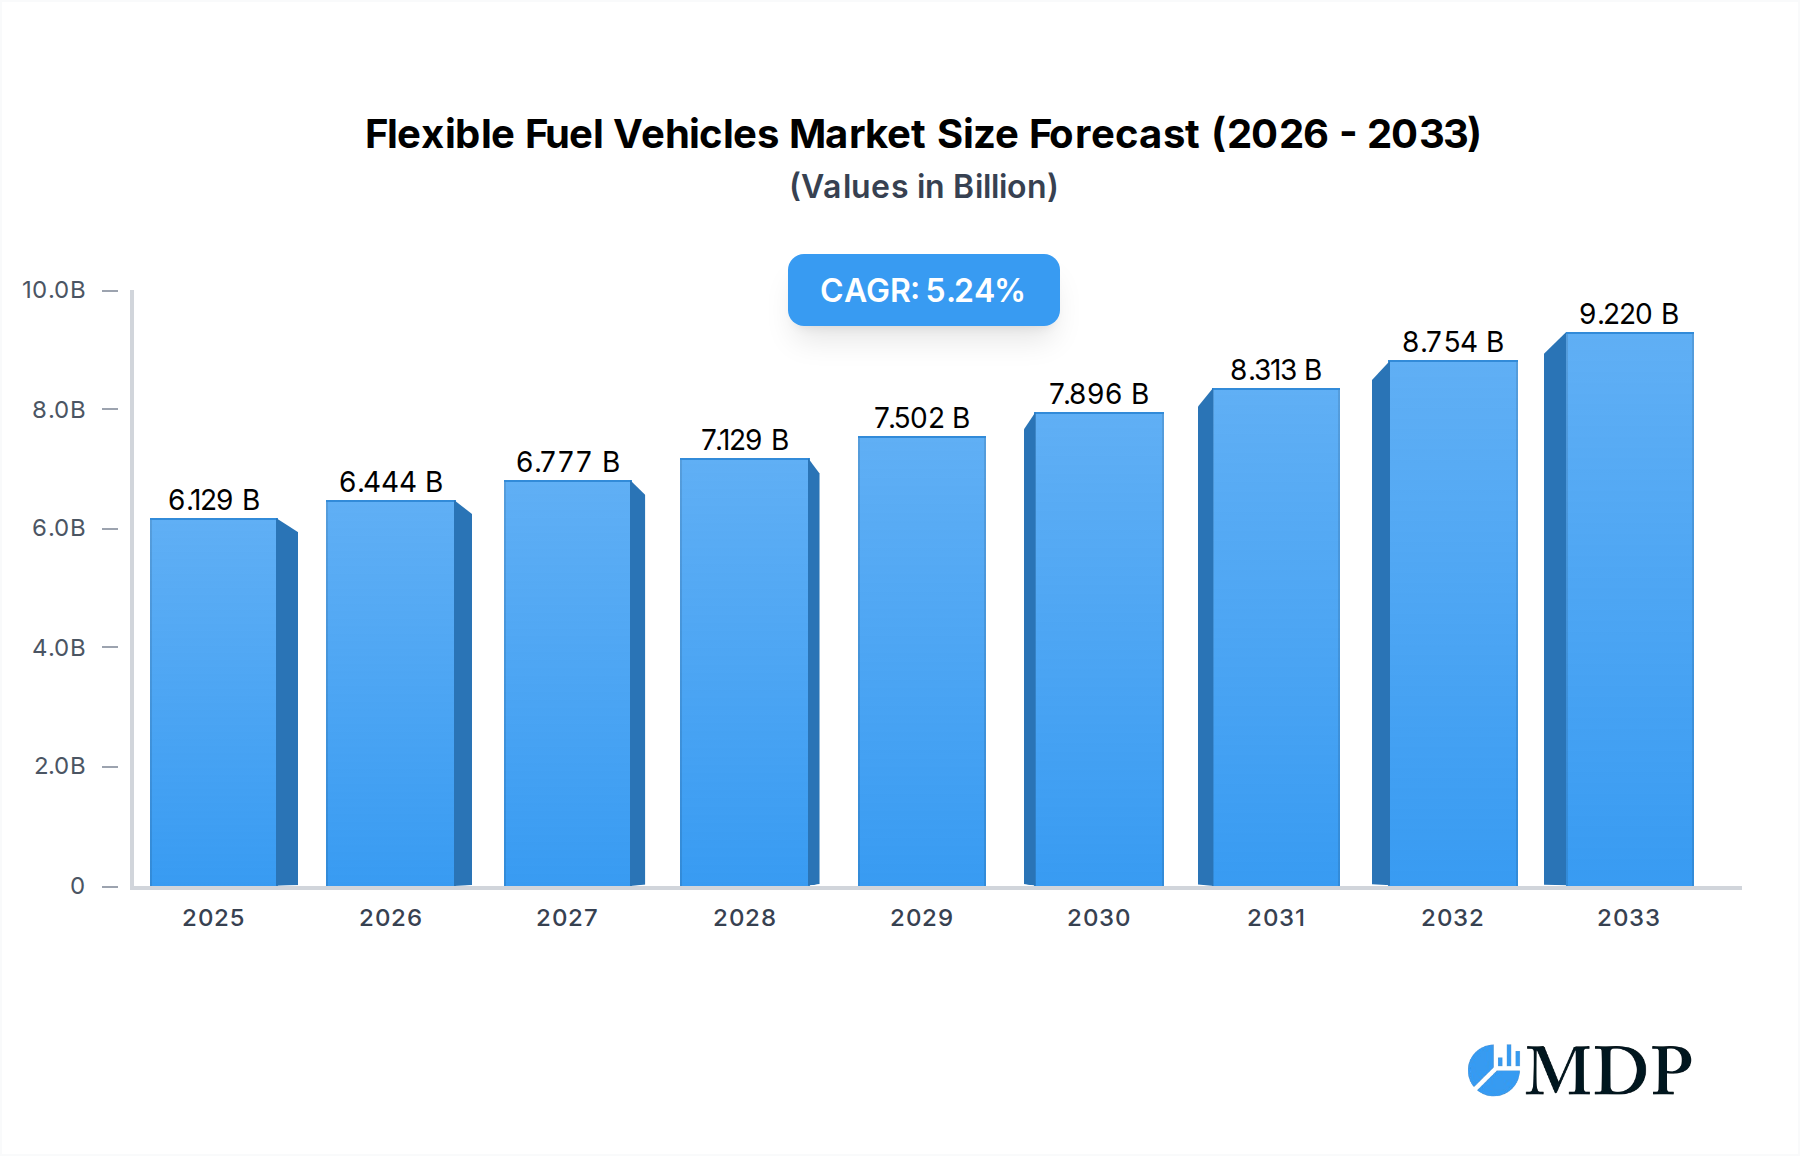
The global Flexible Fuel Vehicles (FFVs) market is poised for robust expansion, projected to reach an estimated USD 6,129 million by the end of 2025. This growth is fueled by an increasing consumer and regulatory push towards more sustainable transportation alternatives. The market is expected to witness a Compound Annual Growth Rate (CAGR) of 5.2% over the forecast period of 2025-2033, indicating a steady and significant upward trajectory. Key drivers for this expansion include government incentives promoting the adoption of alternative fuel vehicles, rising fuel prices that make the cost-effectiveness of flexible fuel options more attractive, and growing environmental consciousness among consumers. The inherent advantage of FFVs, allowing them to run on a blend of gasoline and ethanol, offers greater flexibility and resilience against fluctuating fossil fuel supplies, further bolstering their appeal. This adaptability positions FFVs as a crucial component in the transition towards a greener automotive landscape.

Flexible Fuel Vehicles Market Size (In Billion)
The FFV market segmentation reveals diverse opportunities. The application segment is broadly divided between Passenger Vehicles and Commercial Vehicles, with passenger cars likely dominating in terms of volume due to widespread consumer adoption. On the type front, the market spans from lower ethanol blends like E10 to E25, up to higher blends such as E25 to E85 and E85 and above. The increasing availability and acceptance of higher ethanol blends, particularly in regions with strong biofuel production, will likely drive the growth of these segments. Geographically, North America and Europe are anticipated to be leading markets, driven by supportive government policies and established biofuel infrastructure. Asia Pacific, especially China and India, presents a significant growth opportunity due to rapid industrialization and a growing focus on reducing carbon emissions. Major automotive manufacturers such as General Motors, Ford Motor Company, and Toyota Motor Corporation are actively investing in FFV technology, indicating strong industry commitment to this evolving market.
Flexible Fuel Vehicles Company Market Share
Flexible Fuel Vehicles (FFVs) Market: A Comprehensive Industry Analysis (2019–2033)
This in-depth report offers a definitive analysis of the global Flexible Fuel Vehicles (FFVs) market, covering the historical period from 2019 to 2024, the base and estimated year of 2025, and a comprehensive forecast period from 2025 to 2033. Leveraging high-traffic keywords such as "flexible fuel vehicles," "FFV market," "biofuel vehicles," "ethanol vehicles," and "alternative fuel cars," this report targets industry stakeholders, investors, policymakers, and automotive manufacturers seeking actionable insights into this rapidly evolving sector. Discover critical market dynamics, technological advancements, leading players, and future growth trajectories for FFVs across passenger and commercial vehicle segments, and diverse fuel types (E10 to E25, E25 to E85, E85 and Above).
Flexible Fuel Vehicles Market Dynamics & Concentration
The flexible fuel vehicle market is characterized by a moderate concentration, with leading automotive manufacturers actively investing in and promoting FFV technology. Innovation drivers are primarily fueled by government mandates for renewable fuels, increasing environmental consciousness among consumers, and the pursuit of greater energy independence. Regulatory frameworks, particularly in regions like Brazil and the United States, play a pivotal role in shaping FFV adoption rates. Product substitutes include battery electric vehicles (BEVs) and hybrid electric vehicles (HEVs), which are gaining significant traction, posing a competitive challenge. End-user trends lean towards a desire for fuel flexibility and reduced emissions, with a growing segment of consumers seeking vehicles that can utilize readily available biofuels. Mergers and acquisitions (M&A) activities are present, though not as pronounced as in other automotive segments, reflecting a focus on organic growth and strategic partnerships. The market share of FFVs, while growing, remains a fraction of the overall automotive market, estimated at approximately 15 million units globally in 2025. M&A deal counts have been around 5 to 8 significant transactions annually over the historical period, primarily focused on technology acquisition and supply chain integration.
Flexible Fuel Vehicles Industry Trends & Analysis
The flexible fuel vehicle industry is experiencing robust growth, driven by a confluence of technological advancements, supportive government policies, and shifting consumer preferences. The compound annual growth rate (CAGR) for FFVs is projected to be around 7.5% over the forecast period (2025–2033), indicating a sustained upward trajectory. Market penetration, while still in its nascent stages in many developed economies, is steadily increasing, with an estimated 18 million FFVs on the road by 2025, projected to reach over 30 million by 2033. Key growth drivers include the increasing availability and affordability of biofuels, such as ethanol and biodiesel, coupled with the development of more efficient and robust FFV powertrain technologies. Technological disruptions are evident in the enhanced fuel injection systems, advanced engine management software, and improved material science for fuel system components, ensuring compatibility with a wider range of fuel blends. Consumer preferences are evolving to favor vehicles that offer greater fuel choice, potentially lower running costs with biofuel blends, and a reduced carbon footprint. The competitive landscape is characterized by a mix of established automotive giants and emerging players, all vying for market share through product innovation and strategic collaborations. The inherent advantage of FFVs lies in their ability to operate on both conventional gasoline and various biofuel blends, offering consumers a practical and immediate solution for reducing their reliance on fossil fuels without requiring extensive changes to refueling infrastructure. The global market for flexible fuel vehicles is anticipated to reach a value of approximately $250 billion by 2025, with significant growth projected in the upcoming years.
Leading Markets & Segments in Flexible Fuel Vehicles
The passenger vehicle segment is the dominant force within the flexible fuel vehicle market, accounting for an estimated 80% of total sales in 2025, with a projected value of $200 million. Within this segment, the E25 to E85 fuel type is experiencing the most significant demand, driven by the widespread availability and cost-effectiveness of ethanol blends in key markets. Brazil stands out as a leading country, with FFVs representing over 90% of new passenger vehicle sales, largely attributed to its long-standing government support for sugarcane-based ethanol and a well-established biofuel infrastructure. In North America, particularly the United States, the E10 to E25 segment is steadily gaining traction due to mandates for renewable fuel content in gasoline.
- Key Drivers in Passenger Vehicles:
- Economic Policies: Government incentives, tax credits, and subsidies for biofuel production and FFV adoption.
- Infrastructure Development: Growing availability of refueling stations for various biofuel blends, especially in key agricultural regions.
- Consumer Demand: Increasing environmental awareness and desire for fuel cost savings.
- Manufacturer Support: Dedicated product lines and marketing efforts by major automakers.
The commercial vehicle segment, while smaller, is also showing promising growth, driven by fleet operators seeking to reduce operational costs and meet corporate sustainability goals. The demand for E85 and Above fuel types is particularly strong in this segment, especially for heavy-duty applications where higher ethanol blends can offer performance benefits.
- Dominance Analysis: Brazil's established biofuel ecosystem provides a strong foundation for FFV dominance in the passenger vehicle market. The consistent policy support and consumer acceptance have created a self-reinforcing cycle of production, distribution, and demand. The growth in the E25 to E85 segment is a direct consequence of this established infrastructure and the cost advantages associated with higher ethanol blends.
Flexible Fuel Vehicles Product Developments
Recent product developments in the flexible fuel vehicle sector are focused on enhancing fuel efficiency, expanding the range of compatible fuel blends, and improving the overall driving experience. Innovations in engine management systems allow for seamless transition between gasoline and various biofuel concentrations, optimizing performance and emissions. Manufacturers are also introducing more durable and corrosion-resistant materials for fuel system components to ensure long-term reliability with higher ethanol content. These advancements not only cater to evolving consumer preferences for sustainable mobility but also reinforce the competitive advantage of FFVs as a practical and accessible alternative to purely fossil fuel-dependent vehicles, with an estimated market value of $10 million in innovations.
Key Drivers of Flexible Fuel Vehicles Growth
The growth of the flexible fuel vehicle market is propelled by several interconnected factors. Technological advancements in engine efficiency and biofuel compatibility are making FFVs more appealing. Economic factors, such as volatile oil prices and the increasing affordability of biofuels, create a strong incentive for consumers and businesses. Regulatory frameworks worldwide, mandating increased biofuel content in transportation fuels, directly support FFV adoption. For example, the Renewable Fuel Standard in the United States and Brazil's RenovaBio program are significant accelerators. The estimated market size for FFVs in terms of vehicle sales is projected to reach over $200 million annually by 2025.
Challenges in the Flexible Fuel Vehicles Market
Despite the promising outlook, the flexible fuel vehicle market faces several challenges. Regulatory hurdles in some regions, particularly regarding the standardization of biofuel blends and infrastructure development, can hinder widespread adoption. Supply chain issues for certain biofuel feedstocks can impact availability and cost. Competitive pressures from other alternative fuel technologies, such as battery electric vehicles, which are experiencing rapid technological advancements and increasing consumer acceptance, pose a significant restraint. The limited availability of FFVs in certain global markets also presents a challenge, with an estimated market impact of $5 million due to these restraints.
Emerging Opportunities in Flexible Fuel Vehicles
Emerging opportunities for flexible fuel vehicles lie in the continuous development of advanced biofuel technologies, such as cellulosic ethanol derived from non-food sources, which can enhance sustainability and reduce land-use competition. Strategic partnerships between automakers, biofuel producers, and energy companies can foster greater infrastructure development and consumer education. Market expansion into developing economies, where fuel costs and energy security are critical concerns, presents a significant growth catalyst. Technological breakthroughs in areas like adaptive engine control systems for optimal performance across diverse fuel blends are also key to unlocking future potential, with an estimated $8 million in untapped opportunities.
Leading Players in the Flexible Fuel Vehicles Sector
- General Motors
- Ford Motor Company
- Toyota Motor Corporation
- Stellantis NV
- Honda Motor Company
- Hyundai Motor Company
- Nissan Motor Company
- Subaru Corporation
- Volkswagen AG
- BMW AG
- Volvo Car Corporation
Key Milestones in Flexible Fuel Vehicles Industry
- 2019: Increased government mandates for biofuel blending in gasoline across multiple countries.
- 2020: Significant advancements in engine control units (ECUs) for seamless fuel blend recognition.
- 2021: Launch of new FFV models by major automakers with improved fuel economy ratings.
- 2022: Growing investment in cellulosic ethanol production technologies.
- 2023: Expansion of FFV refueling infrastructure in emerging markets.
- 2024: Introduction of advanced FFV powertrains offering enhanced performance and emissions control.
Strategic Outlook for Flexible Fuel Vehicles Market
The strategic outlook for the flexible fuel vehicle market remains positive, driven by the ongoing global transition towards sustainable transportation solutions. Growth accelerators include the increasing focus on domestic energy production, the cost-effectiveness of biofuels compared to traditional gasoline, and the established infrastructure in key markets. Opportunities for manufacturers lie in expanding their FFV portfolios, innovating in biofuel compatibility, and collaborating to build out robust refueling networks. The market is poised for continued expansion, with an estimated growth potential of $50 million in strategic opportunities over the next decade.
Flexible Fuel Vehicles Segmentation
-
1. Application
- 1.1. Passenger Vehicle
- 1.2. Commercial Vehicle
-
2. Type
- 2.1. E10 to E25
- 2.2. E25 to E85
- 2.3. E85 and Above
Flexible Fuel Vehicles Segmentation By Geography
-
1. North America
- 1.1. United States
- 1.2. Canada
- 1.3. Mexico
-
2. South America
- 2.1. Brazil
- 2.2. Argentina
- 2.3. Rest of South America
-
3. Europe
- 3.1. United Kingdom
- 3.2. Germany
- 3.3. France
- 3.4. Italy
- 3.5. Spain
- 3.6. Russia
- 3.7. Benelux
- 3.8. Nordics
- 3.9. Rest of Europe
-
4. Middle East & Africa
- 4.1. Turkey
- 4.2. Israel
- 4.3. GCC
- 4.4. North Africa
- 4.5. South Africa
- 4.6. Rest of Middle East & Africa
-
5. Asia Pacific
- 5.1. China
- 5.2. India
- 5.3. Japan
- 5.4. South Korea
- 5.5. ASEAN
- 5.6. Oceania
- 5.7. Rest of Asia Pacific
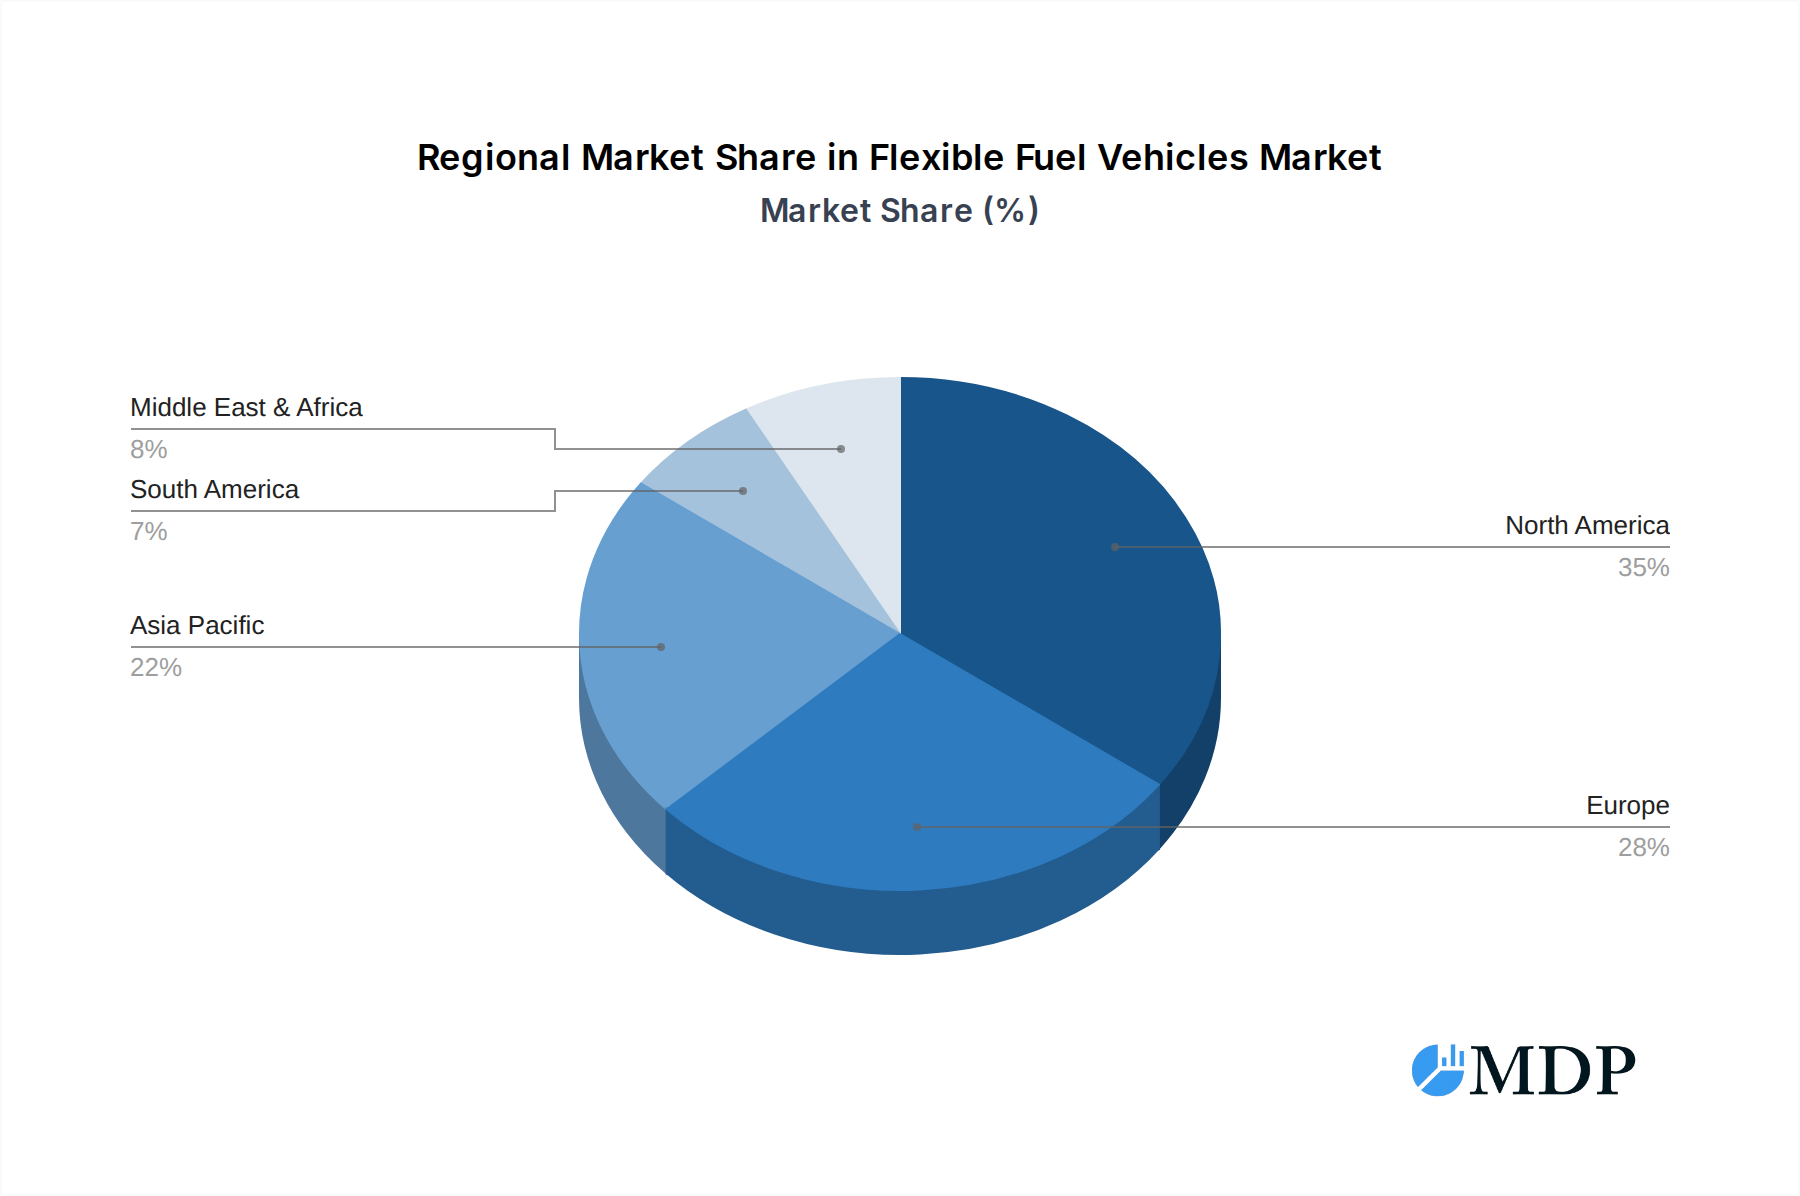
Flexible Fuel Vehicles Regional Market Share
Geographic Coverage of Flexible Fuel Vehicles
Flexible Fuel Vehicles REPORT HIGHLIGHTS
| Aspects | Details |
|---|---|
| Study Period | 2020-2034 |
| Base Year | 2025 |
| Estimated Year | 2026 |
| Forecast Period | 2026-2034 |
| Historical Period | 2020-2025 |
| Growth Rate | CAGR of 5.2% from 2020-2034 |
| Segmentation |
|
Table of Contents
- 1. Introduction
- 1.1. Research Scope
- 1.2. Market Segmentation
- 1.3. Research Methodology
- 1.4. Definitions and Assumptions
- 2. Executive Summary
- 2.1. Introduction
- 3. Market Dynamics
- 3.1. Introduction
- 3.2. Market Drivers
- 3.3. Market Restrains
- 3.4. Market Trends
- 4. Market Factor Analysis
- 4.1. Porters Five Forces
- 4.2. Supply/Value Chain
- 4.3. PESTEL analysis
- 4.4. Market Entropy
- 4.5. Patent/Trademark Analysis
- 5. Global Flexible Fuel Vehicles Analysis, Insights and Forecast, 2020-2032
- 5.1. Market Analysis, Insights and Forecast - by Application
- 5.1.1. Passenger Vehicle
- 5.1.2. Commercial Vehicle
- 5.2. Market Analysis, Insights and Forecast - by Type
- 5.2.1. E10 to E25
- 5.2.2. E25 to E85
- 5.2.3. E85 and Above
- 5.3. Market Analysis, Insights and Forecast - by Region
- 5.3.1. North America
- 5.3.2. South America
- 5.3.3. Europe
- 5.3.4. Middle East & Africa
- 5.3.5. Asia Pacific
- 5.1. Market Analysis, Insights and Forecast - by Application
- 6. North America Flexible Fuel Vehicles Analysis, Insights and Forecast, 2020-2032
- 6.1. Market Analysis, Insights and Forecast - by Application
- 6.1.1. Passenger Vehicle
- 6.1.2. Commercial Vehicle
- 6.2. Market Analysis, Insights and Forecast - by Type
- 6.2.1. E10 to E25
- 6.2.2. E25 to E85
- 6.2.3. E85 and Above
- 6.1. Market Analysis, Insights and Forecast - by Application
- 7. South America Flexible Fuel Vehicles Analysis, Insights and Forecast, 2020-2032
- 7.1. Market Analysis, Insights and Forecast - by Application
- 7.1.1. Passenger Vehicle
- 7.1.2. Commercial Vehicle
- 7.2. Market Analysis, Insights and Forecast - by Type
- 7.2.1. E10 to E25
- 7.2.2. E25 to E85
- 7.2.3. E85 and Above
- 7.1. Market Analysis, Insights and Forecast - by Application
- 8. Europe Flexible Fuel Vehicles Analysis, Insights and Forecast, 2020-2032
- 8.1. Market Analysis, Insights and Forecast - by Application
- 8.1.1. Passenger Vehicle
- 8.1.2. Commercial Vehicle
- 8.2. Market Analysis, Insights and Forecast - by Type
- 8.2.1. E10 to E25
- 8.2.2. E25 to E85
- 8.2.3. E85 and Above
- 8.1. Market Analysis, Insights and Forecast - by Application
- 9. Middle East & Africa Flexible Fuel Vehicles Analysis, Insights and Forecast, 2020-2032
- 9.1. Market Analysis, Insights and Forecast - by Application
- 9.1.1. Passenger Vehicle
- 9.1.2. Commercial Vehicle
- 9.2. Market Analysis, Insights and Forecast - by Type
- 9.2.1. E10 to E25
- 9.2.2. E25 to E85
- 9.2.3. E85 and Above
- 9.1. Market Analysis, Insights and Forecast - by Application
- 10. Asia Pacific Flexible Fuel Vehicles Analysis, Insights and Forecast, 2020-2032
- 10.1. Market Analysis, Insights and Forecast - by Application
- 10.1.1. Passenger Vehicle
- 10.1.2. Commercial Vehicle
- 10.2. Market Analysis, Insights and Forecast - by Type
- 10.2.1. E10 to E25
- 10.2.2. E25 to E85
- 10.2.3. E85 and Above
- 10.1. Market Analysis, Insights and Forecast - by Application
- 11. Competitive Analysis
- 11.1. Global Market Share Analysis 2025
- 11.2. Company Profiles
- 11.2.1 General Motors
- 11.2.1.1. Overview
- 11.2.1.2. Products
- 11.2.1.3. SWOT Analysis
- 11.2.1.4. Recent Developments
- 11.2.1.5. Financials (Based on Availability)
- 11.2.2 Ford Motor Company
- 11.2.2.1. Overview
- 11.2.2.2. Products
- 11.2.2.3. SWOT Analysis
- 11.2.2.4. Recent Developments
- 11.2.2.5. Financials (Based on Availability)
- 11.2.3 Toyota Motor Corporation
- 11.2.3.1. Overview
- 11.2.3.2. Products
- 11.2.3.3. SWOT Analysis
- 11.2.3.4. Recent Developments
- 11.2.3.5. Financials (Based on Availability)
- 11.2.4 Stellantis NV
- 11.2.4.1. Overview
- 11.2.4.2. Products
- 11.2.4.3. SWOT Analysis
- 11.2.4.4. Recent Developments
- 11.2.4.5. Financials (Based on Availability)
- 11.2.5 Honda Motor Company
- 11.2.5.1. Overview
- 11.2.5.2. Products
- 11.2.5.3. SWOT Analysis
- 11.2.5.4. Recent Developments
- 11.2.5.5. Financials (Based on Availability)
- 11.2.6 Hyundai Motor Company
- 11.2.6.1. Overview
- 11.2.6.2. Products
- 11.2.6.3. SWOT Analysis
- 11.2.6.4. Recent Developments
- 11.2.6.5. Financials (Based on Availability)
- 11.2.7 Nissan Motor Company
- 11.2.7.1. Overview
- 11.2.7.2. Products
- 11.2.7.3. SWOT Analysis
- 11.2.7.4. Recent Developments
- 11.2.7.5. Financials (Based on Availability)
- 11.2.8 Subaru Corporation
- 11.2.8.1. Overview
- 11.2.8.2. Products
- 11.2.8.3. SWOT Analysis
- 11.2.8.4. Recent Developments
- 11.2.8.5. Financials (Based on Availability)
- 11.2.9 Volkswagen AG
- 11.2.9.1. Overview
- 11.2.9.2. Products
- 11.2.9.3. SWOT Analysis
- 11.2.9.4. Recent Developments
- 11.2.9.5. Financials (Based on Availability)
- 11.2.10 BMW AG
- 11.2.10.1. Overview
- 11.2.10.2. Products
- 11.2.10.3. SWOT Analysis
- 11.2.10.4. Recent Developments
- 11.2.10.5. Financials (Based on Availability)
- 11.2.11 Volvo Car Corporation
- 11.2.11.1. Overview
- 11.2.11.2. Products
- 11.2.11.3. SWOT Analysis
- 11.2.11.4. Recent Developments
- 11.2.11.5. Financials (Based on Availability)
- 11.2.1 General Motors
List of Figures
- Figure 1: Global Flexible Fuel Vehicles Revenue Breakdown (million, %) by Region 2025 & 2033
- Figure 2: Global Flexible Fuel Vehicles Volume Breakdown (K, %) by Region 2025 & 2033
- Figure 3: North America Flexible Fuel Vehicles Revenue (million), by Application 2025 & 2033
- Figure 4: North America Flexible Fuel Vehicles Volume (K), by Application 2025 & 2033
- Figure 5: North America Flexible Fuel Vehicles Revenue Share (%), by Application 2025 & 2033
- Figure 6: North America Flexible Fuel Vehicles Volume Share (%), by Application 2025 & 2033
- Figure 7: North America Flexible Fuel Vehicles Revenue (million), by Type 2025 & 2033
- Figure 8: North America Flexible Fuel Vehicles Volume (K), by Type 2025 & 2033
- Figure 9: North America Flexible Fuel Vehicles Revenue Share (%), by Type 2025 & 2033
- Figure 10: North America Flexible Fuel Vehicles Volume Share (%), by Type 2025 & 2033
- Figure 11: North America Flexible Fuel Vehicles Revenue (million), by Country 2025 & 2033
- Figure 12: North America Flexible Fuel Vehicles Volume (K), by Country 2025 & 2033
- Figure 13: North America Flexible Fuel Vehicles Revenue Share (%), by Country 2025 & 2033
- Figure 14: North America Flexible Fuel Vehicles Volume Share (%), by Country 2025 & 2033
- Figure 15: South America Flexible Fuel Vehicles Revenue (million), by Application 2025 & 2033
- Figure 16: South America Flexible Fuel Vehicles Volume (K), by Application 2025 & 2033
- Figure 17: South America Flexible Fuel Vehicles Revenue Share (%), by Application 2025 & 2033
- Figure 18: South America Flexible Fuel Vehicles Volume Share (%), by Application 2025 & 2033
- Figure 19: South America Flexible Fuel Vehicles Revenue (million), by Type 2025 & 2033
- Figure 20: South America Flexible Fuel Vehicles Volume (K), by Type 2025 & 2033
- Figure 21: South America Flexible Fuel Vehicles Revenue Share (%), by Type 2025 & 2033
- Figure 22: South America Flexible Fuel Vehicles Volume Share (%), by Type 2025 & 2033
- Figure 23: South America Flexible Fuel Vehicles Revenue (million), by Country 2025 & 2033
- Figure 24: South America Flexible Fuel Vehicles Volume (K), by Country 2025 & 2033
- Figure 25: South America Flexible Fuel Vehicles Revenue Share (%), by Country 2025 & 2033
- Figure 26: South America Flexible Fuel Vehicles Volume Share (%), by Country 2025 & 2033
- Figure 27: Europe Flexible Fuel Vehicles Revenue (million), by Application 2025 & 2033
- Figure 28: Europe Flexible Fuel Vehicles Volume (K), by Application 2025 & 2033
- Figure 29: Europe Flexible Fuel Vehicles Revenue Share (%), by Application 2025 & 2033
- Figure 30: Europe Flexible Fuel Vehicles Volume Share (%), by Application 2025 & 2033
- Figure 31: Europe Flexible Fuel Vehicles Revenue (million), by Type 2025 & 2033
- Figure 32: Europe Flexible Fuel Vehicles Volume (K), by Type 2025 & 2033
- Figure 33: Europe Flexible Fuel Vehicles Revenue Share (%), by Type 2025 & 2033
- Figure 34: Europe Flexible Fuel Vehicles Volume Share (%), by Type 2025 & 2033
- Figure 35: Europe Flexible Fuel Vehicles Revenue (million), by Country 2025 & 2033
- Figure 36: Europe Flexible Fuel Vehicles Volume (K), by Country 2025 & 2033
- Figure 37: Europe Flexible Fuel Vehicles Revenue Share (%), by Country 2025 & 2033
- Figure 38: Europe Flexible Fuel Vehicles Volume Share (%), by Country 2025 & 2033
- Figure 39: Middle East & Africa Flexible Fuel Vehicles Revenue (million), by Application 2025 & 2033
- Figure 40: Middle East & Africa Flexible Fuel Vehicles Volume (K), by Application 2025 & 2033
- Figure 41: Middle East & Africa Flexible Fuel Vehicles Revenue Share (%), by Application 2025 & 2033
- Figure 42: Middle East & Africa Flexible Fuel Vehicles Volume Share (%), by Application 2025 & 2033
- Figure 43: Middle East & Africa Flexible Fuel Vehicles Revenue (million), by Type 2025 & 2033
- Figure 44: Middle East & Africa Flexible Fuel Vehicles Volume (K), by Type 2025 & 2033
- Figure 45: Middle East & Africa Flexible Fuel Vehicles Revenue Share (%), by Type 2025 & 2033
- Figure 46: Middle East & Africa Flexible Fuel Vehicles Volume Share (%), by Type 2025 & 2033
- Figure 47: Middle East & Africa Flexible Fuel Vehicles Revenue (million), by Country 2025 & 2033
- Figure 48: Middle East & Africa Flexible Fuel Vehicles Volume (K), by Country 2025 & 2033
- Figure 49: Middle East & Africa Flexible Fuel Vehicles Revenue Share (%), by Country 2025 & 2033
- Figure 50: Middle East & Africa Flexible Fuel Vehicles Volume Share (%), by Country 2025 & 2033
- Figure 51: Asia Pacific Flexible Fuel Vehicles Revenue (million), by Application 2025 & 2033
- Figure 52: Asia Pacific Flexible Fuel Vehicles Volume (K), by Application 2025 & 2033
- Figure 53: Asia Pacific Flexible Fuel Vehicles Revenue Share (%), by Application 2025 & 2033
- Figure 54: Asia Pacific Flexible Fuel Vehicles Volume Share (%), by Application 2025 & 2033
- Figure 55: Asia Pacific Flexible Fuel Vehicles Revenue (million), by Type 2025 & 2033
- Figure 56: Asia Pacific Flexible Fuel Vehicles Volume (K), by Type 2025 & 2033
- Figure 57: Asia Pacific Flexible Fuel Vehicles Revenue Share (%), by Type 2025 & 2033
- Figure 58: Asia Pacific Flexible Fuel Vehicles Volume Share (%), by Type 2025 & 2033
- Figure 59: Asia Pacific Flexible Fuel Vehicles Revenue (million), by Country 2025 & 2033
- Figure 60: Asia Pacific Flexible Fuel Vehicles Volume (K), by Country 2025 & 2033
- Figure 61: Asia Pacific Flexible Fuel Vehicles Revenue Share (%), by Country 2025 & 2033
- Figure 62: Asia Pacific Flexible Fuel Vehicles Volume Share (%), by Country 2025 & 2033
List of Tables
- Table 1: Global Flexible Fuel Vehicles Revenue million Forecast, by Application 2020 & 2033
- Table 2: Global Flexible Fuel Vehicles Volume K Forecast, by Application 2020 & 2033
- Table 3: Global Flexible Fuel Vehicles Revenue million Forecast, by Type 2020 & 2033
- Table 4: Global Flexible Fuel Vehicles Volume K Forecast, by Type 2020 & 2033
- Table 5: Global Flexible Fuel Vehicles Revenue million Forecast, by Region 2020 & 2033
- Table 6: Global Flexible Fuel Vehicles Volume K Forecast, by Region 2020 & 2033
- Table 7: Global Flexible Fuel Vehicles Revenue million Forecast, by Application 2020 & 2033
- Table 8: Global Flexible Fuel Vehicles Volume K Forecast, by Application 2020 & 2033
- Table 9: Global Flexible Fuel Vehicles Revenue million Forecast, by Type 2020 & 2033
- Table 10: Global Flexible Fuel Vehicles Volume K Forecast, by Type 2020 & 2033
- Table 11: Global Flexible Fuel Vehicles Revenue million Forecast, by Country 2020 & 2033
- Table 12: Global Flexible Fuel Vehicles Volume K Forecast, by Country 2020 & 2033
- Table 13: United States Flexible Fuel Vehicles Revenue (million) Forecast, by Application 2020 & 2033
- Table 14: United States Flexible Fuel Vehicles Volume (K) Forecast, by Application 2020 & 2033
- Table 15: Canada Flexible Fuel Vehicles Revenue (million) Forecast, by Application 2020 & 2033
- Table 16: Canada Flexible Fuel Vehicles Volume (K) Forecast, by Application 2020 & 2033
- Table 17: Mexico Flexible Fuel Vehicles Revenue (million) Forecast, by Application 2020 & 2033
- Table 18: Mexico Flexible Fuel Vehicles Volume (K) Forecast, by Application 2020 & 2033
- Table 19: Global Flexible Fuel Vehicles Revenue million Forecast, by Application 2020 & 2033
- Table 20: Global Flexible Fuel Vehicles Volume K Forecast, by Application 2020 & 2033
- Table 21: Global Flexible Fuel Vehicles Revenue million Forecast, by Type 2020 & 2033
- Table 22: Global Flexible Fuel Vehicles Volume K Forecast, by Type 2020 & 2033
- Table 23: Global Flexible Fuel Vehicles Revenue million Forecast, by Country 2020 & 2033
- Table 24: Global Flexible Fuel Vehicles Volume K Forecast, by Country 2020 & 2033
- Table 25: Brazil Flexible Fuel Vehicles Revenue (million) Forecast, by Application 2020 & 2033
- Table 26: Brazil Flexible Fuel Vehicles Volume (K) Forecast, by Application 2020 & 2033
- Table 27: Argentina Flexible Fuel Vehicles Revenue (million) Forecast, by Application 2020 & 2033
- Table 28: Argentina Flexible Fuel Vehicles Volume (K) Forecast, by Application 2020 & 2033
- Table 29: Rest of South America Flexible Fuel Vehicles Revenue (million) Forecast, by Application 2020 & 2033
- Table 30: Rest of South America Flexible Fuel Vehicles Volume (K) Forecast, by Application 2020 & 2033
- Table 31: Global Flexible Fuel Vehicles Revenue million Forecast, by Application 2020 & 2033
- Table 32: Global Flexible Fuel Vehicles Volume K Forecast, by Application 2020 & 2033
- Table 33: Global Flexible Fuel Vehicles Revenue million Forecast, by Type 2020 & 2033
- Table 34: Global Flexible Fuel Vehicles Volume K Forecast, by Type 2020 & 2033
- Table 35: Global Flexible Fuel Vehicles Revenue million Forecast, by Country 2020 & 2033
- Table 36: Global Flexible Fuel Vehicles Volume K Forecast, by Country 2020 & 2033
- Table 37: United Kingdom Flexible Fuel Vehicles Revenue (million) Forecast, by Application 2020 & 2033
- Table 38: United Kingdom Flexible Fuel Vehicles Volume (K) Forecast, by Application 2020 & 2033
- Table 39: Germany Flexible Fuel Vehicles Revenue (million) Forecast, by Application 2020 & 2033
- Table 40: Germany Flexible Fuel Vehicles Volume (K) Forecast, by Application 2020 & 2033
- Table 41: France Flexible Fuel Vehicles Revenue (million) Forecast, by Application 2020 & 2033
- Table 42: France Flexible Fuel Vehicles Volume (K) Forecast, by Application 2020 & 2033
- Table 43: Italy Flexible Fuel Vehicles Revenue (million) Forecast, by Application 2020 & 2033
- Table 44: Italy Flexible Fuel Vehicles Volume (K) Forecast, by Application 2020 & 2033
- Table 45: Spain Flexible Fuel Vehicles Revenue (million) Forecast, by Application 2020 & 2033
- Table 46: Spain Flexible Fuel Vehicles Volume (K) Forecast, by Application 2020 & 2033
- Table 47: Russia Flexible Fuel Vehicles Revenue (million) Forecast, by Application 2020 & 2033
- Table 48: Russia Flexible Fuel Vehicles Volume (K) Forecast, by Application 2020 & 2033
- Table 49: Benelux Flexible Fuel Vehicles Revenue (million) Forecast, by Application 2020 & 2033
- Table 50: Benelux Flexible Fuel Vehicles Volume (K) Forecast, by Application 2020 & 2033
- Table 51: Nordics Flexible Fuel Vehicles Revenue (million) Forecast, by Application 2020 & 2033
- Table 52: Nordics Flexible Fuel Vehicles Volume (K) Forecast, by Application 2020 & 2033
- Table 53: Rest of Europe Flexible Fuel Vehicles Revenue (million) Forecast, by Application 2020 & 2033
- Table 54: Rest of Europe Flexible Fuel Vehicles Volume (K) Forecast, by Application 2020 & 2033
- Table 55: Global Flexible Fuel Vehicles Revenue million Forecast, by Application 2020 & 2033
- Table 56: Global Flexible Fuel Vehicles Volume K Forecast, by Application 2020 & 2033
- Table 57: Global Flexible Fuel Vehicles Revenue million Forecast, by Type 2020 & 2033
- Table 58: Global Flexible Fuel Vehicles Volume K Forecast, by Type 2020 & 2033
- Table 59: Global Flexible Fuel Vehicles Revenue million Forecast, by Country 2020 & 2033
- Table 60: Global Flexible Fuel Vehicles Volume K Forecast, by Country 2020 & 2033
- Table 61: Turkey Flexible Fuel Vehicles Revenue (million) Forecast, by Application 2020 & 2033
- Table 62: Turkey Flexible Fuel Vehicles Volume (K) Forecast, by Application 2020 & 2033
- Table 63: Israel Flexible Fuel Vehicles Revenue (million) Forecast, by Application 2020 & 2033
- Table 64: Israel Flexible Fuel Vehicles Volume (K) Forecast, by Application 2020 & 2033
- Table 65: GCC Flexible Fuel Vehicles Revenue (million) Forecast, by Application 2020 & 2033
- Table 66: GCC Flexible Fuel Vehicles Volume (K) Forecast, by Application 2020 & 2033
- Table 67: North Africa Flexible Fuel Vehicles Revenue (million) Forecast, by Application 2020 & 2033
- Table 68: North Africa Flexible Fuel Vehicles Volume (K) Forecast, by Application 2020 & 2033
- Table 69: South Africa Flexible Fuel Vehicles Revenue (million) Forecast, by Application 2020 & 2033
- Table 70: South Africa Flexible Fuel Vehicles Volume (K) Forecast, by Application 2020 & 2033
- Table 71: Rest of Middle East & Africa Flexible Fuel Vehicles Revenue (million) Forecast, by Application 2020 & 2033
- Table 72: Rest of Middle East & Africa Flexible Fuel Vehicles Volume (K) Forecast, by Application 2020 & 2033
- Table 73: Global Flexible Fuel Vehicles Revenue million Forecast, by Application 2020 & 2033
- Table 74: Global Flexible Fuel Vehicles Volume K Forecast, by Application 2020 & 2033
- Table 75: Global Flexible Fuel Vehicles Revenue million Forecast, by Type 2020 & 2033
- Table 76: Global Flexible Fuel Vehicles Volume K Forecast, by Type 2020 & 2033
- Table 77: Global Flexible Fuel Vehicles Revenue million Forecast, by Country 2020 & 2033
- Table 78: Global Flexible Fuel Vehicles Volume K Forecast, by Country 2020 & 2033
- Table 79: China Flexible Fuel Vehicles Revenue (million) Forecast, by Application 2020 & 2033
- Table 80: China Flexible Fuel Vehicles Volume (K) Forecast, by Application 2020 & 2033
- Table 81: India Flexible Fuel Vehicles Revenue (million) Forecast, by Application 2020 & 2033
- Table 82: India Flexible Fuel Vehicles Volume (K) Forecast, by Application 2020 & 2033
- Table 83: Japan Flexible Fuel Vehicles Revenue (million) Forecast, by Application 2020 & 2033
- Table 84: Japan Flexible Fuel Vehicles Volume (K) Forecast, by Application 2020 & 2033
- Table 85: South Korea Flexible Fuel Vehicles Revenue (million) Forecast, by Application 2020 & 2033
- Table 86: South Korea Flexible Fuel Vehicles Volume (K) Forecast, by Application 2020 & 2033
- Table 87: ASEAN Flexible Fuel Vehicles Revenue (million) Forecast, by Application 2020 & 2033
- Table 88: ASEAN Flexible Fuel Vehicles Volume (K) Forecast, by Application 2020 & 2033
- Table 89: Oceania Flexible Fuel Vehicles Revenue (million) Forecast, by Application 2020 & 2033
- Table 90: Oceania Flexible Fuel Vehicles Volume (K) Forecast, by Application 2020 & 2033
- Table 91: Rest of Asia Pacific Flexible Fuel Vehicles Revenue (million) Forecast, by Application 2020 & 2033
- Table 92: Rest of Asia Pacific Flexible Fuel Vehicles Volume (K) Forecast, by Application 2020 & 2033
Frequently Asked Questions
1. What is the projected Compound Annual Growth Rate (CAGR) of the Flexible Fuel Vehicles?
The projected CAGR is approximately 5.2%.
2. Which companies are prominent players in the Flexible Fuel Vehicles?
Key companies in the market include General Motors, Ford Motor Company, Toyota Motor Corporation, Stellantis NV, Honda Motor Company, Hyundai Motor Company, Nissan Motor Company, Subaru Corporation, Volkswagen AG, BMW AG, Volvo Car Corporation.
3. What are the main segments of the Flexible Fuel Vehicles?
The market segments include Application, Type.
4. Can you provide details about the market size?
The market size is estimated to be USD 6129 million as of 2022.
5. What are some drivers contributing to market growth?
N/A
6. What are the notable trends driving market growth?
N/A
7. Are there any restraints impacting market growth?
N/A
8. Can you provide examples of recent developments in the market?
N/A
9. What pricing options are available for accessing the report?
Pricing options include single-user, multi-user, and enterprise licenses priced at USD 3950.00, USD 5925.00, and USD 7900.00 respectively.
10. Is the market size provided in terms of value or volume?
The market size is provided in terms of value, measured in million and volume, measured in K.
11. Are there any specific market keywords associated with the report?
Yes, the market keyword associated with the report is "Flexible Fuel Vehicles," which aids in identifying and referencing the specific market segment covered.
12. How do I determine which pricing option suits my needs best?
The pricing options vary based on user requirements and access needs. Individual users may opt for single-user licenses, while businesses requiring broader access may choose multi-user or enterprise licenses for cost-effective access to the report.
13. Are there any additional resources or data provided in the Flexible Fuel Vehicles report?
While the report offers comprehensive insights, it's advisable to review the specific contents or supplementary materials provided to ascertain if additional resources or data are available.
14. How can I stay updated on further developments or reports in the Flexible Fuel Vehicles?
To stay informed about further developments, trends, and reports in the Flexible Fuel Vehicles, consider subscribing to industry newsletters, following relevant companies and organizations, or regularly checking reputable industry news sources and publications.
Methodology
Step 1 - Identification of Relevant Samples Size from Population Database


Step 2 - Approaches for Defining Global Market Size (Value, Volume* & Price*)

Note*: In applicable scenarios
Step 3 - Data Sources
Primary Research
- Web Analytics
- Survey Reports
- Research Institute
- Latest Research Reports
- Opinion Leaders
Secondary Research
- Annual Reports
- White Paper
- Latest Press Release
- Industry Association
- Paid Database
- Investor Presentations

Step 4 - Data Triangulation
Involves using different sources of information in order to increase the validity of a study
These sources are likely to be stakeholders in a program - participants, other researchers, program staff, other community members, and so on.
Then we put all data in single framework & apply various statistical tools to find out the dynamic on the market.
During the analysis stage, feedback from the stakeholder groups would be compared to determine areas of agreement as well as areas of divergence