

Key Insights
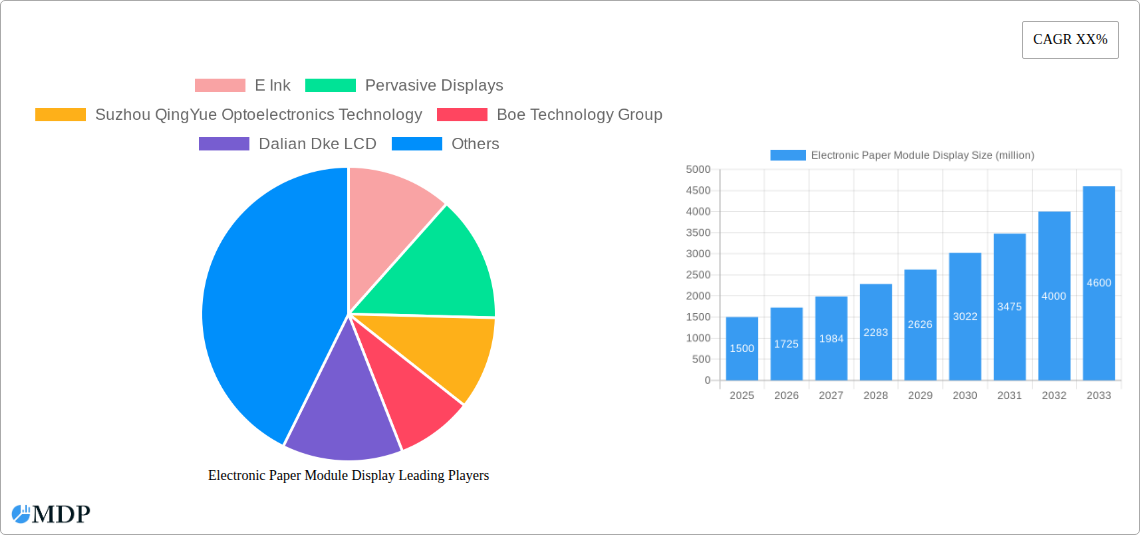
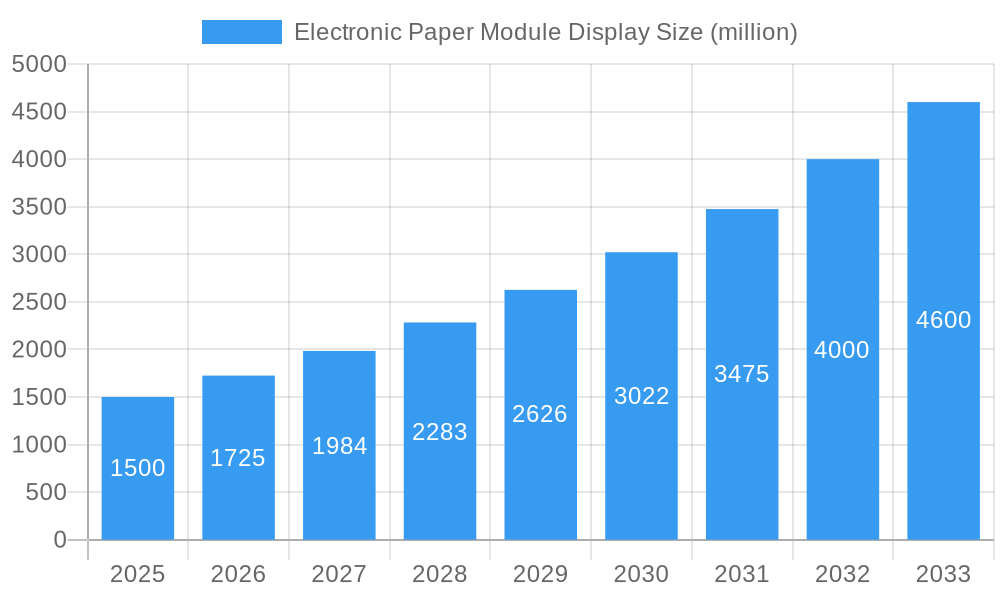
The Electronic Paper Display (EPD) module market is experiencing robust growth, driven by the increasing demand for low-power, sunlight-readable displays across diverse applications. The market, estimated at $1.5 billion in 2025, is projected to expand at a Compound Annual Growth Rate (CAGR) of 15% from 2025 to 2033, reaching approximately $5 billion by 2033. Key drivers include the rising adoption of e-readers, the expanding retail signage market seeking energy-efficient solutions, and the growing popularity of electronic shelf labels (ESLs) in supermarkets and retail stores. Further fueling this growth is the increasing demand for electronic badges and signage in various sectors, such as healthcare and transportation. The segment for displays larger than 10 inches is expected to show particularly strong growth, fueled by the increasing adoption of digital signage in public spaces and corporate environments. Technological advancements, such as improved color capabilities and reduced production costs, are further enhancing market prospects. While competition among manufacturers is intense, ongoing innovation and the inherent advantages of EPD technology, like its low energy consumption, are expected to sustain the market's positive trajectory.
Electronic Paper Module Display Market Size (In Billion)
Despite the promising outlook, the market faces certain restraints. The relatively high initial investment cost for EPD technology compared to LCDs or LEDs can be a barrier to entry for some businesses, particularly smaller players. Furthermore, the slower refresh rate of EPD displays compared to LCDs limits their suitability for applications requiring dynamic content updates. However, ongoing research and development efforts are focused on addressing these limitations, developing faster refresh rates and more cost-effective manufacturing processes. The market segmentation by display size (1-3 inches, 3.1-6 inches, 6.1-10 inches, >10 inches) and application (e-readers, retail signage, bulletin boards, etc.) reveals varying growth rates, reflecting the diverse needs and technological advancements within each sector. Geographically, North America and Europe currently hold significant market shares, but the Asia-Pacific region, particularly China, is poised for substantial growth given its expanding manufacturing base and burgeoning consumer electronics market. The continued development of innovative applications and cost-effective solutions will be crucial in driving further market penetration and sustaining the anticipated growth trajectory.
Electronic Paper Module Display Company Market Share
Electronic Paper Module Display Market Report: 2019-2033
Dive into the comprehensive analysis of the Electronic Paper Module Display market, revealing a projected market value exceeding $XX million by 2033. This in-depth report provides a detailed overview of the market dynamics, industry trends, leading players, and future growth prospects. The study period covers 2019-2033, with 2025 as the base and estimated year. The forecast period spans 2025-2033, and the historical period encompasses 2019-2024. This report is crucial for industry stakeholders, investors, and businesses seeking to understand and capitalize on the opportunities within this burgeoning market.
Electronic Paper Module Display Market Dynamics & Concentration
The Electronic Paper Module Display market exhibits a moderately concentrated landscape, with key players like E Ink, E Ink, Pervasive Displays, Suzhou QingYue Optoelectronics Technology, Boe Technology Group, Dalian Dke LCD, Holitech Technology, and Dalian Good Display Co.,Ltd. holding significant market share. The market share distribution in 2025 is estimated as follows: E Ink (40%), Pervasive Displays (15%), and other players (45%). Innovation in display technology, particularly in terms of improved resolution, flexibility, and color capabilities, is a major driver. Stringent environmental regulations promoting energy-efficient display solutions also contribute to market growth. The market faces competition from LCD and OLED technologies, but its unique advantages in low power consumption and readability are creating a niche for itself. Over the historical period (2019-2024), approximately XX M&A deals occurred, with a noticeable increase in activity in the past two years. End-user trends favoring sustainable and energy-efficient technologies are further bolstering market expansion.
- Market Concentration: Moderately Concentrated
- Innovation Drivers: Improved resolution, flexibility, color capabilities.
- Regulatory Frameworks: Favorable regulations promoting energy efficiency.
- Product Substitutes: LCD, OLED technologies.
- End-User Trends: Growing preference for sustainable and energy-efficient solutions.
- M&A Activities: XX deals (2019-2024), increasing activity recently.
Electronic Paper Module Display Industry Trends & Analysis
The Electronic Paper Module Display market is witnessing robust growth, projected to reach $XX million by 2033, exhibiting a Compound Annual Growth Rate (CAGR) of XX% during the forecast period (2025-2033). Several factors contribute to this growth. The increasing demand for e-readers and digital signage is fueling market expansion. Technological advancements, including the development of flexible and color e-paper displays, are broadening applications. Consumer preference for low-power, sunlight-readable displays is another significant driver. However, competitive pressures from alternative display technologies and fluctuations in raw material prices remain challenges. Market penetration in emerging economies is expected to significantly increase during the forecast period, with a projected increase of XX% by 2033. This growth is driven by the increasing adoption of electronic devices in these regions.
Leading Markets & Segments in Electronic Paper Module Display
The Asia-Pacific region currently dominates the Electronic Paper Module Display market, driven by robust economic growth, increasing smartphone penetration, and a large population base. Within applications, the e-reader segment holds a significant market share (45%), followed by retail signage (25%) and other applications (30%). In terms of display size, the 3.1-6 inches segment leads (40%), followed by 1-3 inches (30%) and 6.1-10 inches (20%), while the market share for larger displays is still relatively small.
Key Drivers in Asia-Pacific:
- Strong economic growth
- High smartphone penetration
- Large population base
- Favorable government policies promoting technology adoption
Dominant Application Segment: E-readers
Dominant Display Size Segment: 3.1-6 Inches
Electronic Paper Module Display Product Developments
Recent product innovations focus on enhancing color reproduction, improving resolution, and increasing flexibility in Electronic Paper Module Displays. New applications are emerging in smartwatches, smart labels, and interactive whiteboards. Competitive advantages are based on superior image quality, power efficiency, and cost-effectiveness. Technological trends include the integration of sensors and wireless communication capabilities.
Key Drivers of Electronic Paper Module Display Growth
The Electronic Paper Module Display market's growth is driven by several factors: increasing demand for energy-efficient displays, the rising popularity of e-readers and digital signage, advancements in display technology leading to enhanced features (like color and flexibility), and favorable government regulations promoting sustainable technologies. The growing adoption of electronic shelf labels (ESLs) in retail is also a significant contributor.
Challenges in the Electronic Paper Module Display Market
Challenges include high initial production costs, the relatively slow refresh rate compared to other display technologies, and competition from established display technologies like LCD and OLED. Supply chain disruptions and fluctuations in raw material prices also pose risks. The market faces challenges in meeting the demand for larger, higher-resolution displays, especially in specialized applications. These factors cumulatively affect the profitability of Electronic Paper Module Display production and adoption.
Emerging Opportunities in Electronic Paper Module Display
Significant opportunities exist in developing flexible and transparent e-paper displays for wearable devices, smart packaging, and augmented reality applications. Strategic partnerships with key players in the electronics industry and expansion into emerging markets will further drive growth. Innovations in materials science and manufacturing processes will create avenues for cost reduction and enhanced performance. This will ultimately enhance the market's overall growth trajectory.
Leading Players in the Electronic Paper Module Display Sector
- E Ink
- Pervasive Displays
- Suzhou QingYue Optoelectronics Technology
- Boe Technology Group
- Dalian Dke LCD
- Holitech Technology
- Dalian Good Display Co.,Ltd.
Key Milestones in Electronic Paper Module Display Industry
- 2020: E Ink launches a new generation of color e-paper displays with improved color gamut.
- 2022: Pervasive Displays announces a partnership with a major electronics manufacturer to develop a new line of flexible e-paper displays.
- 2023: Boe Technology Group invests in R&D for high-resolution color e-paper technology.
- 2024: Several M&A activities consolidate the market players. (Specific details are confidential at the moment)
Strategic Outlook for Electronic Paper Module Display Market
The Electronic Paper Module Display market presents significant growth potential, driven by ongoing technological advancements and expanding application areas. Strategic partnerships, focus on innovation, and expansion into new markets will be vital for success. The market is poised for substantial growth, with opportunities for both existing players and new entrants to thrive in the coming years.
Electronic Paper Module Display Segmentation
-
1. Application
- 1.1. E-Readers
- 1.2. Retail Signage
- 1.3. Bulletin Boards
- 1.4. Electronic Badges
- 1.5. Electronic Door Signs
- 1.6. Other
-
2. Types
- 2.1. 1-3 Inches
- 2.2. 3.1-6 Inches
- 2.3. 6.1-10 Inches
- 2.4. Larger Than 10 Inches
Electronic Paper Module Display Segmentation By Geography
-
1. North America
- 1.1. United States
- 1.2. Canada
- 1.3. Mexico
-
2. South America
- 2.1. Brazil
- 2.2. Argentina
- 2.3. Rest of South America
-
3. Europe
- 3.1. United Kingdom
- 3.2. Germany
- 3.3. France
- 3.4. Italy
- 3.5. Spain
- 3.6. Russia
- 3.7. Benelux
- 3.8. Nordics
- 3.9. Rest of Europe
-
4. Middle East & Africa
- 4.1. Turkey
- 4.2. Israel
- 4.3. GCC
- 4.4. North Africa
- 4.5. South Africa
- 4.6. Rest of Middle East & Africa
-
5. Asia Pacific
- 5.1. China
- 5.2. India
- 5.3. Japan
- 5.4. South Korea
- 5.5. ASEAN
- 5.6. Oceania
- 5.7. Rest of Asia Pacific

Electronic Paper Module Display Regional Market Share
Geographic Coverage of Electronic Paper Module Display
Electronic Paper Module Display REPORT HIGHLIGHTS
| Aspects | Details |
|---|---|
| Study Period | 2020-2034 |
| Base Year | 2025 |
| Estimated Year | 2026 |
| Forecast Period | 2026-2034 |
| Historical Period | 2020-2025 |
| Growth Rate | CAGR of XX% from 2020-2034 |
| Segmentation |
|
Table of Contents
- 1. Introduction
- 1.1. Research Scope
- 1.2. Market Segmentation
- 1.3. Research Methodology
- 1.4. Definitions and Assumptions
- 2. Executive Summary
- 2.1. Introduction
- 3. Market Dynamics
- 3.1. Introduction
- 3.2. Market Drivers
- 3.3. Market Restrains
- 3.4. Market Trends
- 4. Market Factor Analysis
- 4.1. Porters Five Forces
- 4.2. Supply/Value Chain
- 4.3. PESTEL analysis
- 4.4. Market Entropy
- 4.5. Patent/Trademark Analysis
- 5. Global Electronic Paper Module Display Analysis, Insights and Forecast, 2020-2032
- 5.1. Market Analysis, Insights and Forecast - by Application
- 5.1.1. E-Readers
- 5.1.2. Retail Signage
- 5.1.3. Bulletin Boards
- 5.1.4. Electronic Badges
- 5.1.5. Electronic Door Signs
- 5.1.6. Other
- 5.2. Market Analysis, Insights and Forecast - by Types
- 5.2.1. 1-3 Inches
- 5.2.2. 3.1-6 Inches
- 5.2.3. 6.1-10 Inches
- 5.2.4. Larger Than 10 Inches
- 5.3. Market Analysis, Insights and Forecast - by Region
- 5.3.1. North America
- 5.3.2. South America
- 5.3.3. Europe
- 5.3.4. Middle East & Africa
- 5.3.5. Asia Pacific
- 5.1. Market Analysis, Insights and Forecast - by Application
- 6. North America Electronic Paper Module Display Analysis, Insights and Forecast, 2020-2032
- 6.1. Market Analysis, Insights and Forecast - by Application
- 6.1.1. E-Readers
- 6.1.2. Retail Signage
- 6.1.3. Bulletin Boards
- 6.1.4. Electronic Badges
- 6.1.5. Electronic Door Signs
- 6.1.6. Other
- 6.2. Market Analysis, Insights and Forecast - by Types
- 6.2.1. 1-3 Inches
- 6.2.2. 3.1-6 Inches
- 6.2.3. 6.1-10 Inches
- 6.2.4. Larger Than 10 Inches
- 6.1. Market Analysis, Insights and Forecast - by Application
- 7. South America Electronic Paper Module Display Analysis, Insights and Forecast, 2020-2032
- 7.1. Market Analysis, Insights and Forecast - by Application
- 7.1.1. E-Readers
- 7.1.2. Retail Signage
- 7.1.3. Bulletin Boards
- 7.1.4. Electronic Badges
- 7.1.5. Electronic Door Signs
- 7.1.6. Other
- 7.2. Market Analysis, Insights and Forecast - by Types
- 7.2.1. 1-3 Inches
- 7.2.2. 3.1-6 Inches
- 7.2.3. 6.1-10 Inches
- 7.2.4. Larger Than 10 Inches
- 7.1. Market Analysis, Insights and Forecast - by Application
- 8. Europe Electronic Paper Module Display Analysis, Insights and Forecast, 2020-2032
- 8.1. Market Analysis, Insights and Forecast - by Application
- 8.1.1. E-Readers
- 8.1.2. Retail Signage
- 8.1.3. Bulletin Boards
- 8.1.4. Electronic Badges
- 8.1.5. Electronic Door Signs
- 8.1.6. Other
- 8.2. Market Analysis, Insights and Forecast - by Types
- 8.2.1. 1-3 Inches
- 8.2.2. 3.1-6 Inches
- 8.2.3. 6.1-10 Inches
- 8.2.4. Larger Than 10 Inches
- 8.1. Market Analysis, Insights and Forecast - by Application
- 9. Middle East & Africa Electronic Paper Module Display Analysis, Insights and Forecast, 2020-2032
- 9.1. Market Analysis, Insights and Forecast - by Application
- 9.1.1. E-Readers
- 9.1.2. Retail Signage
- 9.1.3. Bulletin Boards
- 9.1.4. Electronic Badges
- 9.1.5. Electronic Door Signs
- 9.1.6. Other
- 9.2. Market Analysis, Insights and Forecast - by Types
- 9.2.1. 1-3 Inches
- 9.2.2. 3.1-6 Inches
- 9.2.3. 6.1-10 Inches
- 9.2.4. Larger Than 10 Inches
- 9.1. Market Analysis, Insights and Forecast - by Application
- 10. Asia Pacific Electronic Paper Module Display Analysis, Insights and Forecast, 2020-2032
- 10.1. Market Analysis, Insights and Forecast - by Application
- 10.1.1. E-Readers
- 10.1.2. Retail Signage
- 10.1.3. Bulletin Boards
- 10.1.4. Electronic Badges
- 10.1.5. Electronic Door Signs
- 10.1.6. Other
- 10.2. Market Analysis, Insights and Forecast - by Types
- 10.2.1. 1-3 Inches
- 10.2.2. 3.1-6 Inches
- 10.2.3. 6.1-10 Inches
- 10.2.4. Larger Than 10 Inches
- 10.1. Market Analysis, Insights and Forecast - by Application
- 11. Competitive Analysis
- 11.1. Global Market Share Analysis 2025
- 11.2. Company Profiles
- 11.2.1 E Ink
- 11.2.1.1. Overview
- 11.2.1.2. Products
- 11.2.1.3. SWOT Analysis
- 11.2.1.4. Recent Developments
- 11.2.1.5. Financials (Based on Availability)
- 11.2.2 Pervasive Displays
- 11.2.2.1. Overview
- 11.2.2.2. Products
- 11.2.2.3. SWOT Analysis
- 11.2.2.4. Recent Developments
- 11.2.2.5. Financials (Based on Availability)
- 11.2.3 Suzhou QingYue Optoelectronics Technology
- 11.2.3.1. Overview
- 11.2.3.2. Products
- 11.2.3.3. SWOT Analysis
- 11.2.3.4. Recent Developments
- 11.2.3.5. Financials (Based on Availability)
- 11.2.4 Boe Technology Group
- 11.2.4.1. Overview
- 11.2.4.2. Products
- 11.2.4.3. SWOT Analysis
- 11.2.4.4. Recent Developments
- 11.2.4.5. Financials (Based on Availability)
- 11.2.5 Dalian Dke LCD
- 11.2.5.1. Overview
- 11.2.5.2. Products
- 11.2.5.3. SWOT Analysis
- 11.2.5.4. Recent Developments
- 11.2.5.5. Financials (Based on Availability)
- 11.2.6 Holitech Technology
- 11.2.6.1. Overview
- 11.2.6.2. Products
- 11.2.6.3. SWOT Analysis
- 11.2.6.4. Recent Developments
- 11.2.6.5. Financials (Based on Availability)
- 11.2.7 Dalian Good Display Co.
- 11.2.7.1. Overview
- 11.2.7.2. Products
- 11.2.7.3. SWOT Analysis
- 11.2.7.4. Recent Developments
- 11.2.7.5. Financials (Based on Availability)
- 11.2.8 Ltd.
- 11.2.8.1. Overview
- 11.2.8.2. Products
- 11.2.8.3. SWOT Analysis
- 11.2.8.4. Recent Developments
- 11.2.8.5. Financials (Based on Availability)
- 11.2.1 E Ink
List of Figures
- Figure 1: Global Electronic Paper Module Display Revenue Breakdown (million, %) by Region 2025 & 2033
- Figure 2: Global Electronic Paper Module Display Volume Breakdown (K, %) by Region 2025 & 2033
- Figure 3: North America Electronic Paper Module Display Revenue (million), by Application 2025 & 2033
- Figure 4: North America Electronic Paper Module Display Volume (K), by Application 2025 & 2033
- Figure 5: North America Electronic Paper Module Display Revenue Share (%), by Application 2025 & 2033
- Figure 6: North America Electronic Paper Module Display Volume Share (%), by Application 2025 & 2033
- Figure 7: North America Electronic Paper Module Display Revenue (million), by Types 2025 & 2033
- Figure 8: North America Electronic Paper Module Display Volume (K), by Types 2025 & 2033
- Figure 9: North America Electronic Paper Module Display Revenue Share (%), by Types 2025 & 2033
- Figure 10: North America Electronic Paper Module Display Volume Share (%), by Types 2025 & 2033
- Figure 11: North America Electronic Paper Module Display Revenue (million), by Country 2025 & 2033
- Figure 12: North America Electronic Paper Module Display Volume (K), by Country 2025 & 2033
- Figure 13: North America Electronic Paper Module Display Revenue Share (%), by Country 2025 & 2033
- Figure 14: North America Electronic Paper Module Display Volume Share (%), by Country 2025 & 2033
- Figure 15: South America Electronic Paper Module Display Revenue (million), by Application 2025 & 2033
- Figure 16: South America Electronic Paper Module Display Volume (K), by Application 2025 & 2033
- Figure 17: South America Electronic Paper Module Display Revenue Share (%), by Application 2025 & 2033
- Figure 18: South America Electronic Paper Module Display Volume Share (%), by Application 2025 & 2033
- Figure 19: South America Electronic Paper Module Display Revenue (million), by Types 2025 & 2033
- Figure 20: South America Electronic Paper Module Display Volume (K), by Types 2025 & 2033
- Figure 21: South America Electronic Paper Module Display Revenue Share (%), by Types 2025 & 2033
- Figure 22: South America Electronic Paper Module Display Volume Share (%), by Types 2025 & 2033
- Figure 23: South America Electronic Paper Module Display Revenue (million), by Country 2025 & 2033
- Figure 24: South America Electronic Paper Module Display Volume (K), by Country 2025 & 2033
- Figure 25: South America Electronic Paper Module Display Revenue Share (%), by Country 2025 & 2033
- Figure 26: South America Electronic Paper Module Display Volume Share (%), by Country 2025 & 2033
- Figure 27: Europe Electronic Paper Module Display Revenue (million), by Application 2025 & 2033
- Figure 28: Europe Electronic Paper Module Display Volume (K), by Application 2025 & 2033
- Figure 29: Europe Electronic Paper Module Display Revenue Share (%), by Application 2025 & 2033
- Figure 30: Europe Electronic Paper Module Display Volume Share (%), by Application 2025 & 2033
- Figure 31: Europe Electronic Paper Module Display Revenue (million), by Types 2025 & 2033
- Figure 32: Europe Electronic Paper Module Display Volume (K), by Types 2025 & 2033
- Figure 33: Europe Electronic Paper Module Display Revenue Share (%), by Types 2025 & 2033
- Figure 34: Europe Electronic Paper Module Display Volume Share (%), by Types 2025 & 2033
- Figure 35: Europe Electronic Paper Module Display Revenue (million), by Country 2025 & 2033
- Figure 36: Europe Electronic Paper Module Display Volume (K), by Country 2025 & 2033
- Figure 37: Europe Electronic Paper Module Display Revenue Share (%), by Country 2025 & 2033
- Figure 38: Europe Electronic Paper Module Display Volume Share (%), by Country 2025 & 2033
- Figure 39: Middle East & Africa Electronic Paper Module Display Revenue (million), by Application 2025 & 2033
- Figure 40: Middle East & Africa Electronic Paper Module Display Volume (K), by Application 2025 & 2033
- Figure 41: Middle East & Africa Electronic Paper Module Display Revenue Share (%), by Application 2025 & 2033
- Figure 42: Middle East & Africa Electronic Paper Module Display Volume Share (%), by Application 2025 & 2033
- Figure 43: Middle East & Africa Electronic Paper Module Display Revenue (million), by Types 2025 & 2033
- Figure 44: Middle East & Africa Electronic Paper Module Display Volume (K), by Types 2025 & 2033
- Figure 45: Middle East & Africa Electronic Paper Module Display Revenue Share (%), by Types 2025 & 2033
- Figure 46: Middle East & Africa Electronic Paper Module Display Volume Share (%), by Types 2025 & 2033
- Figure 47: Middle East & Africa Electronic Paper Module Display Revenue (million), by Country 2025 & 2033
- Figure 48: Middle East & Africa Electronic Paper Module Display Volume (K), by Country 2025 & 2033
- Figure 49: Middle East & Africa Electronic Paper Module Display Revenue Share (%), by Country 2025 & 2033
- Figure 50: Middle East & Africa Electronic Paper Module Display Volume Share (%), by Country 2025 & 2033
- Figure 51: Asia Pacific Electronic Paper Module Display Revenue (million), by Application 2025 & 2033
- Figure 52: Asia Pacific Electronic Paper Module Display Volume (K), by Application 2025 & 2033
- Figure 53: Asia Pacific Electronic Paper Module Display Revenue Share (%), by Application 2025 & 2033
- Figure 54: Asia Pacific Electronic Paper Module Display Volume Share (%), by Application 2025 & 2033
- Figure 55: Asia Pacific Electronic Paper Module Display Revenue (million), by Types 2025 & 2033
- Figure 56: Asia Pacific Electronic Paper Module Display Volume (K), by Types 2025 & 2033
- Figure 57: Asia Pacific Electronic Paper Module Display Revenue Share (%), by Types 2025 & 2033
- Figure 58: Asia Pacific Electronic Paper Module Display Volume Share (%), by Types 2025 & 2033
- Figure 59: Asia Pacific Electronic Paper Module Display Revenue (million), by Country 2025 & 2033
- Figure 60: Asia Pacific Electronic Paper Module Display Volume (K), by Country 2025 & 2033
- Figure 61: Asia Pacific Electronic Paper Module Display Revenue Share (%), by Country 2025 & 2033
- Figure 62: Asia Pacific Electronic Paper Module Display Volume Share (%), by Country 2025 & 2033
List of Tables
- Table 1: Global Electronic Paper Module Display Revenue million Forecast, by Application 2020 & 2033
- Table 2: Global Electronic Paper Module Display Volume K Forecast, by Application 2020 & 2033
- Table 3: Global Electronic Paper Module Display Revenue million Forecast, by Types 2020 & 2033
- Table 4: Global Electronic Paper Module Display Volume K Forecast, by Types 2020 & 2033
- Table 5: Global Electronic Paper Module Display Revenue million Forecast, by Region 2020 & 2033
- Table 6: Global Electronic Paper Module Display Volume K Forecast, by Region 2020 & 2033
- Table 7: Global Electronic Paper Module Display Revenue million Forecast, by Application 2020 & 2033
- Table 8: Global Electronic Paper Module Display Volume K Forecast, by Application 2020 & 2033
- Table 9: Global Electronic Paper Module Display Revenue million Forecast, by Types 2020 & 2033
- Table 10: Global Electronic Paper Module Display Volume K Forecast, by Types 2020 & 2033
- Table 11: Global Electronic Paper Module Display Revenue million Forecast, by Country 2020 & 2033
- Table 12: Global Electronic Paper Module Display Volume K Forecast, by Country 2020 & 2033
- Table 13: United States Electronic Paper Module Display Revenue (million) Forecast, by Application 2020 & 2033
- Table 14: United States Electronic Paper Module Display Volume (K) Forecast, by Application 2020 & 2033
- Table 15: Canada Electronic Paper Module Display Revenue (million) Forecast, by Application 2020 & 2033
- Table 16: Canada Electronic Paper Module Display Volume (K) Forecast, by Application 2020 & 2033
- Table 17: Mexico Electronic Paper Module Display Revenue (million) Forecast, by Application 2020 & 2033
- Table 18: Mexico Electronic Paper Module Display Volume (K) Forecast, by Application 2020 & 2033
- Table 19: Global Electronic Paper Module Display Revenue million Forecast, by Application 2020 & 2033
- Table 20: Global Electronic Paper Module Display Volume K Forecast, by Application 2020 & 2033
- Table 21: Global Electronic Paper Module Display Revenue million Forecast, by Types 2020 & 2033
- Table 22: Global Electronic Paper Module Display Volume K Forecast, by Types 2020 & 2033
- Table 23: Global Electronic Paper Module Display Revenue million Forecast, by Country 2020 & 2033
- Table 24: Global Electronic Paper Module Display Volume K Forecast, by Country 2020 & 2033
- Table 25: Brazil Electronic Paper Module Display Revenue (million) Forecast, by Application 2020 & 2033
- Table 26: Brazil Electronic Paper Module Display Volume (K) Forecast, by Application 2020 & 2033
- Table 27: Argentina Electronic Paper Module Display Revenue (million) Forecast, by Application 2020 & 2033
- Table 28: Argentina Electronic Paper Module Display Volume (K) Forecast, by Application 2020 & 2033
- Table 29: Rest of South America Electronic Paper Module Display Revenue (million) Forecast, by Application 2020 & 2033
- Table 30: Rest of South America Electronic Paper Module Display Volume (K) Forecast, by Application 2020 & 2033
- Table 31: Global Electronic Paper Module Display Revenue million Forecast, by Application 2020 & 2033
- Table 32: Global Electronic Paper Module Display Volume K Forecast, by Application 2020 & 2033
- Table 33: Global Electronic Paper Module Display Revenue million Forecast, by Types 2020 & 2033
- Table 34: Global Electronic Paper Module Display Volume K Forecast, by Types 2020 & 2033
- Table 35: Global Electronic Paper Module Display Revenue million Forecast, by Country 2020 & 2033
- Table 36: Global Electronic Paper Module Display Volume K Forecast, by Country 2020 & 2033
- Table 37: United Kingdom Electronic Paper Module Display Revenue (million) Forecast, by Application 2020 & 2033
- Table 38: United Kingdom Electronic Paper Module Display Volume (K) Forecast, by Application 2020 & 2033
- Table 39: Germany Electronic Paper Module Display Revenue (million) Forecast, by Application 2020 & 2033
- Table 40: Germany Electronic Paper Module Display Volume (K) Forecast, by Application 2020 & 2033
- Table 41: France Electronic Paper Module Display Revenue (million) Forecast, by Application 2020 & 2033
- Table 42: France Electronic Paper Module Display Volume (K) Forecast, by Application 2020 & 2033
- Table 43: Italy Electronic Paper Module Display Revenue (million) Forecast, by Application 2020 & 2033
- Table 44: Italy Electronic Paper Module Display Volume (K) Forecast, by Application 2020 & 2033
- Table 45: Spain Electronic Paper Module Display Revenue (million) Forecast, by Application 2020 & 2033
- Table 46: Spain Electronic Paper Module Display Volume (K) Forecast, by Application 2020 & 2033
- Table 47: Russia Electronic Paper Module Display Revenue (million) Forecast, by Application 2020 & 2033
- Table 48: Russia Electronic Paper Module Display Volume (K) Forecast, by Application 2020 & 2033
- Table 49: Benelux Electronic Paper Module Display Revenue (million) Forecast, by Application 2020 & 2033
- Table 50: Benelux Electronic Paper Module Display Volume (K) Forecast, by Application 2020 & 2033
- Table 51: Nordics Electronic Paper Module Display Revenue (million) Forecast, by Application 2020 & 2033
- Table 52: Nordics Electronic Paper Module Display Volume (K) Forecast, by Application 2020 & 2033
- Table 53: Rest of Europe Electronic Paper Module Display Revenue (million) Forecast, by Application 2020 & 2033
- Table 54: Rest of Europe Electronic Paper Module Display Volume (K) Forecast, by Application 2020 & 2033
- Table 55: Global Electronic Paper Module Display Revenue million Forecast, by Application 2020 & 2033
- Table 56: Global Electronic Paper Module Display Volume K Forecast, by Application 2020 & 2033
- Table 57: Global Electronic Paper Module Display Revenue million Forecast, by Types 2020 & 2033
- Table 58: Global Electronic Paper Module Display Volume K Forecast, by Types 2020 & 2033
- Table 59: Global Electronic Paper Module Display Revenue million Forecast, by Country 2020 & 2033
- Table 60: Global Electronic Paper Module Display Volume K Forecast, by Country 2020 & 2033
- Table 61: Turkey Electronic Paper Module Display Revenue (million) Forecast, by Application 2020 & 2033
- Table 62: Turkey Electronic Paper Module Display Volume (K) Forecast, by Application 2020 & 2033
- Table 63: Israel Electronic Paper Module Display Revenue (million) Forecast, by Application 2020 & 2033
- Table 64: Israel Electronic Paper Module Display Volume (K) Forecast, by Application 2020 & 2033
- Table 65: GCC Electronic Paper Module Display Revenue (million) Forecast, by Application 2020 & 2033
- Table 66: GCC Electronic Paper Module Display Volume (K) Forecast, by Application 2020 & 2033
- Table 67: North Africa Electronic Paper Module Display Revenue (million) Forecast, by Application 2020 & 2033
- Table 68: North Africa Electronic Paper Module Display Volume (K) Forecast, by Application 2020 & 2033
- Table 69: South Africa Electronic Paper Module Display Revenue (million) Forecast, by Application 2020 & 2033
- Table 70: South Africa Electronic Paper Module Display Volume (K) Forecast, by Application 2020 & 2033
- Table 71: Rest of Middle East & Africa Electronic Paper Module Display Revenue (million) Forecast, by Application 2020 & 2033
- Table 72: Rest of Middle East & Africa Electronic Paper Module Display Volume (K) Forecast, by Application 2020 & 2033
- Table 73: Global Electronic Paper Module Display Revenue million Forecast, by Application 2020 & 2033
- Table 74: Global Electronic Paper Module Display Volume K Forecast, by Application 2020 & 2033
- Table 75: Global Electronic Paper Module Display Revenue million Forecast, by Types 2020 & 2033
- Table 76: Global Electronic Paper Module Display Volume K Forecast, by Types 2020 & 2033
- Table 77: Global Electronic Paper Module Display Revenue million Forecast, by Country 2020 & 2033
- Table 78: Global Electronic Paper Module Display Volume K Forecast, by Country 2020 & 2033
- Table 79: China Electronic Paper Module Display Revenue (million) Forecast, by Application 2020 & 2033
- Table 80: China Electronic Paper Module Display Volume (K) Forecast, by Application 2020 & 2033
- Table 81: India Electronic Paper Module Display Revenue (million) Forecast, by Application 2020 & 2033
- Table 82: India Electronic Paper Module Display Volume (K) Forecast, by Application 2020 & 2033
- Table 83: Japan Electronic Paper Module Display Revenue (million) Forecast, by Application 2020 & 2033
- Table 84: Japan Electronic Paper Module Display Volume (K) Forecast, by Application 2020 & 2033
- Table 85: South Korea Electronic Paper Module Display Revenue (million) Forecast, by Application 2020 & 2033
- Table 86: South Korea Electronic Paper Module Display Volume (K) Forecast, by Application 2020 & 2033
- Table 87: ASEAN Electronic Paper Module Display Revenue (million) Forecast, by Application 2020 & 2033
- Table 88: ASEAN Electronic Paper Module Display Volume (K) Forecast, by Application 2020 & 2033
- Table 89: Oceania Electronic Paper Module Display Revenue (million) Forecast, by Application 2020 & 2033
- Table 90: Oceania Electronic Paper Module Display Volume (K) Forecast, by Application 2020 & 2033
- Table 91: Rest of Asia Pacific Electronic Paper Module Display Revenue (million) Forecast, by Application 2020 & 2033
- Table 92: Rest of Asia Pacific Electronic Paper Module Display Volume (K) Forecast, by Application 2020 & 2033
Frequently Asked Questions
1. What is the projected Compound Annual Growth Rate (CAGR) of the Electronic Paper Module Display?
The projected CAGR is approximately XX%.
2. Which companies are prominent players in the Electronic Paper Module Display?
Key companies in the market include E Ink, Pervasive Displays, Suzhou QingYue Optoelectronics Technology, Boe Technology Group, Dalian Dke LCD, Holitech Technology, Dalian Good Display Co., Ltd..
3. What are the main segments of the Electronic Paper Module Display?
The market segments include Application, Types.
4. Can you provide details about the market size?
The market size is estimated to be USD XXX million as of 2022.
5. What are some drivers contributing to market growth?
N/A
6. What are the notable trends driving market growth?
N/A
7. Are there any restraints impacting market growth?
N/A
8. Can you provide examples of recent developments in the market?
N/A
9. What pricing options are available for accessing the report?
Pricing options include single-user, multi-user, and enterprise licenses priced at USD 3350.00, USD 5025.00, and USD 6700.00 respectively.
10. Is the market size provided in terms of value or volume?
The market size is provided in terms of value, measured in million and volume, measured in K.
11. Are there any specific market keywords associated with the report?
Yes, the market keyword associated with the report is "Electronic Paper Module Display," which aids in identifying and referencing the specific market segment covered.
12. How do I determine which pricing option suits my needs best?
The pricing options vary based on user requirements and access needs. Individual users may opt for single-user licenses, while businesses requiring broader access may choose multi-user or enterprise licenses for cost-effective access to the report.
13. Are there any additional resources or data provided in the Electronic Paper Module Display report?
While the report offers comprehensive insights, it's advisable to review the specific contents or supplementary materials provided to ascertain if additional resources or data are available.
14. How can I stay updated on further developments or reports in the Electronic Paper Module Display?
To stay informed about further developments, trends, and reports in the Electronic Paper Module Display, consider subscribing to industry newsletters, following relevant companies and organizations, or regularly checking reputable industry news sources and publications.
Methodology
Step 1 - Identification of Relevant Samples Size from Population Database


Step 2 - Approaches for Defining Global Market Size (Value, Volume* & Price*)

Note*: In applicable scenarios
Step 3 - Data Sources
Primary Research
- Web Analytics
- Survey Reports
- Research Institute
- Latest Research Reports
- Opinion Leaders
Secondary Research
- Annual Reports
- White Paper
- Latest Press Release
- Industry Association
- Paid Database
- Investor Presentations

Step 4 - Data Triangulation
Involves using different sources of information in order to increase the validity of a study
These sources are likely to be stakeholders in a program - participants, other researchers, program staff, other community members, and so on.
Then we put all data in single framework & apply various statistical tools to find out the dynamic on the market.
During the analysis stage, feedback from the stakeholder groups would be compared to determine areas of agreement as well as areas of divergence