

Key Insights
The global electric powertrain systems market is poised for substantial growth, projected to reach an estimated USD 112.6 billion in 2025. This upward trajectory is fueled by an impressive Compound Annual Growth Rate (CAGR) of 12.8%, indicating a dynamic and rapidly expanding industry. The primary drivers behind this surge are the accelerating adoption of electric vehicles (EVs) across all segments, including Battery Electric Vehicles (BEVs) and Hybrid Electric Vehicles (HEVs)/Plug-in Hybrid Electric Vehicles (PHEVs). Government incentives, stringent emission regulations, and increasing consumer awareness regarding environmental sustainability are compelling automakers worldwide to invest heavily in electrification. Furthermore, technological advancements in battery technology, motor efficiency, and power electronics are enhancing EV performance and affordability, making them more attractive alternatives to traditional internal combustion engine vehicles. The expanding charging infrastructure also plays a crucial role in alleviating range anxiety, further boosting consumer confidence and market demand.
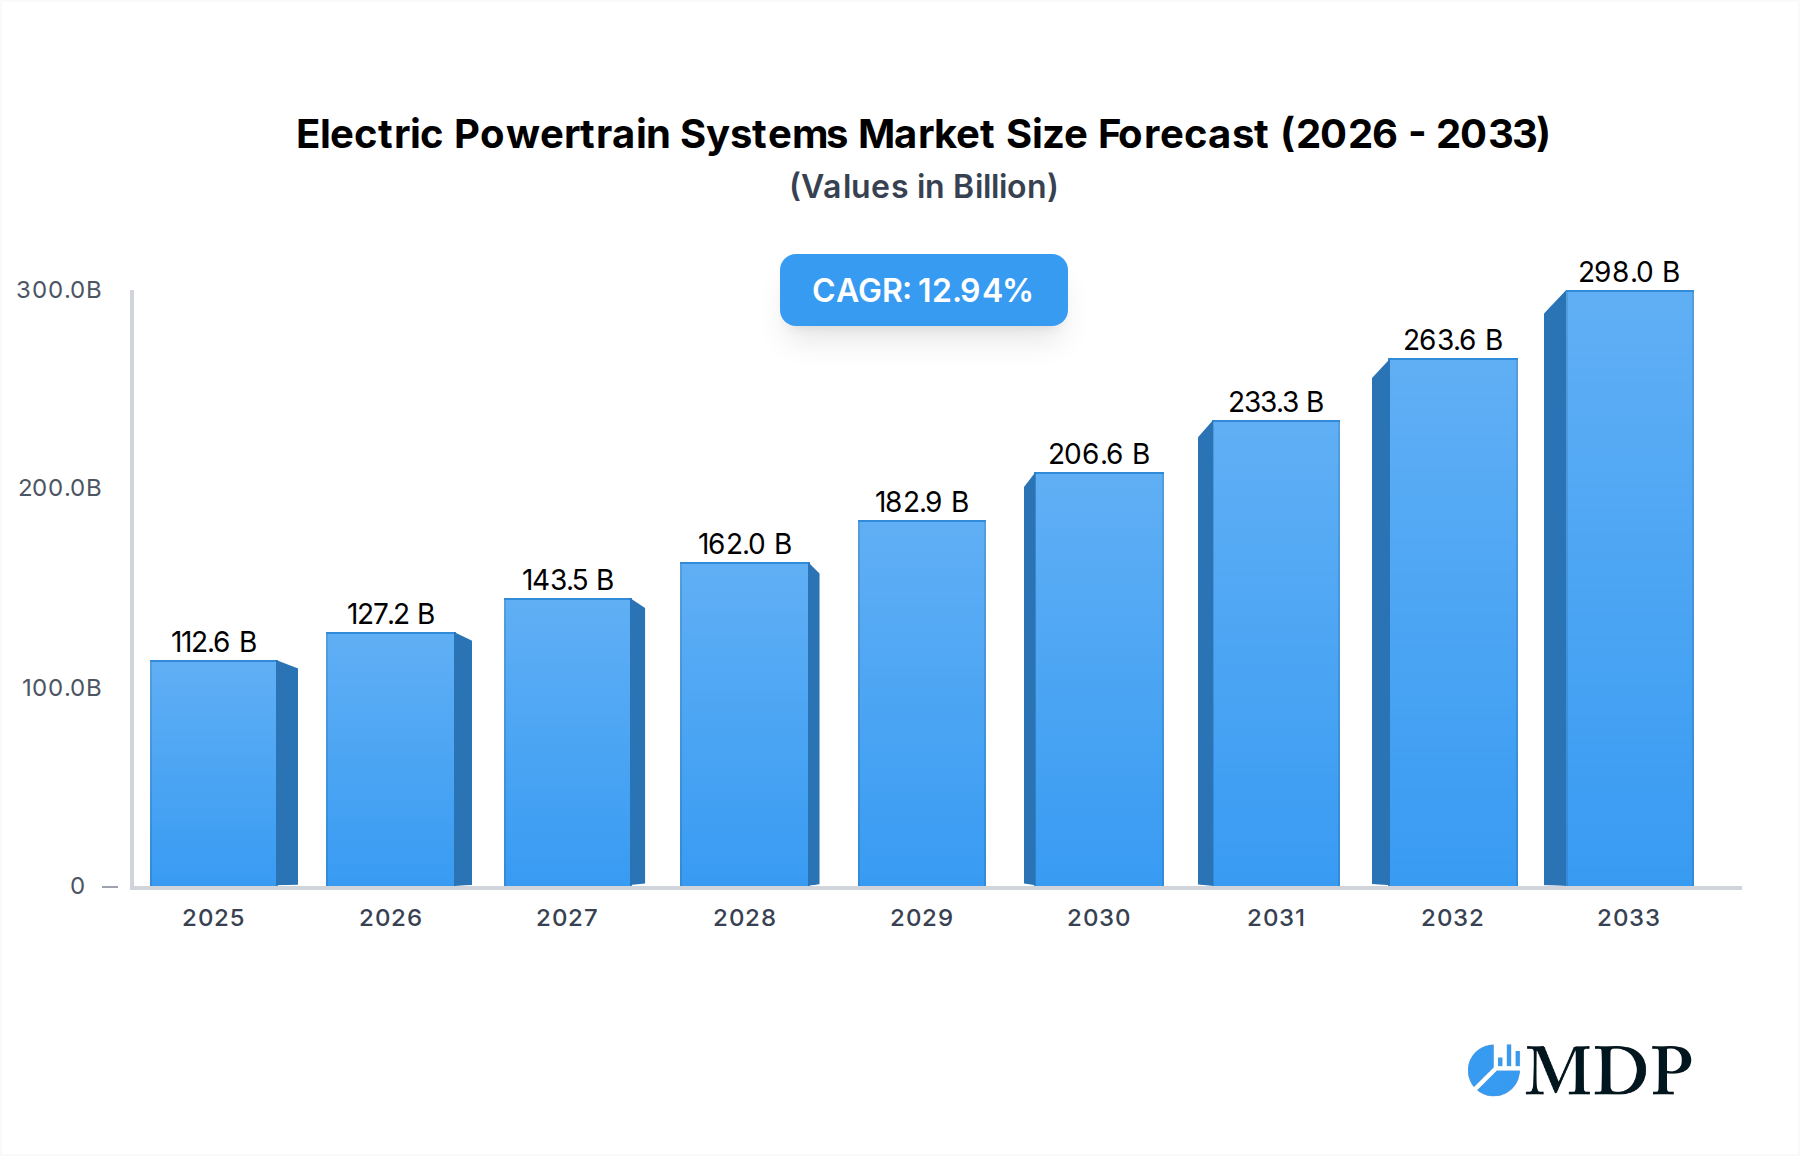
Electric Powertrain Systems Market Size (In Billion)
The market is segmented into key components such as motors/generators, batteries, power electronics controllers, converters, transmissions, and on-board chargers, each experiencing distinct growth patterns. Key players like BorgWarner, Mitsubishi Electric Corp, Schaeffler AG, ZF Friedrichshafen AG, and Robert Bosch GmbH are at the forefront of innovation, investing in research and development to offer cutting-edge solutions. Emerging trends include the development of highly efficient and compact powertrains, the integration of advanced software for performance optimization, and the increasing demand for sustainable and recyclable materials in powertrain manufacturing. While the market benefits from robust demand, potential restraints could arise from the volatility in raw material prices, particularly for battery components, and the ongoing development of charging standards and grid capacities to support the growing EV fleet. However, the overall outlook remains exceptionally positive, driven by the global transition towards cleaner mobility solutions.

Electric Powertrain Systems Company Market Share
Electric Powertrain Systems: Market Analysis, Trends, and Future Outlook (2019-2033)
This comprehensive report delves into the dynamic electric powertrain systems market, a critical component of the global automotive industry's transition towards sustainable mobility. Analyzing data from 2019 through 2033, with a base and estimated year of 2025, this study provides unparalleled insights into market size, growth drivers, technological advancements, and competitive landscapes. With a projected market valuation reaching billions, this report is an essential resource for automotive manufacturers, Tier-1 suppliers, research institutions, and investors seeking to capitalize on the burgeoning EV market and hybrid electric vehicle (HEV) segments. We explore the intricate details of BEV powertrains, HEV/PHEV architectures, and the individual components that constitute these advanced systems, including electric motors, generators, batteries, power electronics controllers, converters, transmissions, and on-board chargers.
Electric Powertrain Systems Market Dynamics & Concentration
The electric powertrain systems market is characterized by moderate to high concentration, with key players like Robert Bosch GmbH, Mitsubishi Electric Corp, ZF Friedrichshafen AG, and Hitachi Automotive Systems holding significant market share, estimated in the tens of billions. Innovation is a primary driver, fueled by continuous advancements in battery technology, motor efficiency, and power electronics, leading to improved EV performance and range. Regulatory frameworks globally, such as stringent emission standards and government incentives for electric vehicle adoption, are accelerating market growth. Product substitutes, primarily internal combustion engine (ICE) powertrains, are steadily losing ground as EV technology matures and costs decrease. End-user trends reveal a strong consumer preference for zero-emission vehicles, driven by environmental concerns and the decreasing total cost of ownership. Mergers and acquisitions (M&A) activities are prevalent, with approximately 15 significant M&A deals valued in the billions expected during the forecast period (2025-2033), as companies seek to consolidate expertise, expand their product portfolios, and secure market leadership. This dynamic landscape necessitates a deep understanding of competitive positioning and strategic alliances for sustained success in the automotive electrification domain.
Electric Powertrain Systems Industry Trends & Analysis
The electric powertrain systems industry is experiencing exponential growth, projected to achieve a Compound Annual Growth Rate (CAGR) of approximately 18% over the forecast period (2025-2033), with the market value expected to surpass several hundred billion by 2033. This robust expansion is primarily driven by increasing global demand for electric vehicles (EVs), both Battery Electric Vehicles (BEVs) and Hybrid Electric Vehicles (HEVs/PHEVs), as governments worldwide implement supportive policies and consumers prioritize sustainable transportation. Technological disruptions are at the forefront, with innovations in high-efficiency electric motors, advanced battery chemistries offering greater energy density and faster charging capabilities, and sophisticated power electronics that optimize energy management and improve overall system performance. The development of lighter, more compact, and cost-effective electric powertrain components is further stimulating adoption. Consumer preferences are rapidly shifting towards environmentally friendly vehicles, influenced by rising fuel costs, growing awareness of climate change, and the enhanced driving experience offered by electric powertrains, such as instant torque and quiet operation.
Competitive dynamics are intensifying, with established automotive giants like Nissan Motor, Magna International Inc., and Schaeffler AG investing heavily in R&D and production capacity, alongside specialized EV component suppliers such as Dana TM4 and BorgWarner. The increasing market penetration of EVs, estimated to reach over 30% of new vehicle sales by 2033, is creating a compelling business case for continued investment and innovation in this sector. The evolution of electric vehicle charging infrastructure and the decreasing cost of EV batteries are also significant factors contributing to the widespread acceptance and growth of electric powertrains. The automotive industry's transition away from traditional internal combustion engines towards electric propulsion is irreversible, making electric powertrain systems a central pillar of future mobility solutions. The integration of advanced software, artificial intelligence, and connectivity features within these systems further enhances their appeal and functionality, creating a complex yet promising market.
Leading Markets & Segments in Electric Powertrain Systems
The electric powertrain systems market is dominated by the BEV (Battery Electric Vehicle) application segment, which is projected to account for over 60% of the total market value by 2033, driven by aggressive government mandates for zero-emission vehicles and increasing consumer demand for longer-range, fully electric mobility. North America and Europe are leading regions, with their respective governments implementing substantial subsidies, tax credits, and charging infrastructure investments that significantly boost EV sales.
Key Drivers for BEV Dominance and Regional Growth:
- Economic Policies: Favorable subsidies, tax incentives, and grants for purchasing electric vehicles and investing in EV manufacturing capacity are instrumental. For instance, policies in the United States and European Union countries are directly accelerating the adoption of BEV powertrains.
- Infrastructure Development: The rapid expansion of public and private EV charging networks is a critical enabler, reducing range anxiety and making EV ownership more practical. Billions are being invested globally in charging infrastructure.
- Technological Advancements: Continuous improvements in EV battery technology (e.g., energy density, charging speed, lifespan) and the efficiency of electric motors and power electronics controllers are making BEVs more competitive and appealing.
- Automaker Commitments: Major automakers like Nissan Motor are committing billions to electrify their entire model lineups, further stimulating demand for BEV powertrains.
Within the Type segment, Batteries represent the largest sub-segment, valued in the tens of billions, due to their substantial cost and critical role in EV performance. However, the Motor/Generator segment is experiencing the fastest growth, with a projected CAGR of over 20%, driven by innovations in motor design leading to higher efficiency and power output for both BEVs and HEVs/PHEVs. The Power Electronics Controller segment is also a significant growth area, essential for managing energy flow and optimizing performance in all electric powertrains. Countries like China, the United States, and Germany are major contributors to the market's growth, supported by strong domestic EV manufacturing capabilities and robust consumer demand for electric mobility solutions.
Electric Powertrain Systems Product Developments
Product innovations in electric powertrain systems are rapidly advancing, focusing on enhanced efficiency, reduced cost, and improved performance. Key developments include lighter and more integrated e-axles that combine the motor, transmission, and power electronics, leading to substantial weight and space savings. Advancements in silicon carbide (SiC) and gallium nitride (GaN) power electronics are enabling higher voltage operation, faster switching speeds, and improved thermal management, contributing to greater EV range and faster charging. Battery technology continues to evolve with the development of solid-state batteries promising increased energy density and enhanced safety. These innovations offer competitive advantages by improving the performance of electric vehicles and making them more accessible to a wider consumer base.
Key Drivers of Electric Powertrain Systems Growth
The electric powertrain systems market is propelled by several powerful growth drivers. Government regulations and incentives are paramount, with stringent emission standards and subsidies for electric vehicle (EV) adoption creating a favorable market environment. Technological advancements in battery technology, such as increased energy density and faster charging capabilities, are directly addressing consumer concerns about EV range anxiety. The decreasing cost of EV batteries and other powertrain components is making electric vehicles more economically viable. Furthermore, growing consumer awareness of environmental issues and the desire for sustainable transportation options are significantly boosting demand for BEVs and HEVs/PHEVs. The expanding charging infrastructure also plays a crucial role in facilitating the widespread adoption of electric mobility.
Challenges in the Electric Powertrain Systems Market
Despite robust growth, the electric powertrain systems market faces several challenges. High upfront costs of electric vehicles, particularly battery costs, remain a significant barrier to mass adoption, although this is steadily decreasing. The limited availability and slower charging times of EV charging infrastructure in some regions continue to pose an issue for consumers. Supply chain constraints, particularly for critical raw materials like lithium and cobalt used in EV batteries, can lead to price volatility and production delays. Intense competition among numerous automotive suppliers and EV manufacturers can also put pressure on profit margins. Furthermore, evolving regulatory frameworks and evolving consumer preferences require constant adaptation and investment in R&D for electric powertrain components.
Emerging Opportunities in Electric Powertrain Systems
Emerging opportunities in the electric powertrain systems market are abundant. The development of next-generation battery chemistries, such as solid-state batteries, promises to revolutionize EV performance and safety, offering significant growth potential. Strategic partnerships between automakers, battery manufacturers, and technology providers are fostering collaborative innovation and accelerating the development of integrated electric powertrains. The expansion into new geographical markets, particularly developing economies with growing automotive sectors and increasing environmental consciousness, presents substantial growth avenues. The integration of advanced software and artificial intelligence for optimized powertrain control and predictive maintenance also opens new revenue streams and enhances the value proposition of electric vehicles. The growing demand for electric commercial vehicles and industrial machinery is also creating significant opportunities for specialized electric powertrain solutions.
Leading Players in the Electric Powertrain Systems Sector
- Robert Bosch GmbH
- Mitsubishi Electric Corp
- ZF Friedrichshafen AG
- Hitachi Automotive Systems
- Magna International Inc.
- Schaeffler AG
- Dana TM4
- BorgWarner
- Nissan Motor
- Porsche Engineering
Key Milestones in Electric Powertrain Systems Industry
- 2019: Launch of advanced lithium-ion battery technologies with improved energy density, significantly increasing EV range.
- 2020: Widespread adoption of 800V architecture in premium EVs, enabling faster charging speeds.
- 2021: Significant advancements in the efficiency of permanent magnet synchronous motors, reducing material costs and enhancing performance.
- 2022: Major automotive players announce substantial investments in dedicated EV battery gigafactories, aiming to secure supply and reduce costs.
- 2023: Emergence of integrated e-axle solutions combining motor, gearbox, and inverter for enhanced packaging and efficiency.
- 2024: Increased focus on the development of silicon carbide (SiC) power electronics for higher efficiency and thermal performance in electric powertrains.
Strategic Outlook for Electric Powertrain Systems Market
The strategic outlook for the electric powertrain systems market is exceptionally positive, driven by an accelerating global transition towards sustainable transportation. Key growth accelerators include continued advancements in battery technology that will further reduce costs and increase energy density, making electric vehicles more competitive. Significant investments in charging infrastructure will alleviate range anxiety and boost consumer confidence. The growing adoption of advanced power electronics, such as SiC and GaN devices, will enhance the efficiency and performance of electric powertrains. Furthermore, strategic collaborations between established automotive companies and specialized EV component suppliers will foster innovation and streamline the development and production of sophisticated electric mobility solutions. The increasing regulatory push for zero-emission vehicles and evolving consumer preferences for eco-friendly transport ensure a sustained and robust market expansion in the coming years.
Electric Powertrain Systems Segmentation
-
1. Application
- 1.1. BEV
- 1.2. HEV/PHEV
-
2. Type
- 2.1. Motor/Generator
- 2.2. Battery
- 2.3. Power Electronics Controller
- 2.4. Converter
- 2.5. Transmission
- 2.6. On-board Charger
Electric Powertrain Systems Segmentation By Geography
-
1. North America
- 1.1. United States
- 1.2. Canada
- 1.3. Mexico
-
2. South America
- 2.1. Brazil
- 2.2. Argentina
- 2.3. Rest of South America
-
3. Europe
- 3.1. United Kingdom
- 3.2. Germany
- 3.3. France
- 3.4. Italy
- 3.5. Spain
- 3.6. Russia
- 3.7. Benelux
- 3.8. Nordics
- 3.9. Rest of Europe
-
4. Middle East & Africa
- 4.1. Turkey
- 4.2. Israel
- 4.3. GCC
- 4.4. North Africa
- 4.5. South Africa
- 4.6. Rest of Middle East & Africa
-
5. Asia Pacific
- 5.1. China
- 5.2. India
- 5.3. Japan
- 5.4. South Korea
- 5.5. ASEAN
- 5.6. Oceania
- 5.7. Rest of Asia Pacific
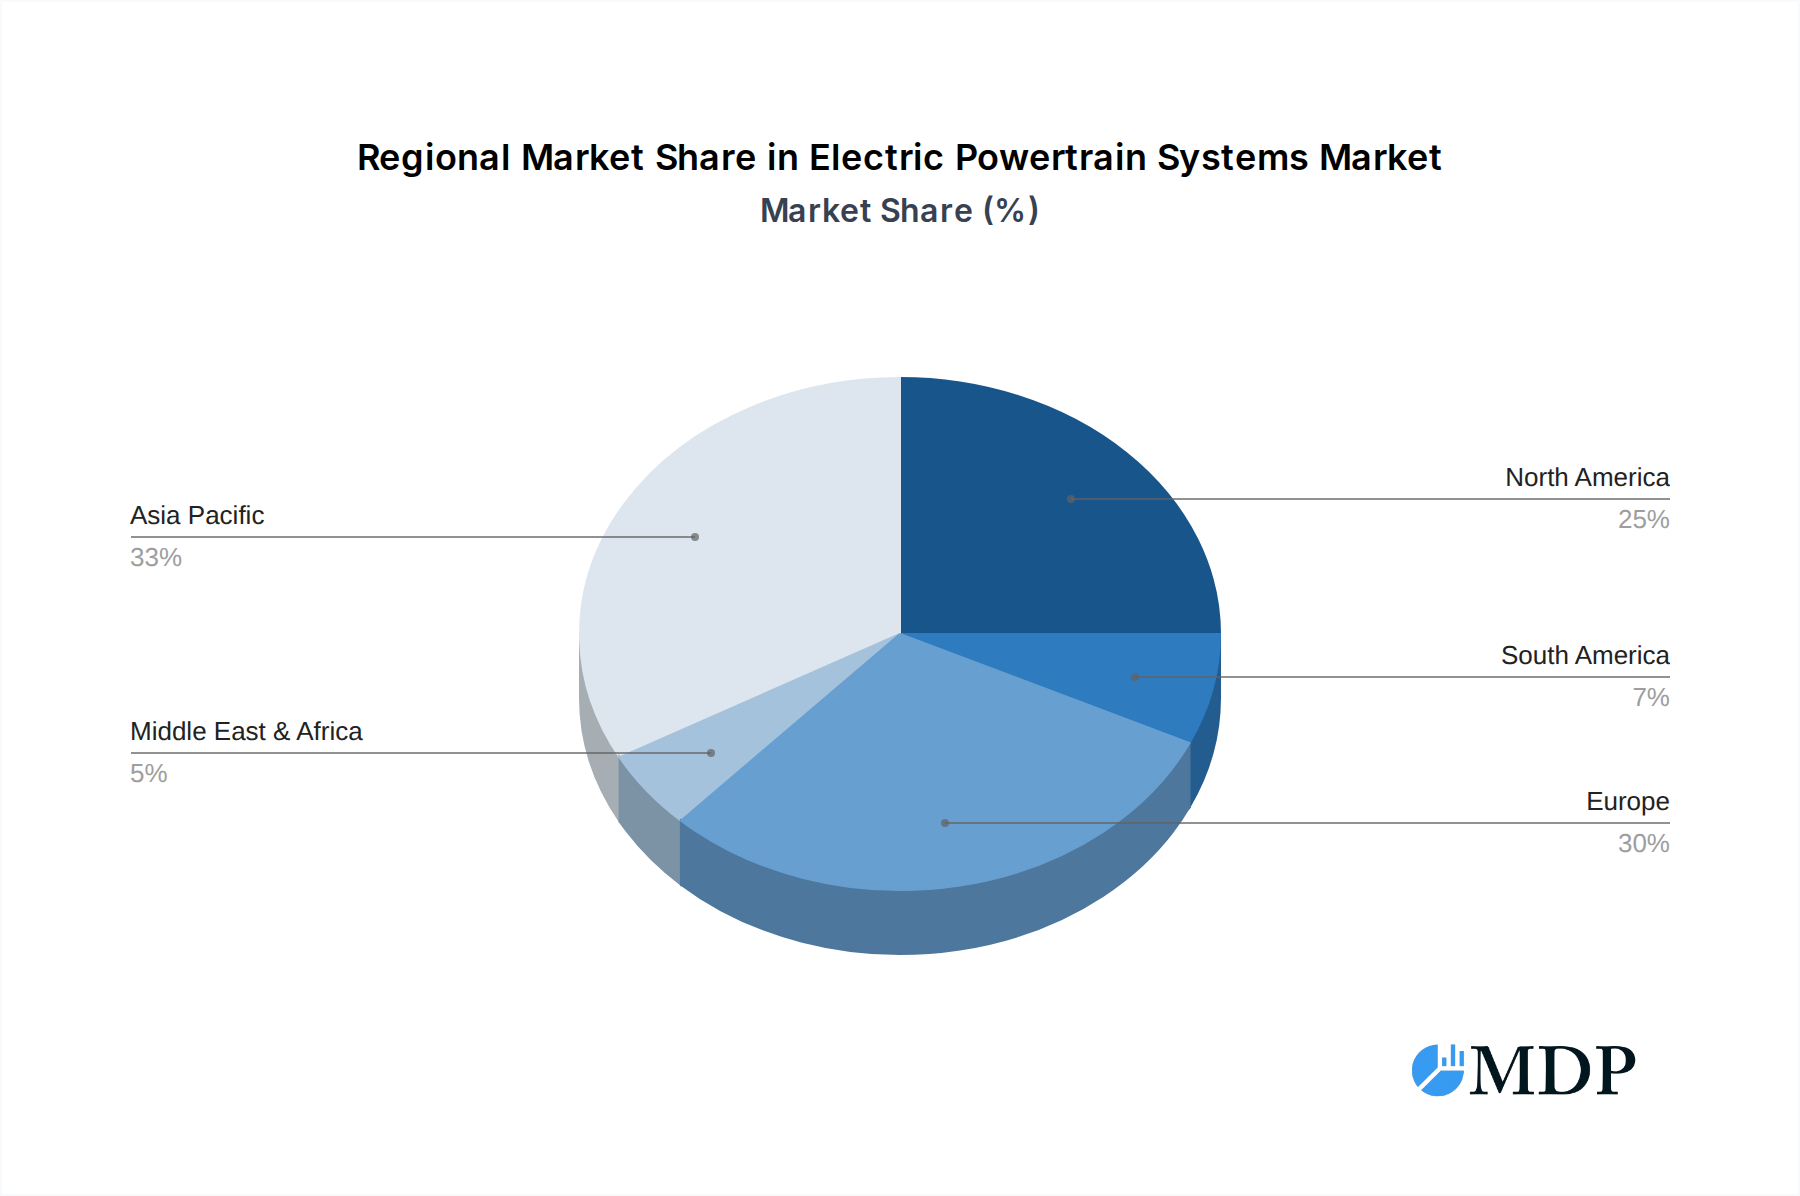
Electric Powertrain Systems Regional Market Share
Geographic Coverage of Electric Powertrain Systems
Electric Powertrain Systems REPORT HIGHLIGHTS
| Aspects | Details |
|---|---|
| Study Period | 2020-2034 |
| Base Year | 2025 |
| Estimated Year | 2026 |
| Forecast Period | 2026-2034 |
| Historical Period | 2020-2025 |
| Growth Rate | CAGR of 12.8% from 2020-2034 |
| Segmentation |
|
Table of Contents
- 1. Introduction
- 1.1. Research Scope
- 1.2. Market Segmentation
- 1.3. Research Methodology
- 1.4. Definitions and Assumptions
- 2. Executive Summary
- 2.1. Introduction
- 3. Market Dynamics
- 3.1. Introduction
- 3.2. Market Drivers
- 3.3. Market Restrains
- 3.4. Market Trends
- 4. Market Factor Analysis
- 4.1. Porters Five Forces
- 4.2. Supply/Value Chain
- 4.3. PESTEL analysis
- 4.4. Market Entropy
- 4.5. Patent/Trademark Analysis
- 5. Global Electric Powertrain Systems Analysis, Insights and Forecast, 2020-2032
- 5.1. Market Analysis, Insights and Forecast - by Application
- 5.1.1. BEV
- 5.1.2. HEV/PHEV
- 5.2. Market Analysis, Insights and Forecast - by Type
- 5.2.1. Motor/Generator
- 5.2.2. Battery
- 5.2.3. Power Electronics Controller
- 5.2.4. Converter
- 5.2.5. Transmission
- 5.2.6. On-board Charger
- 5.3. Market Analysis, Insights and Forecast - by Region
- 5.3.1. North America
- 5.3.2. South America
- 5.3.3. Europe
- 5.3.4. Middle East & Africa
- 5.3.5. Asia Pacific
- 5.1. Market Analysis, Insights and Forecast - by Application
- 6. North America Electric Powertrain Systems Analysis, Insights and Forecast, 2020-2032
- 6.1. Market Analysis, Insights and Forecast - by Application
- 6.1.1. BEV
- 6.1.2. HEV/PHEV
- 6.2. Market Analysis, Insights and Forecast - by Type
- 6.2.1. Motor/Generator
- 6.2.2. Battery
- 6.2.3. Power Electronics Controller
- 6.2.4. Converter
- 6.2.5. Transmission
- 6.2.6. On-board Charger
- 6.1. Market Analysis, Insights and Forecast - by Application
- 7. South America Electric Powertrain Systems Analysis, Insights and Forecast, 2020-2032
- 7.1. Market Analysis, Insights and Forecast - by Application
- 7.1.1. BEV
- 7.1.2. HEV/PHEV
- 7.2. Market Analysis, Insights and Forecast - by Type
- 7.2.1. Motor/Generator
- 7.2.2. Battery
- 7.2.3. Power Electronics Controller
- 7.2.4. Converter
- 7.2.5. Transmission
- 7.2.6. On-board Charger
- 7.1. Market Analysis, Insights and Forecast - by Application
- 8. Europe Electric Powertrain Systems Analysis, Insights and Forecast, 2020-2032
- 8.1. Market Analysis, Insights and Forecast - by Application
- 8.1.1. BEV
- 8.1.2. HEV/PHEV
- 8.2. Market Analysis, Insights and Forecast - by Type
- 8.2.1. Motor/Generator
- 8.2.2. Battery
- 8.2.3. Power Electronics Controller
- 8.2.4. Converter
- 8.2.5. Transmission
- 8.2.6. On-board Charger
- 8.1. Market Analysis, Insights and Forecast - by Application
- 9. Middle East & Africa Electric Powertrain Systems Analysis, Insights and Forecast, 2020-2032
- 9.1. Market Analysis, Insights and Forecast - by Application
- 9.1.1. BEV
- 9.1.2. HEV/PHEV
- 9.2. Market Analysis, Insights and Forecast - by Type
- 9.2.1. Motor/Generator
- 9.2.2. Battery
- 9.2.3. Power Electronics Controller
- 9.2.4. Converter
- 9.2.5. Transmission
- 9.2.6. On-board Charger
- 9.1. Market Analysis, Insights and Forecast - by Application
- 10. Asia Pacific Electric Powertrain Systems Analysis, Insights and Forecast, 2020-2032
- 10.1. Market Analysis, Insights and Forecast - by Application
- 10.1.1. BEV
- 10.1.2. HEV/PHEV
- 10.2. Market Analysis, Insights and Forecast - by Type
- 10.2.1. Motor/Generator
- 10.2.2. Battery
- 10.2.3. Power Electronics Controller
- 10.2.4. Converter
- 10.2.5. Transmission
- 10.2.6. On-board Charger
- 10.1. Market Analysis, Insights and Forecast - by Application
- 11. Competitive Analysis
- 11.1. Global Market Share Analysis 2025
- 11.2. Company Profiles
- 11.2.1 BorgWarner
- 11.2.1.1. Overview
- 11.2.1.2. Products
- 11.2.1.3. SWOT Analysis
- 11.2.1.4. Recent Developments
- 11.2.1.5. Financials (Based on Availability)
- 11.2.2 Mitsubishi Electric Corp
- 11.2.2.1. Overview
- 11.2.2.2. Products
- 11.2.2.3. SWOT Analysis
- 11.2.2.4. Recent Developments
- 11.2.2.5. Financials (Based on Availability)
- 11.2.3 Schaeffler AG
- 11.2.3.1. Overview
- 11.2.3.2. Products
- 11.2.3.3. SWOT Analysis
- 11.2.3.4. Recent Developments
- 11.2.3.5. Financials (Based on Availability)
- 11.2.4 ZF Friedrichshafen AG
- 11.2.4.1. Overview
- 11.2.4.2. Products
- 11.2.4.3. SWOT Analysis
- 11.2.4.4. Recent Developments
- 11.2.4.5. Financials (Based on Availability)
- 11.2.5 Magna International Inc.
- 11.2.5.1. Overview
- 11.2.5.2. Products
- 11.2.5.3. SWOT Analysis
- 11.2.5.4. Recent Developments
- 11.2.5.5. Financials (Based on Availability)
- 11.2.6 Porsche Engineering
- 11.2.6.1. Overview
- 11.2.6.2. Products
- 11.2.6.3. SWOT Analysis
- 11.2.6.4. Recent Developments
- 11.2.6.5. Financials (Based on Availability)
- 11.2.7 Dana TM4
- 11.2.7.1. Overview
- 11.2.7.2. Products
- 11.2.7.3. SWOT Analysis
- 11.2.7.4. Recent Developments
- 11.2.7.5. Financials (Based on Availability)
- 11.2.8 Hitachi Automotive Systems
- 11.2.8.1. Overview
- 11.2.8.2. Products
- 11.2.8.3. SWOT Analysis
- 11.2.8.4. Recent Developments
- 11.2.8.5. Financials (Based on Availability)
- 11.2.9 Nissan Motor
- 11.2.9.1. Overview
- 11.2.9.2. Products
- 11.2.9.3. SWOT Analysis
- 11.2.9.4. Recent Developments
- 11.2.9.5. Financials (Based on Availability)
- 11.2.10 Robert Bosch GmbH
- 11.2.10.1. Overview
- 11.2.10.2. Products
- 11.2.10.3. SWOT Analysis
- 11.2.10.4. Recent Developments
- 11.2.10.5. Financials (Based on Availability)
- 11.2.1 BorgWarner
List of Figures
- Figure 1: Global Electric Powertrain Systems Revenue Breakdown (undefined, %) by Region 2025 & 2033
- Figure 2: North America Electric Powertrain Systems Revenue (undefined), by Application 2025 & 2033
- Figure 3: North America Electric Powertrain Systems Revenue Share (%), by Application 2025 & 2033
- Figure 4: North America Electric Powertrain Systems Revenue (undefined), by Type 2025 & 2033
- Figure 5: North America Electric Powertrain Systems Revenue Share (%), by Type 2025 & 2033
- Figure 6: North America Electric Powertrain Systems Revenue (undefined), by Country 2025 & 2033
- Figure 7: North America Electric Powertrain Systems Revenue Share (%), by Country 2025 & 2033
- Figure 8: South America Electric Powertrain Systems Revenue (undefined), by Application 2025 & 2033
- Figure 9: South America Electric Powertrain Systems Revenue Share (%), by Application 2025 & 2033
- Figure 10: South America Electric Powertrain Systems Revenue (undefined), by Type 2025 & 2033
- Figure 11: South America Electric Powertrain Systems Revenue Share (%), by Type 2025 & 2033
- Figure 12: South America Electric Powertrain Systems Revenue (undefined), by Country 2025 & 2033
- Figure 13: South America Electric Powertrain Systems Revenue Share (%), by Country 2025 & 2033
- Figure 14: Europe Electric Powertrain Systems Revenue (undefined), by Application 2025 & 2033
- Figure 15: Europe Electric Powertrain Systems Revenue Share (%), by Application 2025 & 2033
- Figure 16: Europe Electric Powertrain Systems Revenue (undefined), by Type 2025 & 2033
- Figure 17: Europe Electric Powertrain Systems Revenue Share (%), by Type 2025 & 2033
- Figure 18: Europe Electric Powertrain Systems Revenue (undefined), by Country 2025 & 2033
- Figure 19: Europe Electric Powertrain Systems Revenue Share (%), by Country 2025 & 2033
- Figure 20: Middle East & Africa Electric Powertrain Systems Revenue (undefined), by Application 2025 & 2033
- Figure 21: Middle East & Africa Electric Powertrain Systems Revenue Share (%), by Application 2025 & 2033
- Figure 22: Middle East & Africa Electric Powertrain Systems Revenue (undefined), by Type 2025 & 2033
- Figure 23: Middle East & Africa Electric Powertrain Systems Revenue Share (%), by Type 2025 & 2033
- Figure 24: Middle East & Africa Electric Powertrain Systems Revenue (undefined), by Country 2025 & 2033
- Figure 25: Middle East & Africa Electric Powertrain Systems Revenue Share (%), by Country 2025 & 2033
- Figure 26: Asia Pacific Electric Powertrain Systems Revenue (undefined), by Application 2025 & 2033
- Figure 27: Asia Pacific Electric Powertrain Systems Revenue Share (%), by Application 2025 & 2033
- Figure 28: Asia Pacific Electric Powertrain Systems Revenue (undefined), by Type 2025 & 2033
- Figure 29: Asia Pacific Electric Powertrain Systems Revenue Share (%), by Type 2025 & 2033
- Figure 30: Asia Pacific Electric Powertrain Systems Revenue (undefined), by Country 2025 & 2033
- Figure 31: Asia Pacific Electric Powertrain Systems Revenue Share (%), by Country 2025 & 2033
List of Tables
- Table 1: Global Electric Powertrain Systems Revenue undefined Forecast, by Application 2020 & 2033
- Table 2: Global Electric Powertrain Systems Revenue undefined Forecast, by Type 2020 & 2033
- Table 3: Global Electric Powertrain Systems Revenue undefined Forecast, by Region 2020 & 2033
- Table 4: Global Electric Powertrain Systems Revenue undefined Forecast, by Application 2020 & 2033
- Table 5: Global Electric Powertrain Systems Revenue undefined Forecast, by Type 2020 & 2033
- Table 6: Global Electric Powertrain Systems Revenue undefined Forecast, by Country 2020 & 2033
- Table 7: United States Electric Powertrain Systems Revenue (undefined) Forecast, by Application 2020 & 2033
- Table 8: Canada Electric Powertrain Systems Revenue (undefined) Forecast, by Application 2020 & 2033
- Table 9: Mexico Electric Powertrain Systems Revenue (undefined) Forecast, by Application 2020 & 2033
- Table 10: Global Electric Powertrain Systems Revenue undefined Forecast, by Application 2020 & 2033
- Table 11: Global Electric Powertrain Systems Revenue undefined Forecast, by Type 2020 & 2033
- Table 12: Global Electric Powertrain Systems Revenue undefined Forecast, by Country 2020 & 2033
- Table 13: Brazil Electric Powertrain Systems Revenue (undefined) Forecast, by Application 2020 & 2033
- Table 14: Argentina Electric Powertrain Systems Revenue (undefined) Forecast, by Application 2020 & 2033
- Table 15: Rest of South America Electric Powertrain Systems Revenue (undefined) Forecast, by Application 2020 & 2033
- Table 16: Global Electric Powertrain Systems Revenue undefined Forecast, by Application 2020 & 2033
- Table 17: Global Electric Powertrain Systems Revenue undefined Forecast, by Type 2020 & 2033
- Table 18: Global Electric Powertrain Systems Revenue undefined Forecast, by Country 2020 & 2033
- Table 19: United Kingdom Electric Powertrain Systems Revenue (undefined) Forecast, by Application 2020 & 2033
- Table 20: Germany Electric Powertrain Systems Revenue (undefined) Forecast, by Application 2020 & 2033
- Table 21: France Electric Powertrain Systems Revenue (undefined) Forecast, by Application 2020 & 2033
- Table 22: Italy Electric Powertrain Systems Revenue (undefined) Forecast, by Application 2020 & 2033
- Table 23: Spain Electric Powertrain Systems Revenue (undefined) Forecast, by Application 2020 & 2033
- Table 24: Russia Electric Powertrain Systems Revenue (undefined) Forecast, by Application 2020 & 2033
- Table 25: Benelux Electric Powertrain Systems Revenue (undefined) Forecast, by Application 2020 & 2033
- Table 26: Nordics Electric Powertrain Systems Revenue (undefined) Forecast, by Application 2020 & 2033
- Table 27: Rest of Europe Electric Powertrain Systems Revenue (undefined) Forecast, by Application 2020 & 2033
- Table 28: Global Electric Powertrain Systems Revenue undefined Forecast, by Application 2020 & 2033
- Table 29: Global Electric Powertrain Systems Revenue undefined Forecast, by Type 2020 & 2033
- Table 30: Global Electric Powertrain Systems Revenue undefined Forecast, by Country 2020 & 2033
- Table 31: Turkey Electric Powertrain Systems Revenue (undefined) Forecast, by Application 2020 & 2033
- Table 32: Israel Electric Powertrain Systems Revenue (undefined) Forecast, by Application 2020 & 2033
- Table 33: GCC Electric Powertrain Systems Revenue (undefined) Forecast, by Application 2020 & 2033
- Table 34: North Africa Electric Powertrain Systems Revenue (undefined) Forecast, by Application 2020 & 2033
- Table 35: South Africa Electric Powertrain Systems Revenue (undefined) Forecast, by Application 2020 & 2033
- Table 36: Rest of Middle East & Africa Electric Powertrain Systems Revenue (undefined) Forecast, by Application 2020 & 2033
- Table 37: Global Electric Powertrain Systems Revenue undefined Forecast, by Application 2020 & 2033
- Table 38: Global Electric Powertrain Systems Revenue undefined Forecast, by Type 2020 & 2033
- Table 39: Global Electric Powertrain Systems Revenue undefined Forecast, by Country 2020 & 2033
- Table 40: China Electric Powertrain Systems Revenue (undefined) Forecast, by Application 2020 & 2033
- Table 41: India Electric Powertrain Systems Revenue (undefined) Forecast, by Application 2020 & 2033
- Table 42: Japan Electric Powertrain Systems Revenue (undefined) Forecast, by Application 2020 & 2033
- Table 43: South Korea Electric Powertrain Systems Revenue (undefined) Forecast, by Application 2020 & 2033
- Table 44: ASEAN Electric Powertrain Systems Revenue (undefined) Forecast, by Application 2020 & 2033
- Table 45: Oceania Electric Powertrain Systems Revenue (undefined) Forecast, by Application 2020 & 2033
- Table 46: Rest of Asia Pacific Electric Powertrain Systems Revenue (undefined) Forecast, by Application 2020 & 2033
Frequently Asked Questions
1. What is the projected Compound Annual Growth Rate (CAGR) of the Electric Powertrain Systems?
The projected CAGR is approximately 12.8%.
2. Which companies are prominent players in the Electric Powertrain Systems?
Key companies in the market include BorgWarner, Mitsubishi Electric Corp, Schaeffler AG, ZF Friedrichshafen AG, Magna International Inc., Porsche Engineering, Dana TM4, Hitachi Automotive Systems, Nissan Motor, Robert Bosch GmbH.
3. What are the main segments of the Electric Powertrain Systems?
The market segments include Application, Type.
4. Can you provide details about the market size?
The market size is estimated to be USD XXX N/A as of 2022.
5. What are some drivers contributing to market growth?
N/A
6. What are the notable trends driving market growth?
N/A
7. Are there any restraints impacting market growth?
N/A
8. Can you provide examples of recent developments in the market?
N/A
9. What pricing options are available for accessing the report?
Pricing options include single-user, multi-user, and enterprise licenses priced at USD 3950.00, USD 5925.00, and USD 7900.00 respectively.
10. Is the market size provided in terms of value or volume?
The market size is provided in terms of value, measured in N/A.
11. Are there any specific market keywords associated with the report?
Yes, the market keyword associated with the report is "Electric Powertrain Systems," which aids in identifying and referencing the specific market segment covered.
12. How do I determine which pricing option suits my needs best?
The pricing options vary based on user requirements and access needs. Individual users may opt for single-user licenses, while businesses requiring broader access may choose multi-user or enterprise licenses for cost-effective access to the report.
13. Are there any additional resources or data provided in the Electric Powertrain Systems report?
While the report offers comprehensive insights, it's advisable to review the specific contents or supplementary materials provided to ascertain if additional resources or data are available.
14. How can I stay updated on further developments or reports in the Electric Powertrain Systems?
To stay informed about further developments, trends, and reports in the Electric Powertrain Systems, consider subscribing to industry newsletters, following relevant companies and organizations, or regularly checking reputable industry news sources and publications.
Methodology
Step 1 - Identification of Relevant Samples Size from Population Database


Step 2 - Approaches for Defining Global Market Size (Value, Volume* & Price*)

Note*: In applicable scenarios
Step 3 - Data Sources
Primary Research
- Web Analytics
- Survey Reports
- Research Institute
- Latest Research Reports
- Opinion Leaders
Secondary Research
- Annual Reports
- White Paper
- Latest Press Release
- Industry Association
- Paid Database
- Investor Presentations

Step 4 - Data Triangulation
Involves using different sources of information in order to increase the validity of a study
These sources are likely to be stakeholders in a program - participants, other researchers, program staff, other community members, and so on.
Then we put all data in single framework & apply various statistical tools to find out the dynamic on the market.
During the analysis stage, feedback from the stakeholder groups would be compared to determine areas of agreement as well as areas of divergence