

Key Insights
The global Electric Driven Water Pump (EWP) market is poised for substantial growth, projected to reach USD 61,876.6 million in 2025. This expansion is driven by the escalating demand for enhanced fuel efficiency and reduced emissions across the automotive industry. The significant shift towards New Energy Vehicles (NEVs), including electric and hybrid models, is a primary catalyst, as these vehicles rely heavily on EWPs for optimal thermal management. Furthermore, advancements in EWP technology, leading to improved performance, durability, and integration capabilities, are contributing to market acceleration. The market's growth trajectory is further bolstered by increasingly stringent environmental regulations worldwide, compelling automakers to adopt more sophisticated and energy-efficient cooling systems. The market is segmented into 12V EWP and 24V EWP, catering to diverse automotive applications, from conventional fuel vehicles to the advanced requirements of NEVs. Key players are investing heavily in research and development to innovate and capture a larger market share.
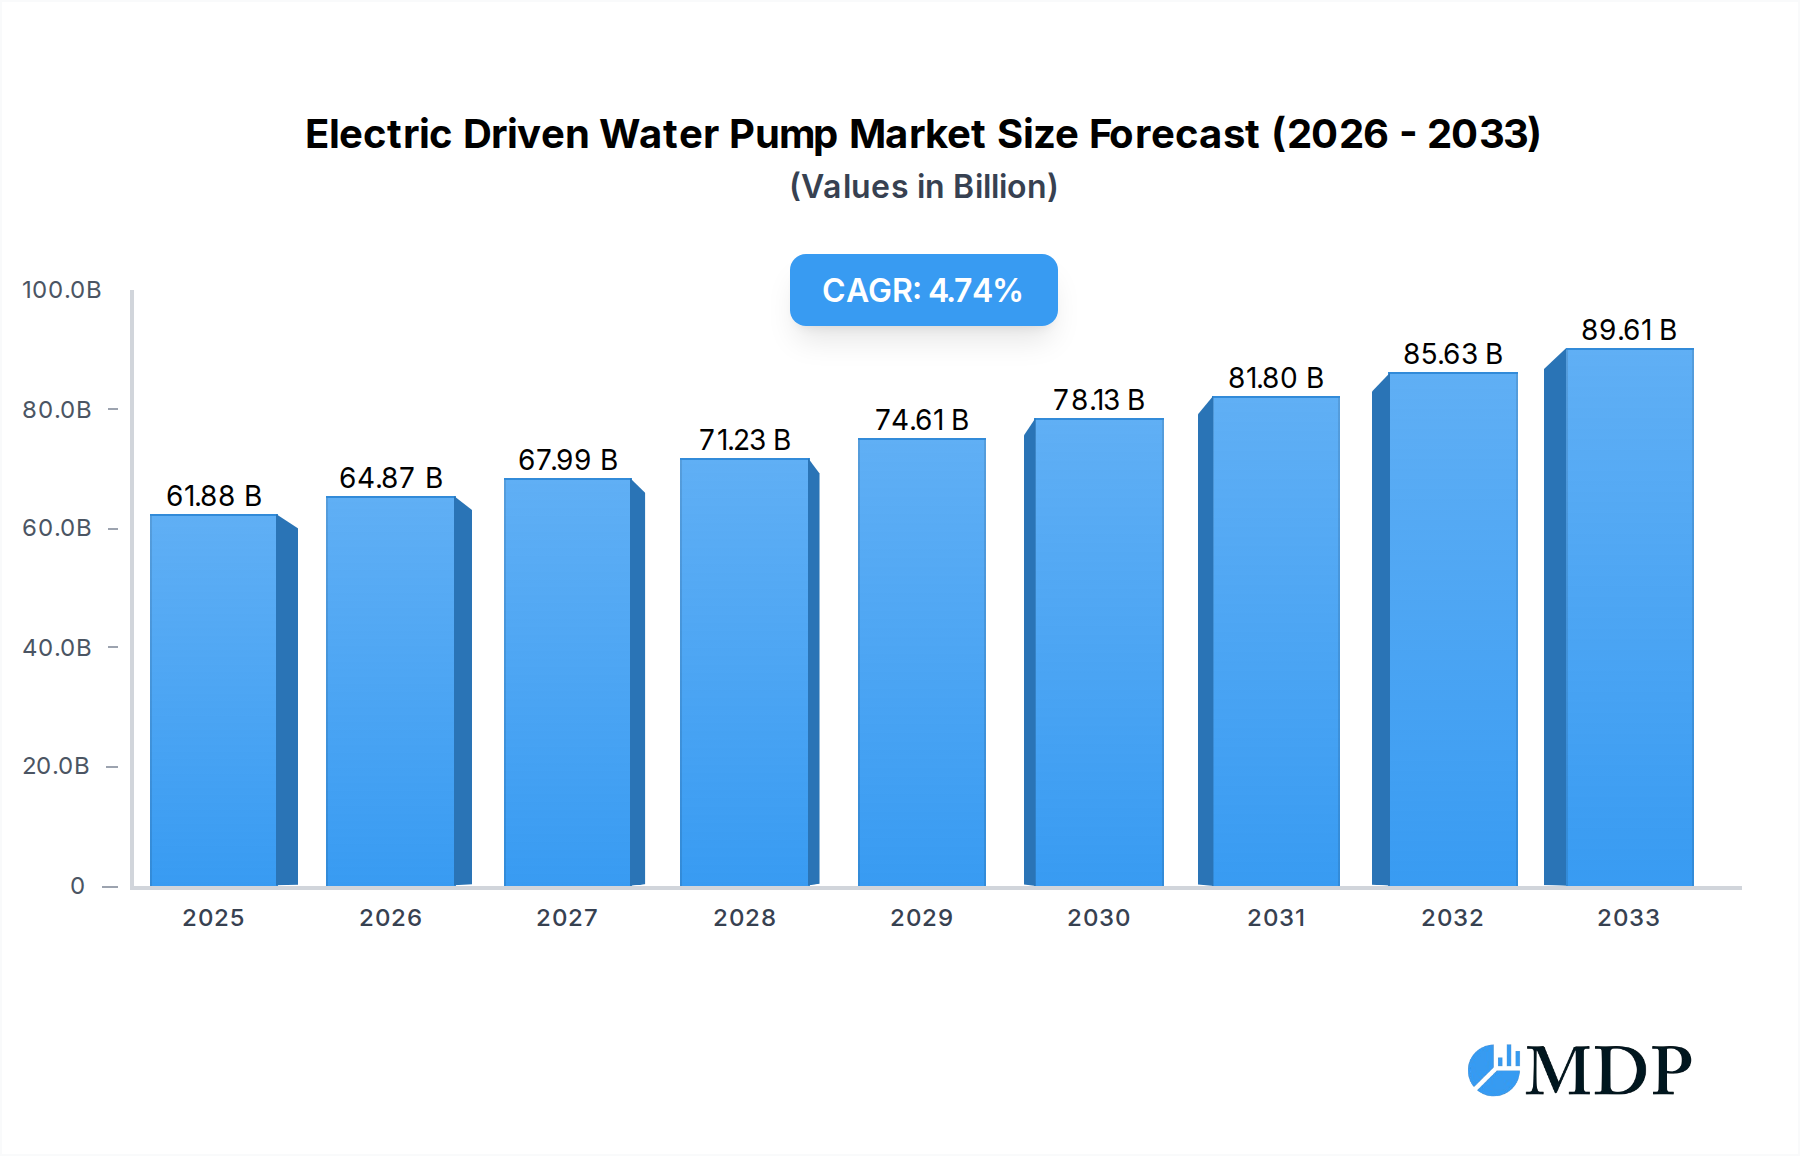
Electric Driven Water Pump Market Size (In Billion)
The market is forecast to witness a Compound Annual Growth Rate (CAGR) of 4.8% from 2025 to 2033. This steady growth indicates a robust and sustainable market expansion. The key drivers fueling this growth include the increasing production of NEVs, a growing consumer preference for fuel-efficient vehicles, and supportive government initiatives promoting cleaner transportation. While the market benefits from these positive trends, certain restraints, such as the initial higher cost of EWPs compared to traditional mechanical water pumps and the need for greater infrastructure development for NEVs, could pose challenges. However, the long-term benefits of improved performance, reduced maintenance, and enhanced thermal management are expected to outweigh these initial hurdles. The market's geographical distribution shows significant potential in Asia Pacific, particularly China, followed by Europe and North America, owing to their advanced automotive manufacturing bases and strong adoption rates of NEVs.

Electric Driven Water Pump Company Market Share
Electric Driven Water Pump Market Report: Comprehensive Analysis and Future Outlook (2019–2033)
Unlock critical insights into the rapidly evolving Electric Driven Water Pump (EWP) market with this in-depth report. Covering the period from 2019 to 2033, with a base and estimated year of 2025, this analysis provides actionable intelligence for stakeholders across the automotive and industrial sectors. We delve into market dynamics, industry trends, leading segments, product innovations, growth drivers, challenges, and emerging opportunities. This report is meticulously crafted to maximize search visibility using high-traffic keywords, ensuring it reaches the right audience of industry professionals, investors, and strategists.
Electric Driven Water Pump Market Dynamics & Concentration
The Electric Driven Water Pump market is characterized by a moderate concentration, with a few key players holding significant market share, while a growing number of regional and specialized manufacturers contribute to a dynamic competitive landscape. Innovation remains a primary driver, fueled by the increasing demand for enhanced thermal management systems in both fuel vehicles and new energy vehicles. Regulatory frameworks, particularly those mandating stricter emission standards and promoting electric mobility, are significantly shaping market direction. Product substitutes, such as mechanically driven water pumps, are steadily losing ground as the efficiency and control benefits of EWPs become more apparent. End-user trends are heavily influenced by the accelerating shift towards electrification, with new energy vehicles representing a substantial growth avenue. Mergers and acquisitions (M&A) activities are anticipated to increase as larger players seek to consolidate their market position and acquire new technologies. The estimated total M&A deal count for the forecast period is expected to reach xx, with market share consolidation estimated to be around xx% for the top 5 players by 2033.
Electric Driven Water Pump Industry Trends & Analysis
The global Electric Driven Water Pump (EWP) market is poised for substantial growth, driven by a confluence of technological advancements and evolving automotive trends. The escalating adoption of electric vehicles (EVs) and hybrid electric vehicles (HEVs) is the primary growth engine, necessitating advanced thermal management solutions for battery packs, electric motors, and power electronics. EWPs offer superior control and efficiency compared to traditional belt-driven pumps, enabling precise temperature regulation crucial for optimal EV performance and longevity. Furthermore, stringent emission regulations worldwide are compelling automakers to enhance engine cooling efficiency in internal combustion engine (ICE) vehicles, thereby bolstering demand for EWPs in the fuel vehicle segment as well.
Technological disruptions are centered around the development of more compact, energy-efficient, and intelligent EWPs. Integration of advanced sensors and control algorithms allows for real-time performance monitoring and predictive maintenance, enhancing reliability and user experience. The increasing use of lightweight and durable materials in EWP manufacturing also contributes to overall vehicle fuel efficiency. Consumer preferences are shifting towards quieter, more refined vehicle operation, a benefit that EWPs contribute to by eliminating the noise and vibration associated with belt-driven systems. The competitive dynamics of the EWP industry are intensifying, with established automotive component suppliers investing heavily in research and development to maintain their market leadership. New entrants, particularly from the electronics and specialized motor manufacturing sectors, are also emerging, bringing fresh perspectives and innovative solutions. The market penetration of EWPs in new energy vehicles is projected to reach xx% by 2033, while the market penetration in fuel vehicles is expected to be around xx%. The Compound Annual Growth Rate (CAGR) for the EWP market is estimated at a robust xx% over the forecast period of 2025–2033.
Leading Markets & Segments in Electric Driven Water Pump
The New Energy Vehicle (NEV) segment is emerging as the dominant market for Electric Driven Water Pumps (EWPs), driven by the global surge in electric and hybrid vehicle production. Within this segment, the 24V EWP variant is gaining significant traction due to its ability to handle higher power demands and more complex thermal management systems required by advanced EV powertrains. The primary drivers for this dominance include aggressive government policies and subsidies promoting EV adoption, substantial investments in charging infrastructure, and growing consumer environmental awareness. Economic policies in major automotive markets, such as China, Europe, and North America, are actively incentivizing the transition to electric mobility, directly translating into increased demand for EWPs.
The dominance of the NEV segment is further reinforced by technological advancements in battery technology and electric motor efficiency, which necessitate sophisticated thermal management to maintain optimal operating temperatures. The inherent advantages of EWPs – precise control, independent operation from the engine, and energy efficiency – make them indispensable for these applications. While Fuel Vehicles continue to represent a significant market, the growth trajectory is more moderate compared to NEVs. The 12V EWP remains prevalent in many traditional ICE vehicle applications where its performance is adequate and cost-effectiveness is a key consideration. However, the long-term outlook clearly favors the higher voltage and more advanced EWP solutions required by the electrified automotive landscape. Key drivers in leading regions include favorable regulatory frameworks such as fleet emission standards, ongoing research and development in battery cooling technologies, and the establishment of robust supply chains for EV components. The projected market share of the NEV segment is estimated to be xx% by 2033.
Electric Driven Water Pump Product Developments
Recent product developments in the Electric Driven Water Pump (EWP) sector highlight a strong focus on enhanced efficiency, miniaturization, and intelligent control. Manufacturers are innovating with brushless DC motors for improved durability and energy savings, alongside advanced impeller designs for optimized coolant flow. Integrated sensors and sophisticated control modules are enabling predictive diagnostics and adaptive cooling strategies, thereby maximizing system performance and lifespan. These innovations offer a competitive advantage by meeting the increasingly stringent thermal management requirements of modern vehicle architectures, particularly for electric and hybrid powertrains, and enhancing overall vehicle efficiency and reliability.
Key Drivers of Electric Driven Water Pump Growth
The Electric Driven Water Pump (EWP) market is propelled by several significant growth drivers. The accelerating global shift towards electric and hybrid vehicles is paramount, necessitating advanced thermal management for batteries and powertrains. Stringent emissions regulations worldwide are forcing automakers to improve engine cooling efficiency in conventional vehicles, driving EWP adoption. Technological advancements in motor efficiency and control systems are making EWPs more competitive and adaptable. Furthermore, the demand for improved vehicle performance and reliability, coupled with consumer preferences for quieter operation, directly benefits EWP technology.
Challenges in the Electric Driven Water Pump Market
Despite robust growth, the Electric Driven Water Pump (EWP) market faces several challenges. High initial costs compared to conventional pumps can be a barrier, especially in price-sensitive markets. Complex integration into existing vehicle architectures requires significant engineering effort and investment from automakers. Supply chain vulnerabilities, particularly for critical electronic components, can lead to production delays and cost fluctuations. Intensifying competition from both established players and new entrants exerts pressure on pricing and margins. Furthermore, navigating diverse and evolving regulatory landscapes across different regions adds complexity to market entry and product development.
Emerging Opportunities in Electric Driven Water Pump
Emerging opportunities in the Electric Driven Water Pump (EWP) market are largely centered around technological innovation and market expansion. The continuous development of advanced battery cooling systems for next-generation EVs presents a significant growth avenue. The increasing adoption of intelligent thermal management solutions with predictive analytics and self-diagnostic capabilities offers value-added opportunities. Strategic partnerships between EWP manufacturers and battery producers, EV manufacturers, and Tier 1 suppliers are crucial for co-development and market penetration. Furthermore, exploring applications beyond automotive, such as in industrial cooling systems and renewable energy technologies, can unlock new revenue streams and foster long-term growth.
Leading Players in the Electric Driven Water Pump Sector
- Bosch
- Continental
- Aisin
- Rheinmetall Automotive
- Gates
- Hanon Systems
- MAHLE
- GMB
- Buehler Motor
- Valeo
- Feilong Auto Components
- Sanhua Automotive Components
- Yinlun
- Jiangsu Leili Motor
Key Milestones in Electric Driven Water Pump Industry
- 2019: Increased focus on advanced thermal management for EV battery packs.
- 2020: Introduction of more energy-efficient brushless DC motor technology in EWPs.
- 2021: Growing integration of EWPs in hybrid vehicle powertrains.
- 2022: Significant investment by major automotive suppliers in EWP R&D and production capacity.
- 2023: Rise in adoption of intelligent control systems for predictive maintenance of EWPs.
- 2024: Emerging trends in EWP miniaturization and lightweight design for improved vehicle packaging.
- 2025: Forecasted significant acceleration in EWP demand driven by new EV model launches globally.
- 2026-2033: Anticipated continuous innovation in EWP technology, including advanced sensor integration and AI-driven thermal management solutions.
Strategic Outlook for Electric Driven Water Pump Market
The strategic outlook for the Electric Driven Water Pump (EWP) market is exceptionally positive, fueled by the unstoppable momentum of vehicle electrification. Growth accelerators include the sustained demand from the new energy vehicle segment, coupled with an increasing recognition of EWP benefits in optimizing conventional engine performance and efficiency. Companies that focus on continuous innovation in areas like smart control, energy efficiency, and thermal management integration will be well-positioned to capture market share. Strategic partnerships and collaborations with EV manufacturers and battery developers are crucial for staying ahead of technological curves and ensuring seamless integration into future vehicle architectures. The market's trajectory indicates a strong and sustained growth phase, presenting significant opportunities for both established and emerging players.
Electric Driven Water Pump Segmentation
-
1. Application
- 1.1. Fuel Vehicle
- 1.2. New Energy Vehicle
-
2. Types
- 2.1. 12V EWP
- 2.2. 24V EWP
Electric Driven Water Pump Segmentation By Geography
-
1. North America
- 1.1. United States
- 1.2. Canada
- 1.3. Mexico
-
2. South America
- 2.1. Brazil
- 2.2. Argentina
- 2.3. Rest of South America
-
3. Europe
- 3.1. United Kingdom
- 3.2. Germany
- 3.3. France
- 3.4. Italy
- 3.5. Spain
- 3.6. Russia
- 3.7. Benelux
- 3.8. Nordics
- 3.9. Rest of Europe
-
4. Middle East & Africa
- 4.1. Turkey
- 4.2. Israel
- 4.3. GCC
- 4.4. North Africa
- 4.5. South Africa
- 4.6. Rest of Middle East & Africa
-
5. Asia Pacific
- 5.1. China
- 5.2. India
- 5.3. Japan
- 5.4. South Korea
- 5.5. ASEAN
- 5.6. Oceania
- 5.7. Rest of Asia Pacific
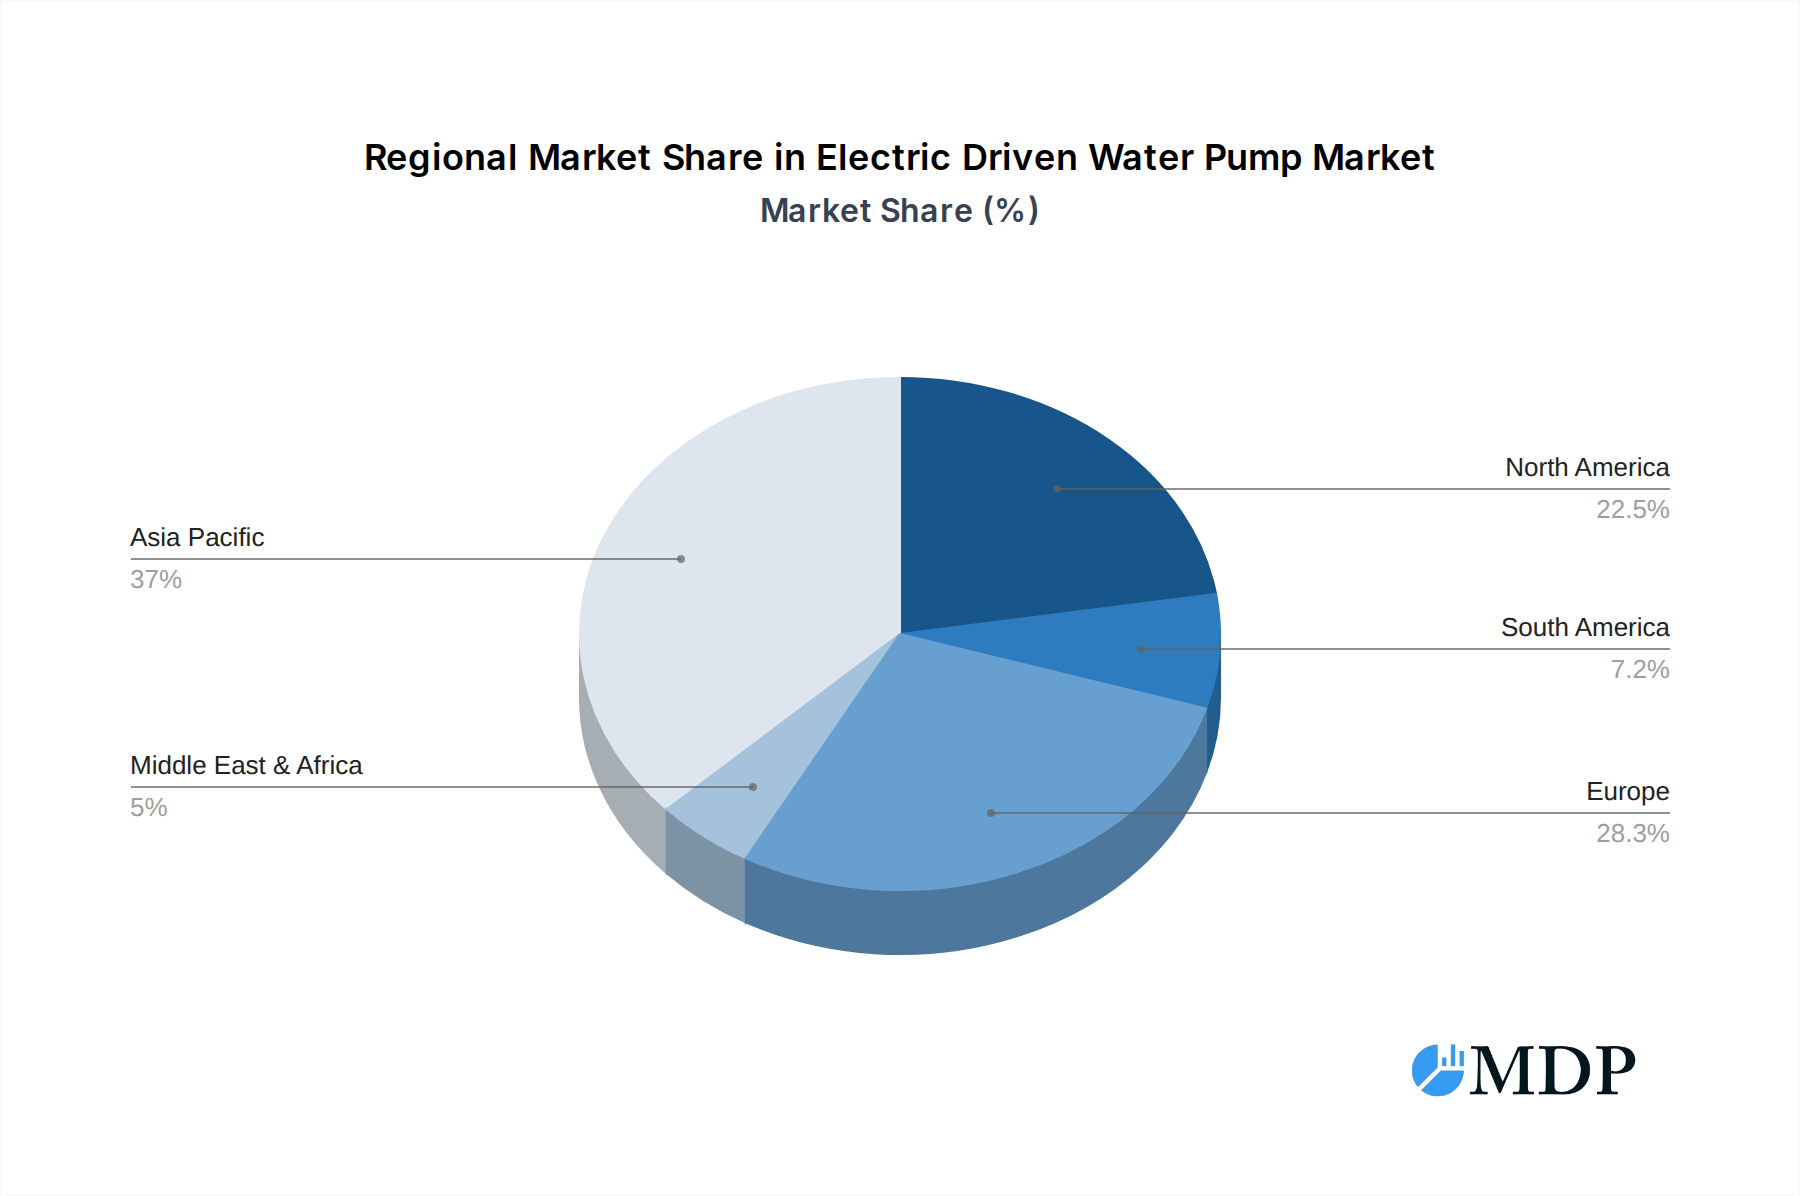
Electric Driven Water Pump Regional Market Share
Geographic Coverage of Electric Driven Water Pump
Electric Driven Water Pump REPORT HIGHLIGHTS
| Aspects | Details |
|---|---|
| Study Period | 2020-2034 |
| Base Year | 2025 |
| Estimated Year | 2026 |
| Forecast Period | 2026-2034 |
| Historical Period | 2020-2025 |
| Growth Rate | CAGR of 4.8% from 2020-2034 |
| Segmentation |
|
Table of Contents
- 1. Introduction
- 1.1. Research Scope
- 1.2. Market Segmentation
- 1.3. Research Methodology
- 1.4. Definitions and Assumptions
- 2. Executive Summary
- 2.1. Introduction
- 3. Market Dynamics
- 3.1. Introduction
- 3.2. Market Drivers
- 3.3. Market Restrains
- 3.4. Market Trends
- 4. Market Factor Analysis
- 4.1. Porters Five Forces
- 4.2. Supply/Value Chain
- 4.3. PESTEL analysis
- 4.4. Market Entropy
- 4.5. Patent/Trademark Analysis
- 5. Global Electric Driven Water Pump Analysis, Insights and Forecast, 2020-2032
- 5.1. Market Analysis, Insights and Forecast - by Application
- 5.1.1. Fuel Vehicle
- 5.1.2. New Energy Vehicle
- 5.2. Market Analysis, Insights and Forecast - by Types
- 5.2.1. 12V EWP
- 5.2.2. 24V EWP
- 5.3. Market Analysis, Insights and Forecast - by Region
- 5.3.1. North America
- 5.3.2. South America
- 5.3.3. Europe
- 5.3.4. Middle East & Africa
- 5.3.5. Asia Pacific
- 5.1. Market Analysis, Insights and Forecast - by Application
- 6. North America Electric Driven Water Pump Analysis, Insights and Forecast, 2020-2032
- 6.1. Market Analysis, Insights and Forecast - by Application
- 6.1.1. Fuel Vehicle
- 6.1.2. New Energy Vehicle
- 6.2. Market Analysis, Insights and Forecast - by Types
- 6.2.1. 12V EWP
- 6.2.2. 24V EWP
- 6.1. Market Analysis, Insights and Forecast - by Application
- 7. South America Electric Driven Water Pump Analysis, Insights and Forecast, 2020-2032
- 7.1. Market Analysis, Insights and Forecast - by Application
- 7.1.1. Fuel Vehicle
- 7.1.2. New Energy Vehicle
- 7.2. Market Analysis, Insights and Forecast - by Types
- 7.2.1. 12V EWP
- 7.2.2. 24V EWP
- 7.1. Market Analysis, Insights and Forecast - by Application
- 8. Europe Electric Driven Water Pump Analysis, Insights and Forecast, 2020-2032
- 8.1. Market Analysis, Insights and Forecast - by Application
- 8.1.1. Fuel Vehicle
- 8.1.2. New Energy Vehicle
- 8.2. Market Analysis, Insights and Forecast - by Types
- 8.2.1. 12V EWP
- 8.2.2. 24V EWP
- 8.1. Market Analysis, Insights and Forecast - by Application
- 9. Middle East & Africa Electric Driven Water Pump Analysis, Insights and Forecast, 2020-2032
- 9.1. Market Analysis, Insights and Forecast - by Application
- 9.1.1. Fuel Vehicle
- 9.1.2. New Energy Vehicle
- 9.2. Market Analysis, Insights and Forecast - by Types
- 9.2.1. 12V EWP
- 9.2.2. 24V EWP
- 9.1. Market Analysis, Insights and Forecast - by Application
- 10. Asia Pacific Electric Driven Water Pump Analysis, Insights and Forecast, 2020-2032
- 10.1. Market Analysis, Insights and Forecast - by Application
- 10.1.1. Fuel Vehicle
- 10.1.2. New Energy Vehicle
- 10.2. Market Analysis, Insights and Forecast - by Types
- 10.2.1. 12V EWP
- 10.2.2. 24V EWP
- 10.1. Market Analysis, Insights and Forecast - by Application
- 11. Competitive Analysis
- 11.1. Global Market Share Analysis 2025
- 11.2. Company Profiles
- 11.2.1 Bosch
- 11.2.1.1. Overview
- 11.2.1.2. Products
- 11.2.1.3. SWOT Analysis
- 11.2.1.4. Recent Developments
- 11.2.1.5. Financials (Based on Availability)
- 11.2.2 Continental
- 11.2.2.1. Overview
- 11.2.2.2. Products
- 11.2.2.3. SWOT Analysis
- 11.2.2.4. Recent Developments
- 11.2.2.5. Financials (Based on Availability)
- 11.2.3 Aisin
- 11.2.3.1. Overview
- 11.2.3.2. Products
- 11.2.3.3. SWOT Analysis
- 11.2.3.4. Recent Developments
- 11.2.3.5. Financials (Based on Availability)
- 11.2.4 Rheinmetall Automotive
- 11.2.4.1. Overview
- 11.2.4.2. Products
- 11.2.4.3. SWOT Analysis
- 11.2.4.4. Recent Developments
- 11.2.4.5. Financials (Based on Availability)
- 11.2.5 Gates
- 11.2.5.1. Overview
- 11.2.5.2. Products
- 11.2.5.3. SWOT Analysis
- 11.2.5.4. Recent Developments
- 11.2.5.5. Financials (Based on Availability)
- 11.2.6 Hanon Systems
- 11.2.6.1. Overview
- 11.2.6.2. Products
- 11.2.6.3. SWOT Analysis
- 11.2.6.4. Recent Developments
- 11.2.6.5. Financials (Based on Availability)
- 11.2.7 MAHLE
- 11.2.7.1. Overview
- 11.2.7.2. Products
- 11.2.7.3. SWOT Analysis
- 11.2.7.4. Recent Developments
- 11.2.7.5. Financials (Based on Availability)
- 11.2.8 GMB
- 11.2.8.1. Overview
- 11.2.8.2. Products
- 11.2.8.3. SWOT Analysis
- 11.2.8.4. Recent Developments
- 11.2.8.5. Financials (Based on Availability)
- 11.2.9 Buehler Motor
- 11.2.9.1. Overview
- 11.2.9.2. Products
- 11.2.9.3. SWOT Analysis
- 11.2.9.4. Recent Developments
- 11.2.9.5. Financials (Based on Availability)
- 11.2.10 Valeo
- 11.2.10.1. Overview
- 11.2.10.2. Products
- 11.2.10.3. SWOT Analysis
- 11.2.10.4. Recent Developments
- 11.2.10.5. Financials (Based on Availability)
- 11.2.11 Feilong Auto Components
- 11.2.11.1. Overview
- 11.2.11.2. Products
- 11.2.11.3. SWOT Analysis
- 11.2.11.4. Recent Developments
- 11.2.11.5. Financials (Based on Availability)
- 11.2.12 Sanhua Automotive Components
- 11.2.12.1. Overview
- 11.2.12.2. Products
- 11.2.12.3. SWOT Analysis
- 11.2.12.4. Recent Developments
- 11.2.12.5. Financials (Based on Availability)
- 11.2.13 Yinlun
- 11.2.13.1. Overview
- 11.2.13.2. Products
- 11.2.13.3. SWOT Analysis
- 11.2.13.4. Recent Developments
- 11.2.13.5. Financials (Based on Availability)
- 11.2.14 Jiangsu Leili Motor
- 11.2.14.1. Overview
- 11.2.14.2. Products
- 11.2.14.3. SWOT Analysis
- 11.2.14.4. Recent Developments
- 11.2.14.5. Financials (Based on Availability)
- 11.2.1 Bosch
List of Figures
- Figure 1: Global Electric Driven Water Pump Revenue Breakdown (million, %) by Region 2025 & 2033
- Figure 2: North America Electric Driven Water Pump Revenue (million), by Application 2025 & 2033
- Figure 3: North America Electric Driven Water Pump Revenue Share (%), by Application 2025 & 2033
- Figure 4: North America Electric Driven Water Pump Revenue (million), by Types 2025 & 2033
- Figure 5: North America Electric Driven Water Pump Revenue Share (%), by Types 2025 & 2033
- Figure 6: North America Electric Driven Water Pump Revenue (million), by Country 2025 & 2033
- Figure 7: North America Electric Driven Water Pump Revenue Share (%), by Country 2025 & 2033
- Figure 8: South America Electric Driven Water Pump Revenue (million), by Application 2025 & 2033
- Figure 9: South America Electric Driven Water Pump Revenue Share (%), by Application 2025 & 2033
- Figure 10: South America Electric Driven Water Pump Revenue (million), by Types 2025 & 2033
- Figure 11: South America Electric Driven Water Pump Revenue Share (%), by Types 2025 & 2033
- Figure 12: South America Electric Driven Water Pump Revenue (million), by Country 2025 & 2033
- Figure 13: South America Electric Driven Water Pump Revenue Share (%), by Country 2025 & 2033
- Figure 14: Europe Electric Driven Water Pump Revenue (million), by Application 2025 & 2033
- Figure 15: Europe Electric Driven Water Pump Revenue Share (%), by Application 2025 & 2033
- Figure 16: Europe Electric Driven Water Pump Revenue (million), by Types 2025 & 2033
- Figure 17: Europe Electric Driven Water Pump Revenue Share (%), by Types 2025 & 2033
- Figure 18: Europe Electric Driven Water Pump Revenue (million), by Country 2025 & 2033
- Figure 19: Europe Electric Driven Water Pump Revenue Share (%), by Country 2025 & 2033
- Figure 20: Middle East & Africa Electric Driven Water Pump Revenue (million), by Application 2025 & 2033
- Figure 21: Middle East & Africa Electric Driven Water Pump Revenue Share (%), by Application 2025 & 2033
- Figure 22: Middle East & Africa Electric Driven Water Pump Revenue (million), by Types 2025 & 2033
- Figure 23: Middle East & Africa Electric Driven Water Pump Revenue Share (%), by Types 2025 & 2033
- Figure 24: Middle East & Africa Electric Driven Water Pump Revenue (million), by Country 2025 & 2033
- Figure 25: Middle East & Africa Electric Driven Water Pump Revenue Share (%), by Country 2025 & 2033
- Figure 26: Asia Pacific Electric Driven Water Pump Revenue (million), by Application 2025 & 2033
- Figure 27: Asia Pacific Electric Driven Water Pump Revenue Share (%), by Application 2025 & 2033
- Figure 28: Asia Pacific Electric Driven Water Pump Revenue (million), by Types 2025 & 2033
- Figure 29: Asia Pacific Electric Driven Water Pump Revenue Share (%), by Types 2025 & 2033
- Figure 30: Asia Pacific Electric Driven Water Pump Revenue (million), by Country 2025 & 2033
- Figure 31: Asia Pacific Electric Driven Water Pump Revenue Share (%), by Country 2025 & 2033
List of Tables
- Table 1: Global Electric Driven Water Pump Revenue million Forecast, by Application 2020 & 2033
- Table 2: Global Electric Driven Water Pump Revenue million Forecast, by Types 2020 & 2033
- Table 3: Global Electric Driven Water Pump Revenue million Forecast, by Region 2020 & 2033
- Table 4: Global Electric Driven Water Pump Revenue million Forecast, by Application 2020 & 2033
- Table 5: Global Electric Driven Water Pump Revenue million Forecast, by Types 2020 & 2033
- Table 6: Global Electric Driven Water Pump Revenue million Forecast, by Country 2020 & 2033
- Table 7: United States Electric Driven Water Pump Revenue (million) Forecast, by Application 2020 & 2033
- Table 8: Canada Electric Driven Water Pump Revenue (million) Forecast, by Application 2020 & 2033
- Table 9: Mexico Electric Driven Water Pump Revenue (million) Forecast, by Application 2020 & 2033
- Table 10: Global Electric Driven Water Pump Revenue million Forecast, by Application 2020 & 2033
- Table 11: Global Electric Driven Water Pump Revenue million Forecast, by Types 2020 & 2033
- Table 12: Global Electric Driven Water Pump Revenue million Forecast, by Country 2020 & 2033
- Table 13: Brazil Electric Driven Water Pump Revenue (million) Forecast, by Application 2020 & 2033
- Table 14: Argentina Electric Driven Water Pump Revenue (million) Forecast, by Application 2020 & 2033
- Table 15: Rest of South America Electric Driven Water Pump Revenue (million) Forecast, by Application 2020 & 2033
- Table 16: Global Electric Driven Water Pump Revenue million Forecast, by Application 2020 & 2033
- Table 17: Global Electric Driven Water Pump Revenue million Forecast, by Types 2020 & 2033
- Table 18: Global Electric Driven Water Pump Revenue million Forecast, by Country 2020 & 2033
- Table 19: United Kingdom Electric Driven Water Pump Revenue (million) Forecast, by Application 2020 & 2033
- Table 20: Germany Electric Driven Water Pump Revenue (million) Forecast, by Application 2020 & 2033
- Table 21: France Electric Driven Water Pump Revenue (million) Forecast, by Application 2020 & 2033
- Table 22: Italy Electric Driven Water Pump Revenue (million) Forecast, by Application 2020 & 2033
- Table 23: Spain Electric Driven Water Pump Revenue (million) Forecast, by Application 2020 & 2033
- Table 24: Russia Electric Driven Water Pump Revenue (million) Forecast, by Application 2020 & 2033
- Table 25: Benelux Electric Driven Water Pump Revenue (million) Forecast, by Application 2020 & 2033
- Table 26: Nordics Electric Driven Water Pump Revenue (million) Forecast, by Application 2020 & 2033
- Table 27: Rest of Europe Electric Driven Water Pump Revenue (million) Forecast, by Application 2020 & 2033
- Table 28: Global Electric Driven Water Pump Revenue million Forecast, by Application 2020 & 2033
- Table 29: Global Electric Driven Water Pump Revenue million Forecast, by Types 2020 & 2033
- Table 30: Global Electric Driven Water Pump Revenue million Forecast, by Country 2020 & 2033
- Table 31: Turkey Electric Driven Water Pump Revenue (million) Forecast, by Application 2020 & 2033
- Table 32: Israel Electric Driven Water Pump Revenue (million) Forecast, by Application 2020 & 2033
- Table 33: GCC Electric Driven Water Pump Revenue (million) Forecast, by Application 2020 & 2033
- Table 34: North Africa Electric Driven Water Pump Revenue (million) Forecast, by Application 2020 & 2033
- Table 35: South Africa Electric Driven Water Pump Revenue (million) Forecast, by Application 2020 & 2033
- Table 36: Rest of Middle East & Africa Electric Driven Water Pump Revenue (million) Forecast, by Application 2020 & 2033
- Table 37: Global Electric Driven Water Pump Revenue million Forecast, by Application 2020 & 2033
- Table 38: Global Electric Driven Water Pump Revenue million Forecast, by Types 2020 & 2033
- Table 39: Global Electric Driven Water Pump Revenue million Forecast, by Country 2020 & 2033
- Table 40: China Electric Driven Water Pump Revenue (million) Forecast, by Application 2020 & 2033
- Table 41: India Electric Driven Water Pump Revenue (million) Forecast, by Application 2020 & 2033
- Table 42: Japan Electric Driven Water Pump Revenue (million) Forecast, by Application 2020 & 2033
- Table 43: South Korea Electric Driven Water Pump Revenue (million) Forecast, by Application 2020 & 2033
- Table 44: ASEAN Electric Driven Water Pump Revenue (million) Forecast, by Application 2020 & 2033
- Table 45: Oceania Electric Driven Water Pump Revenue (million) Forecast, by Application 2020 & 2033
- Table 46: Rest of Asia Pacific Electric Driven Water Pump Revenue (million) Forecast, by Application 2020 & 2033
Frequently Asked Questions
1. What is the projected Compound Annual Growth Rate (CAGR) of the Electric Driven Water Pump?
The projected CAGR is approximately 4.8%.
2. Which companies are prominent players in the Electric Driven Water Pump?
Key companies in the market include Bosch, Continental, Aisin, Rheinmetall Automotive, Gates, Hanon Systems, MAHLE, GMB, Buehler Motor, Valeo, Feilong Auto Components, Sanhua Automotive Components, Yinlun, Jiangsu Leili Motor.
3. What are the main segments of the Electric Driven Water Pump?
The market segments include Application, Types.
4. Can you provide details about the market size?
The market size is estimated to be USD 61876.6 million as of 2022.
5. What are some drivers contributing to market growth?
N/A
6. What are the notable trends driving market growth?
N/A
7. Are there any restraints impacting market growth?
N/A
8. Can you provide examples of recent developments in the market?
N/A
9. What pricing options are available for accessing the report?
Pricing options include single-user, multi-user, and enterprise licenses priced at USD 4900.00, USD 7350.00, and USD 9800.00 respectively.
10. Is the market size provided in terms of value or volume?
The market size is provided in terms of value, measured in million.
11. Are there any specific market keywords associated with the report?
Yes, the market keyword associated with the report is "Electric Driven Water Pump," which aids in identifying and referencing the specific market segment covered.
12. How do I determine which pricing option suits my needs best?
The pricing options vary based on user requirements and access needs. Individual users may opt for single-user licenses, while businesses requiring broader access may choose multi-user or enterprise licenses for cost-effective access to the report.
13. Are there any additional resources or data provided in the Electric Driven Water Pump report?
While the report offers comprehensive insights, it's advisable to review the specific contents or supplementary materials provided to ascertain if additional resources or data are available.
14. How can I stay updated on further developments or reports in the Electric Driven Water Pump?
To stay informed about further developments, trends, and reports in the Electric Driven Water Pump, consider subscribing to industry newsletters, following relevant companies and organizations, or regularly checking reputable industry news sources and publications.
Methodology
Step 1 - Identification of Relevant Samples Size from Population Database


Step 2 - Approaches for Defining Global Market Size (Value, Volume* & Price*)

Note*: In applicable scenarios
Step 3 - Data Sources
Primary Research
- Web Analytics
- Survey Reports
- Research Institute
- Latest Research Reports
- Opinion Leaders
Secondary Research
- Annual Reports
- White Paper
- Latest Press Release
- Industry Association
- Paid Database
- Investor Presentations

Step 4 - Data Triangulation
Involves using different sources of information in order to increase the validity of a study
These sources are likely to be stakeholders in a program - participants, other researchers, program staff, other community members, and so on.
Then we put all data in single framework & apply various statistical tools to find out the dynamic on the market.
During the analysis stage, feedback from the stakeholder groups would be compared to determine areas of agreement as well as areas of divergence