

Key Insights
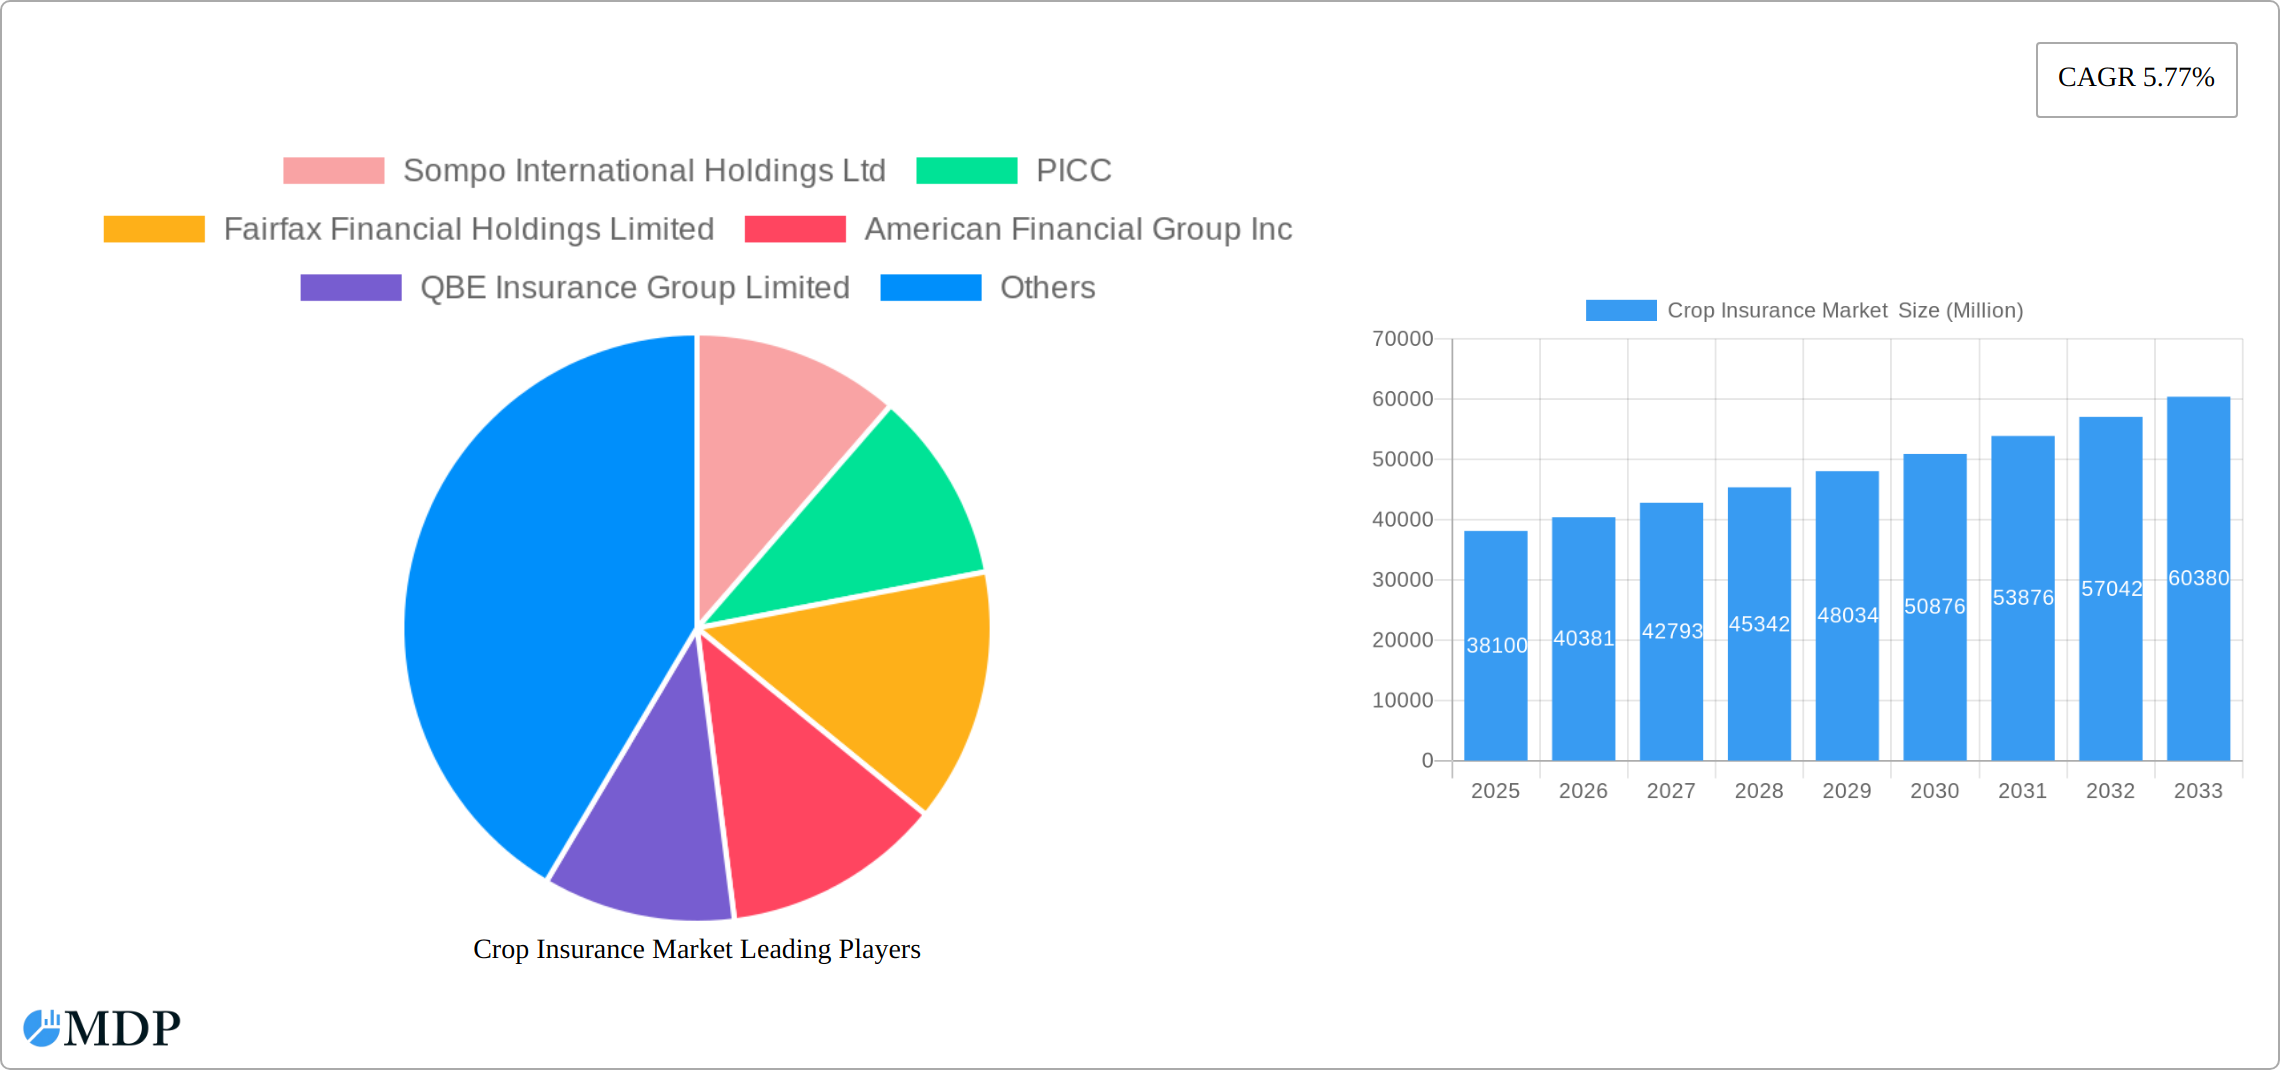
The global crop insurance market, valued at $38.10 billion in 2025, is projected to experience robust growth, driven by a compound annual growth rate (CAGR) of 5.77% from 2025 to 2033. This expansion is fueled by several key factors. Increasing frequency and severity of climate change-related events like droughts, floods, and extreme weather patterns are significantly impacting agricultural yields, making crop insurance a crucial risk mitigation tool for farmers. Government initiatives promoting agricultural insurance and subsidies to make coverage more affordable are further boosting market penetration. The rising adoption of precision agriculture technologies, coupled with improved data analytics capabilities, enables more accurate risk assessment and tailored insurance products, increasing the appeal of crop insurance to a wider range of farmers. Finally, the diversification of product offerings, encompassing various coverage types like multiple peril crop insurance, revenue coverage, and specific risk policies catering to different crop types and geographical locations, is enhancing market appeal and driving growth.
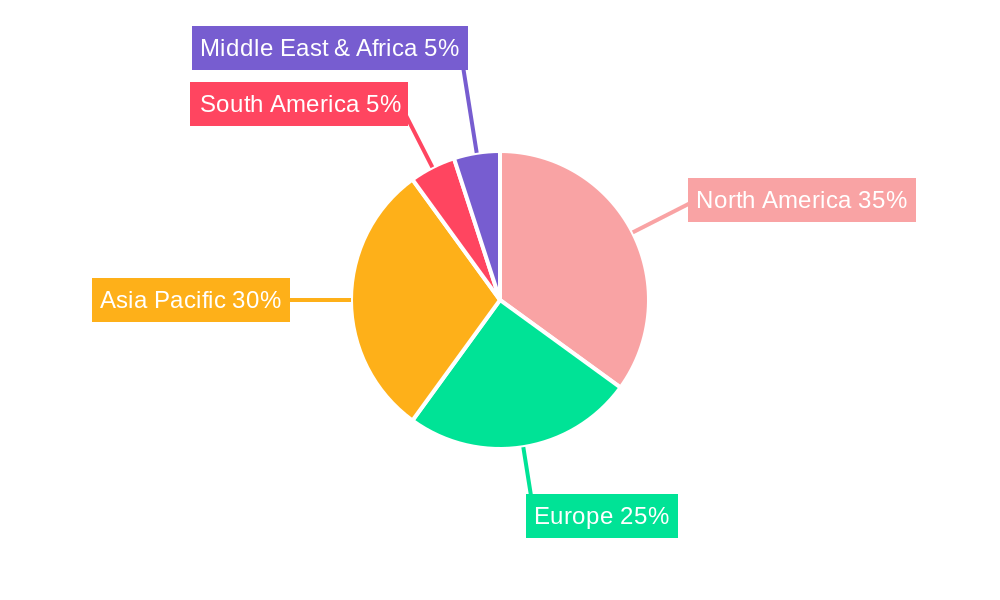
Segment-wise, multiple peril crop insurance is expected to maintain its dominance due to its comprehensive coverage against a wider range of risks. The distribution channel is primarily dominated by banks and insurance companies, although brokers and agents are playing a significant role in expanding market reach, particularly in geographically dispersed agricultural areas. Geographically, North America and Asia Pacific are anticipated to remain the largest markets, driven by advanced agricultural practices, strong government support, and a significant number of insured farmers. However, emerging economies in regions like South America and Africa are demonstrating significant growth potential, owing to increasing awareness of crop insurance benefits and rising agricultural investment. The competitive landscape is marked by a blend of multinational insurance giants and regional players, indicating a dynamic market with increasing competition and innovation in product development and distribution strategies.
Dive Deep into the Crop Insurance Market: A Comprehensive Report (2019-2033)
This in-depth report provides a comprehensive analysis of the global Crop Insurance Market, offering invaluable insights for industry stakeholders, investors, and strategic decision-makers. With a study period spanning 2019-2033, a base year of 2025, and a forecast period of 2025-2033, this report meticulously examines market dynamics, trends, leading players, and future opportunities. The market is projected to reach xx Million by 2033, exhibiting a CAGR of xx% during the forecast period.
Crop Insurance Market Dynamics & Concentration
The Crop Insurance Market is characterized by a dynamic interplay of factors influencing its growth and concentration. Market concentration is currently moderate, with a few large players holding significant market share, but a considerable number of smaller regional players also contributing. Innovation is a key driver, with advancements in technology leading to improved risk assessment models, more efficient claims processing, and the development of customized insurance products. Regulatory frameworks, varying significantly across regions, significantly impact market access and product offerings. Substitutes, such as government subsidies or farmer cooperatives, exert some competitive pressure, while end-user trends, particularly the increasing adoption of precision agriculture, create demand for specialized insurance solutions. M&A activity has been moderate in recent years, with xx major deals recorded between 2019 and 2024, indicating a trend of consolidation within the sector.
- Market Share: Top 5 players hold approximately xx% of the global market share in 2025.
- M&A Deal Counts: xx major mergers and acquisitions recorded between 2019 and 2024.
- Innovation Drivers: Advancements in remote sensing, AI, and big data analytics are revolutionizing risk assessment.
- Regulatory Impact: Varying regulatory landscapes across countries influence market penetration and product development.
Crop Insurance Market Industry Trends & Analysis
The Crop Insurance Market is experiencing robust growth, driven by a confluence of factors. The escalating frequency and severity of extreme weather events, exacerbated by climate change, are significantly increasing the demand for comprehensive crop protection. This demand is further fueled by the growing adoption of precision agriculture techniques, which enable more accurate risk assessment and the development of highly tailored insurance solutions. Technological advancements, including the utilization of drones, satellite imagery, and advanced data analytics, are revolutionizing the industry, improving the accuracy and efficiency of risk assessment and claims processing. Furthermore, evolving consumer preferences are driving demand for more comprehensive and customized insurance products specifically designed to address the unique risks associated with various crop types and regional variations in climate and agricultural practices. The competitive landscape is dynamic, with established multinational insurers vying with smaller, agile niche players, resulting in continuous innovation and a diversification of offerings. This dynamic environment presents considerable growth potential, particularly in developing economies experiencing expansion in their agricultural sectors. While market penetration remains relatively low in many regions, this presents significant untapped opportunities for expansion and market share gains.
Leading Markets & Segments in Crop Insurance Market
The Crop Insurance Market demonstrates significant regional variations in market share and growth trajectories. While North America and Europe currently hold substantial market shares, remarkable growth is being observed in Asia and Africa, driven by factors such as increasing agricultural production and government initiatives to promote agricultural insurance. Among the various segments, Multiple Peril Crop Insurance commands the largest market share, reflecting the comprehensive nature of its coverage and its ability to protect against a wide range of risks. In terms of distribution channels, Insurance Companies maintain a dominant position, leveraging their extensive networks and established expertise in risk assessment and claims management. Standing Crop Loss insurance remains the dominant coverage type, underscoring the significant vulnerability of crops to weather-related damage throughout their growing cycle.
- Key Drivers in Dominant Segments:
- Multiple Peril Crop Insurance: Growing demand for all-risk coverage, particularly to mitigate the financial impact of unpredictable and increasingly severe weather events driven by climate change.
- Standing Crop Loss: The high vulnerability of crops to unforeseen weather events, coupled with increased farmer awareness of the need for comprehensive protection, drives demand in this segment.
- Insurance Companies: Their established distribution networks, extensive experience in risk management, and specialized expertise provide a strong foundation for market leadership.
- North America & Europe: These regions benefit from well-developed agricultural infrastructure, stringent regulatory frameworks promoting insurance adoption, and advanced technology adoption in precision agriculture.
- Regional Dominance Analysis: North America maintains its leading position due to a robust agricultural infrastructure and a well-established insurance industry with sophisticated risk management capabilities. The Asia-Pacific region exhibits high growth potential, driven by a combination of increased government support for agricultural insurance schemes and the rapid expansion of agricultural production.
Crop Insurance Market Product Developments
Recent product innovations are heavily focused on leveraging technological advancements to improve risk assessment accuracy and expedite claims processing. New products are increasingly incorporating data from IoT sensors, satellite imagery, and sophisticated predictive modeling techniques to offer highly tailored coverage at competitive premiums. The overall emphasis is on delivering accurate, timely, and efficient solutions to farmers, empowering them to effectively manage risk and enhance their profitability. These advancements are contributing to greater market penetration and significantly improved customer satisfaction.
Key Drivers of Crop Insurance Market Growth
The sustained growth of the Crop Insurance Market is driven by several interconnected factors. Technological advancements, particularly in the fields of remote sensing and data analytics, are revolutionizing risk assessment and claims management, enabling more precise and efficient service delivery. Favorable government policies and subsidies in many countries are actively encouraging wider adoption of crop insurance by providing financial incentives. The escalating frequency and intensity of extreme weather events, directly linked to climate change, are creating a strong demand for comprehensive and robust crop insurance solutions. Finally, the economic growth observed in many developing countries is fueling expansion in agricultural production, creating an expanding market for crop insurance products.
Challenges in the Crop Insurance Market
The Crop Insurance Market faces various challenges. Data scarcity and the cost of obtaining high-quality agricultural data remain significant hurdles, particularly in developing countries. Regulatory uncertainties and inconsistent enforcement across different regions create complexities for insurance providers. The relatively high premiums compared to farmer's income levels can pose an accessibility barrier in some areas. Intense competition among insurers necessitates strategic pricing and innovative product differentiation to maintain market share.
Emerging Opportunities in Crop Insurance Market
Significant opportunities exist for long-term growth. The increasing adoption of precision agriculture techniques creates opportunities for developing specialized insurance products based on specific farm management practices. Partnerships between insurers, technology providers, and agricultural cooperatives can offer more efficient and cost-effective insurance solutions. Expansion into underserved markets, particularly in developing countries, presents significant growth potential.
Leading Players in the Crop Insurance Market Sector
- Sompo International Holdings Ltd
- PICC
- Fairfax Financial Holdings Limited
- American Financial Group Inc
- QBE Insurance Group Limited
- ICICI Lombard General Insurance Company Limited
- Zurich
- Chubb
- Tokio Marine HCC
- Agriculture Insurance Company of India Limited (AIC)
Key Milestones in Crop Insurance Market Industry
- September 2023: Launch of the Shrimp Crop Insurance scheme in India by the Agricultural Insurance Company of India, expanding coverage to a vital aquaculture sector.
- July 2023: American Financial Group (AFG)'s acquisition of Crop Risk Services (CRS) from AIG, significantly strengthening AFG's position in the competitive US crop insurance market.
Strategic Outlook for Crop Insurance Market
The Crop Insurance Market is poised for sustained growth, driven by technological innovation, increasing climate-related risks, and expansion into new markets. Strategic partnerships, product diversification, and investments in data analytics will be crucial for success. The focus on sustainable and resilient agriculture will further shape the evolution of crop insurance products and services in the coming years.
Crop Insurance Market Segmentation
-
1. Type
- 1.1. Multiple Peril Crop Insurance
- 1.2. Actual Production History
- 1.3. Crop Revenue Coverage
-
2. Coverage
- 2.1. Localized Calamities
- 2.2. Sowing/Planting/Germination Risk
- 2.3. Standing Crop Loss
- 2.4. Post-harvest Losses
-
3. Distribution Channel
- 3.1. Banks
- 3.2. Insurance Companies
- 3.3. Brokers and Agents
- 3.4. Other Distribution Channels
Crop Insurance Market Segmentation By Geography
-
1. North America
- 1.1. United States
- 1.2. Canada
- 1.3. Mexico
-
2. South America
- 2.1. Brazil
- 2.2. Argentina
- 2.3. Rest of South America
-
3. Europe
- 3.1. United Kingdom
- 3.2. Germany
- 3.3. France
- 3.4. Italy
- 3.5. Spain
- 3.6. Russia
- 3.7. Benelux
- 3.8. Nordics
- 3.9. Rest of Europe
-
4. Middle East & Africa
- 4.1. Turkey
- 4.2. Israel
- 4.3. GCC
- 4.4. North Africa
- 4.5. South Africa
- 4.6. Rest of Middle East & Africa
-
5. Asia Pacific
- 5.1. China
- 5.2. India
- 5.3. Japan
- 5.4. South Korea
- 5.5. ASEAN
- 5.6. Oceania
- 5.7. Rest of Asia Pacific
Crop Insurance Market REPORT HIGHLIGHTS
| Aspects | Details |
|---|---|
| Study Period | 2019-2033 |
| Base Year | 2024 |
| Estimated Year | 2025 |
| Forecast Period | 2025-2033 |
| Historical Period | 2019-2024 |
| Growth Rate | CAGR of 5.77% from 2019-2033 |
| Segmentation |
|
Table of Contents
- 1. Introduction
- 1.1. Research Scope
- 1.2. Market Segmentation
- 1.3. Research Methodology
- 1.4. Definitions and Assumptions
- 2. Executive Summary
- 2.1. Introduction
- 3. Market Dynamics
- 3.1. Introduction
- 3.2. Market Drivers
- 3.2.1 Government Support
- 3.2.2 Including Subsidies and Initiatives
- 3.2.3 is a Significant Driver
- 3.3. Market Restrains
- 3.3.1. Instances of Fraud or Misreporting can Impact the Integrity of the Crop Insurance System
- 3.4. Market Trends
- 3.4.1. Increasing Value Crop Protection Globally
- 4. Market Factor Analysis
- 4.1. Porters Five Forces
- 4.2. Supply/Value Chain
- 4.3. PESTEL analysis
- 4.4. Market Entropy
- 4.5. Patent/Trademark Analysis
- 5. Global Crop Insurance Market Analysis, Insights and Forecast, 2019-2031
- 5.1. Market Analysis, Insights and Forecast - by Type
- 5.1.1. Multiple Peril Crop Insurance
- 5.1.2. Actual Production History
- 5.1.3. Crop Revenue Coverage
- 5.2. Market Analysis, Insights and Forecast - by Coverage
- 5.2.1. Localized Calamities
- 5.2.2. Sowing/Planting/Germination Risk
- 5.2.3. Standing Crop Loss
- 5.2.4. Post-harvest Losses
- 5.3. Market Analysis, Insights and Forecast - by Distribution Channel
- 5.3.1. Banks
- 5.3.2. Insurance Companies
- 5.3.3. Brokers and Agents
- 5.3.4. Other Distribution Channels
- 5.4. Market Analysis, Insights and Forecast - by Region
- 5.4.1. North America
- 5.4.2. South America
- 5.4.3. Europe
- 5.4.4. Middle East & Africa
- 5.4.5. Asia Pacific
- 5.1. Market Analysis, Insights and Forecast - by Type
- 6. North America Crop Insurance Market Analysis, Insights and Forecast, 2019-2031
- 6.1. Market Analysis, Insights and Forecast - by Type
- 6.1.1. Multiple Peril Crop Insurance
- 6.1.2. Actual Production History
- 6.1.3. Crop Revenue Coverage
- 6.2. Market Analysis, Insights and Forecast - by Coverage
- 6.2.1. Localized Calamities
- 6.2.2. Sowing/Planting/Germination Risk
- 6.2.3. Standing Crop Loss
- 6.2.4. Post-harvest Losses
- 6.3. Market Analysis, Insights and Forecast - by Distribution Channel
- 6.3.1. Banks
- 6.3.2. Insurance Companies
- 6.3.3. Brokers and Agents
- 6.3.4. Other Distribution Channels
- 6.1. Market Analysis, Insights and Forecast - by Type
- 7. South America Crop Insurance Market Analysis, Insights and Forecast, 2019-2031
- 7.1. Market Analysis, Insights and Forecast - by Type
- 7.1.1. Multiple Peril Crop Insurance
- 7.1.2. Actual Production History
- 7.1.3. Crop Revenue Coverage
- 7.2. Market Analysis, Insights and Forecast - by Coverage
- 7.2.1. Localized Calamities
- 7.2.2. Sowing/Planting/Germination Risk
- 7.2.3. Standing Crop Loss
- 7.2.4. Post-harvest Losses
- 7.3. Market Analysis, Insights and Forecast - by Distribution Channel
- 7.3.1. Banks
- 7.3.2. Insurance Companies
- 7.3.3. Brokers and Agents
- 7.3.4. Other Distribution Channels
- 7.1. Market Analysis, Insights and Forecast - by Type
- 8. Europe Crop Insurance Market Analysis, Insights and Forecast, 2019-2031
- 8.1. Market Analysis, Insights and Forecast - by Type
- 8.1.1. Multiple Peril Crop Insurance
- 8.1.2. Actual Production History
- 8.1.3. Crop Revenue Coverage
- 8.2. Market Analysis, Insights and Forecast - by Coverage
- 8.2.1. Localized Calamities
- 8.2.2. Sowing/Planting/Germination Risk
- 8.2.3. Standing Crop Loss
- 8.2.4. Post-harvest Losses
- 8.3. Market Analysis, Insights and Forecast - by Distribution Channel
- 8.3.1. Banks
- 8.3.2. Insurance Companies
- 8.3.3. Brokers and Agents
- 8.3.4. Other Distribution Channels
- 8.1. Market Analysis, Insights and Forecast - by Type
- 9. Middle East & Africa Crop Insurance Market Analysis, Insights and Forecast, 2019-2031
- 9.1. Market Analysis, Insights and Forecast - by Type
- 9.1.1. Multiple Peril Crop Insurance
- 9.1.2. Actual Production History
- 9.1.3. Crop Revenue Coverage
- 9.2. Market Analysis, Insights and Forecast - by Coverage
- 9.2.1. Localized Calamities
- 9.2.2. Sowing/Planting/Germination Risk
- 9.2.3. Standing Crop Loss
- 9.2.4. Post-harvest Losses
- 9.3. Market Analysis, Insights and Forecast - by Distribution Channel
- 9.3.1. Banks
- 9.3.2. Insurance Companies
- 9.3.3. Brokers and Agents
- 9.3.4. Other Distribution Channels
- 9.1. Market Analysis, Insights and Forecast - by Type
- 10. Asia Pacific Crop Insurance Market Analysis, Insights and Forecast, 2019-2031
- 10.1. Market Analysis, Insights and Forecast - by Type
- 10.1.1. Multiple Peril Crop Insurance
- 10.1.2. Actual Production History
- 10.1.3. Crop Revenue Coverage
- 10.2. Market Analysis, Insights and Forecast - by Coverage
- 10.2.1. Localized Calamities
- 10.2.2. Sowing/Planting/Germination Risk
- 10.2.3. Standing Crop Loss
- 10.2.4. Post-harvest Losses
- 10.3. Market Analysis, Insights and Forecast - by Distribution Channel
- 10.3.1. Banks
- 10.3.2. Insurance Companies
- 10.3.3. Brokers and Agents
- 10.3.4. Other Distribution Channels
- 10.1. Market Analysis, Insights and Forecast - by Type
- 11. North America Crop Insurance Market Analysis, Insights and Forecast, 2019-2031
- 11.1. Market Analysis, Insights and Forecast - By Country/Sub-region
- 11.1.1 United States
- 11.1.2 Canada
- 11.1.3 Mexico
- 12. South America Crop Insurance Market Analysis, Insights and Forecast, 2019-2031
- 12.1. Market Analysis, Insights and Forecast - By Country/Sub-region
- 12.1.1 Brazil
- 12.1.2 Argentina
- 12.1.3 Rest of South America
- 13. Europe Crop Insurance Market Analysis, Insights and Forecast, 2019-2031
- 13.1. Market Analysis, Insights and Forecast - By Country/Sub-region
- 13.1.1 Germany
- 13.1.2 France
- 13.1.3 Italy
- 13.1.4 United Kingdom
- 13.1.5 Netherlands
- 13.1.6 Sweden
- 13.1.7 Rest of Europe
- 14. Asia Pacific Crop Insurance Market Analysis, Insights and Forecast, 2019-2031
- 14.1. Market Analysis, Insights and Forecast - By Country/Sub-region
- 14.1.1 China
- 14.1.2 Japan
- 14.1.3 India
- 14.1.4 South Korea
- 14.1.5 Taiwan
- 14.1.6 Australia
- 14.1.7 Rest of Asia-Pacific
- 15. Middle East & Africa Crop Insurance Market Analysis, Insights and Forecast, 2019-2031
- 15.1. Market Analysis, Insights and Forecast - By Country/Sub-region
- 15.1.1 UAE
- 15.1.2 South Africa
- 15.1.3 Saudi Arabia
- 15.1.4 Rest of MEA
- 16. Competitive Analysis
- 16.1. Global Market Share Analysis 2024
- 16.2. Company Profiles
- 16.2.1 Sompo International Holdings Ltd
- 16.2.1.1. Overview
- 16.2.1.2. Products
- 16.2.1.3. SWOT Analysis
- 16.2.1.4. Recent Developments
- 16.2.1.5. Financials (Based on Availability)
- 16.2.2 PICC
- 16.2.2.1. Overview
- 16.2.2.2. Products
- 16.2.2.3. SWOT Analysis
- 16.2.2.4. Recent Developments
- 16.2.2.5. Financials (Based on Availability)
- 16.2.3 Fairfax Financial Holdings Limited
- 16.2.3.1. Overview
- 16.2.3.2. Products
- 16.2.3.3. SWOT Analysis
- 16.2.3.4. Recent Developments
- 16.2.3.5. Financials (Based on Availability)
- 16.2.4 American Financial Group Inc
- 16.2.4.1. Overview
- 16.2.4.2. Products
- 16.2.4.3. SWOT Analysis
- 16.2.4.4. Recent Developments
- 16.2.4.5. Financials (Based on Availability)
- 16.2.5 QBE Insurance Group Limited
- 16.2.5.1. Overview
- 16.2.5.2. Products
- 16.2.5.3. SWOT Analysis
- 16.2.5.4. Recent Developments
- 16.2.5.5. Financials (Based on Availability)
- 16.2.6 ICICI Lombard General Insurance Company Limited
- 16.2.6.1. Overview
- 16.2.6.2. Products
- 16.2.6.3. SWOT Analysis
- 16.2.6.4. Recent Developments
- 16.2.6.5. Financials (Based on Availability)
- 16.2.7 Zurich**List Not Exhaustive
- 16.2.7.1. Overview
- 16.2.7.2. Products
- 16.2.7.3. SWOT Analysis
- 16.2.7.4. Recent Developments
- 16.2.7.5. Financials (Based on Availability)
- 16.2.8 Chubb
- 16.2.8.1. Overview
- 16.2.8.2. Products
- 16.2.8.3. SWOT Analysis
- 16.2.8.4. Recent Developments
- 16.2.8.5. Financials (Based on Availability)
- 16.2.9 Tokio Marine HCC
- 16.2.9.1. Overview
- 16.2.9.2. Products
- 16.2.9.3. SWOT Analysis
- 16.2.9.4. Recent Developments
- 16.2.9.5. Financials (Based on Availability)
- 16.2.10 Agriculture Insurance Company of India Limited (AIC)
- 16.2.10.1. Overview
- 16.2.10.2. Products
- 16.2.10.3. SWOT Analysis
- 16.2.10.4. Recent Developments
- 16.2.10.5. Financials (Based on Availability)
- 16.2.1 Sompo International Holdings Ltd
List of Figures
- Figure 1: Global Crop Insurance Market Revenue Breakdown (Million, %) by Region 2024 & 2032
- Figure 2: North America Crop Insurance Market Revenue (Million), by Country 2024 & 2032
- Figure 3: North America Crop Insurance Market Revenue Share (%), by Country 2024 & 2032
- Figure 4: South America Crop Insurance Market Revenue (Million), by Country 2024 & 2032
- Figure 5: South America Crop Insurance Market Revenue Share (%), by Country 2024 & 2032
- Figure 6: Europe Crop Insurance Market Revenue (Million), by Country 2024 & 2032
- Figure 7: Europe Crop Insurance Market Revenue Share (%), by Country 2024 & 2032
- Figure 8: Asia Pacific Crop Insurance Market Revenue (Million), by Country 2024 & 2032
- Figure 9: Asia Pacific Crop Insurance Market Revenue Share (%), by Country 2024 & 2032
- Figure 10: Middle East & Africa Crop Insurance Market Revenue (Million), by Country 2024 & 2032
- Figure 11: Middle East & Africa Crop Insurance Market Revenue Share (%), by Country 2024 & 2032
- Figure 12: North America Crop Insurance Market Revenue (Million), by Type 2024 & 2032
- Figure 13: North America Crop Insurance Market Revenue Share (%), by Type 2024 & 2032
- Figure 14: North America Crop Insurance Market Revenue (Million), by Coverage 2024 & 2032
- Figure 15: North America Crop Insurance Market Revenue Share (%), by Coverage 2024 & 2032
- Figure 16: North America Crop Insurance Market Revenue (Million), by Distribution Channel 2024 & 2032
- Figure 17: North America Crop Insurance Market Revenue Share (%), by Distribution Channel 2024 & 2032
- Figure 18: North America Crop Insurance Market Revenue (Million), by Country 2024 & 2032
- Figure 19: North America Crop Insurance Market Revenue Share (%), by Country 2024 & 2032
- Figure 20: South America Crop Insurance Market Revenue (Million), by Type 2024 & 2032
- Figure 21: South America Crop Insurance Market Revenue Share (%), by Type 2024 & 2032
- Figure 22: South America Crop Insurance Market Revenue (Million), by Coverage 2024 & 2032
- Figure 23: South America Crop Insurance Market Revenue Share (%), by Coverage 2024 & 2032
- Figure 24: South America Crop Insurance Market Revenue (Million), by Distribution Channel 2024 & 2032
- Figure 25: South America Crop Insurance Market Revenue Share (%), by Distribution Channel 2024 & 2032
- Figure 26: South America Crop Insurance Market Revenue (Million), by Country 2024 & 2032
- Figure 27: South America Crop Insurance Market Revenue Share (%), by Country 2024 & 2032
- Figure 28: Europe Crop Insurance Market Revenue (Million), by Type 2024 & 2032
- Figure 29: Europe Crop Insurance Market Revenue Share (%), by Type 2024 & 2032
- Figure 30: Europe Crop Insurance Market Revenue (Million), by Coverage 2024 & 2032
- Figure 31: Europe Crop Insurance Market Revenue Share (%), by Coverage 2024 & 2032
- Figure 32: Europe Crop Insurance Market Revenue (Million), by Distribution Channel 2024 & 2032
- Figure 33: Europe Crop Insurance Market Revenue Share (%), by Distribution Channel 2024 & 2032
- Figure 34: Europe Crop Insurance Market Revenue (Million), by Country 2024 & 2032
- Figure 35: Europe Crop Insurance Market Revenue Share (%), by Country 2024 & 2032
- Figure 36: Middle East & Africa Crop Insurance Market Revenue (Million), by Type 2024 & 2032
- Figure 37: Middle East & Africa Crop Insurance Market Revenue Share (%), by Type 2024 & 2032
- Figure 38: Middle East & Africa Crop Insurance Market Revenue (Million), by Coverage 2024 & 2032
- Figure 39: Middle East & Africa Crop Insurance Market Revenue Share (%), by Coverage 2024 & 2032
- Figure 40: Middle East & Africa Crop Insurance Market Revenue (Million), by Distribution Channel 2024 & 2032
- Figure 41: Middle East & Africa Crop Insurance Market Revenue Share (%), by Distribution Channel 2024 & 2032
- Figure 42: Middle East & Africa Crop Insurance Market Revenue (Million), by Country 2024 & 2032
- Figure 43: Middle East & Africa Crop Insurance Market Revenue Share (%), by Country 2024 & 2032
- Figure 44: Asia Pacific Crop Insurance Market Revenue (Million), by Type 2024 & 2032
- Figure 45: Asia Pacific Crop Insurance Market Revenue Share (%), by Type 2024 & 2032
- Figure 46: Asia Pacific Crop Insurance Market Revenue (Million), by Coverage 2024 & 2032
- Figure 47: Asia Pacific Crop Insurance Market Revenue Share (%), by Coverage 2024 & 2032
- Figure 48: Asia Pacific Crop Insurance Market Revenue (Million), by Distribution Channel 2024 & 2032
- Figure 49: Asia Pacific Crop Insurance Market Revenue Share (%), by Distribution Channel 2024 & 2032
- Figure 50: Asia Pacific Crop Insurance Market Revenue (Million), by Country 2024 & 2032
- Figure 51: Asia Pacific Crop Insurance Market Revenue Share (%), by Country 2024 & 2032
List of Tables
- Table 1: Global Crop Insurance Market Revenue Million Forecast, by Region 2019 & 2032
- Table 2: Global Crop Insurance Market Revenue Million Forecast, by Type 2019 & 2032
- Table 3: Global Crop Insurance Market Revenue Million Forecast, by Coverage 2019 & 2032
- Table 4: Global Crop Insurance Market Revenue Million Forecast, by Distribution Channel 2019 & 2032
- Table 5: Global Crop Insurance Market Revenue Million Forecast, by Region 2019 & 2032
- Table 6: Global Crop Insurance Market Revenue Million Forecast, by Country 2019 & 2032
- Table 7: United States Crop Insurance Market Revenue (Million) Forecast, by Application 2019 & 2032
- Table 8: Canada Crop Insurance Market Revenue (Million) Forecast, by Application 2019 & 2032
- Table 9: Mexico Crop Insurance Market Revenue (Million) Forecast, by Application 2019 & 2032
- Table 10: Global Crop Insurance Market Revenue Million Forecast, by Country 2019 & 2032
- Table 11: Brazil Crop Insurance Market Revenue (Million) Forecast, by Application 2019 & 2032
- Table 12: Argentina Crop Insurance Market Revenue (Million) Forecast, by Application 2019 & 2032
- Table 13: Rest of South America Crop Insurance Market Revenue (Million) Forecast, by Application 2019 & 2032
- Table 14: Global Crop Insurance Market Revenue Million Forecast, by Country 2019 & 2032
- Table 15: Germany Crop Insurance Market Revenue (Million) Forecast, by Application 2019 & 2032
- Table 16: France Crop Insurance Market Revenue (Million) Forecast, by Application 2019 & 2032
- Table 17: Italy Crop Insurance Market Revenue (Million) Forecast, by Application 2019 & 2032
- Table 18: United Kingdom Crop Insurance Market Revenue (Million) Forecast, by Application 2019 & 2032
- Table 19: Netherlands Crop Insurance Market Revenue (Million) Forecast, by Application 2019 & 2032
- Table 20: Sweden Crop Insurance Market Revenue (Million) Forecast, by Application 2019 & 2032
- Table 21: Rest of Europe Crop Insurance Market Revenue (Million) Forecast, by Application 2019 & 2032
- Table 22: Global Crop Insurance Market Revenue Million Forecast, by Country 2019 & 2032
- Table 23: China Crop Insurance Market Revenue (Million) Forecast, by Application 2019 & 2032
- Table 24: Japan Crop Insurance Market Revenue (Million) Forecast, by Application 2019 & 2032
- Table 25: India Crop Insurance Market Revenue (Million) Forecast, by Application 2019 & 2032
- Table 26: South Korea Crop Insurance Market Revenue (Million) Forecast, by Application 2019 & 2032
- Table 27: Taiwan Crop Insurance Market Revenue (Million) Forecast, by Application 2019 & 2032
- Table 28: Australia Crop Insurance Market Revenue (Million) Forecast, by Application 2019 & 2032
- Table 29: Rest of Asia-Pacific Crop Insurance Market Revenue (Million) Forecast, by Application 2019 & 2032
- Table 30: Global Crop Insurance Market Revenue Million Forecast, by Country 2019 & 2032
- Table 31: UAE Crop Insurance Market Revenue (Million) Forecast, by Application 2019 & 2032
- Table 32: South Africa Crop Insurance Market Revenue (Million) Forecast, by Application 2019 & 2032
- Table 33: Saudi Arabia Crop Insurance Market Revenue (Million) Forecast, by Application 2019 & 2032
- Table 34: Rest of MEA Crop Insurance Market Revenue (Million) Forecast, by Application 2019 & 2032
- Table 35: Global Crop Insurance Market Revenue Million Forecast, by Type 2019 & 2032
- Table 36: Global Crop Insurance Market Revenue Million Forecast, by Coverage 2019 & 2032
- Table 37: Global Crop Insurance Market Revenue Million Forecast, by Distribution Channel 2019 & 2032
- Table 38: Global Crop Insurance Market Revenue Million Forecast, by Country 2019 & 2032
- Table 39: United States Crop Insurance Market Revenue (Million) Forecast, by Application 2019 & 2032
- Table 40: Canada Crop Insurance Market Revenue (Million) Forecast, by Application 2019 & 2032
- Table 41: Mexico Crop Insurance Market Revenue (Million) Forecast, by Application 2019 & 2032
- Table 42: Global Crop Insurance Market Revenue Million Forecast, by Type 2019 & 2032
- Table 43: Global Crop Insurance Market Revenue Million Forecast, by Coverage 2019 & 2032
- Table 44: Global Crop Insurance Market Revenue Million Forecast, by Distribution Channel 2019 & 2032
- Table 45: Global Crop Insurance Market Revenue Million Forecast, by Country 2019 & 2032
- Table 46: Brazil Crop Insurance Market Revenue (Million) Forecast, by Application 2019 & 2032
- Table 47: Argentina Crop Insurance Market Revenue (Million) Forecast, by Application 2019 & 2032
- Table 48: Rest of South America Crop Insurance Market Revenue (Million) Forecast, by Application 2019 & 2032
- Table 49: Global Crop Insurance Market Revenue Million Forecast, by Type 2019 & 2032
- Table 50: Global Crop Insurance Market Revenue Million Forecast, by Coverage 2019 & 2032
- Table 51: Global Crop Insurance Market Revenue Million Forecast, by Distribution Channel 2019 & 2032
- Table 52: Global Crop Insurance Market Revenue Million Forecast, by Country 2019 & 2032
- Table 53: United Kingdom Crop Insurance Market Revenue (Million) Forecast, by Application 2019 & 2032
- Table 54: Germany Crop Insurance Market Revenue (Million) Forecast, by Application 2019 & 2032
- Table 55: France Crop Insurance Market Revenue (Million) Forecast, by Application 2019 & 2032
- Table 56: Italy Crop Insurance Market Revenue (Million) Forecast, by Application 2019 & 2032
- Table 57: Spain Crop Insurance Market Revenue (Million) Forecast, by Application 2019 & 2032
- Table 58: Russia Crop Insurance Market Revenue (Million) Forecast, by Application 2019 & 2032
- Table 59: Benelux Crop Insurance Market Revenue (Million) Forecast, by Application 2019 & 2032
- Table 60: Nordics Crop Insurance Market Revenue (Million) Forecast, by Application 2019 & 2032
- Table 61: Rest of Europe Crop Insurance Market Revenue (Million) Forecast, by Application 2019 & 2032
- Table 62: Global Crop Insurance Market Revenue Million Forecast, by Type 2019 & 2032
- Table 63: Global Crop Insurance Market Revenue Million Forecast, by Coverage 2019 & 2032
- Table 64: Global Crop Insurance Market Revenue Million Forecast, by Distribution Channel 2019 & 2032
- Table 65: Global Crop Insurance Market Revenue Million Forecast, by Country 2019 & 2032
- Table 66: Turkey Crop Insurance Market Revenue (Million) Forecast, by Application 2019 & 2032
- Table 67: Israel Crop Insurance Market Revenue (Million) Forecast, by Application 2019 & 2032
- Table 68: GCC Crop Insurance Market Revenue (Million) Forecast, by Application 2019 & 2032
- Table 69: North Africa Crop Insurance Market Revenue (Million) Forecast, by Application 2019 & 2032
- Table 70: South Africa Crop Insurance Market Revenue (Million) Forecast, by Application 2019 & 2032
- Table 71: Rest of Middle East & Africa Crop Insurance Market Revenue (Million) Forecast, by Application 2019 & 2032
- Table 72: Global Crop Insurance Market Revenue Million Forecast, by Type 2019 & 2032
- Table 73: Global Crop Insurance Market Revenue Million Forecast, by Coverage 2019 & 2032
- Table 74: Global Crop Insurance Market Revenue Million Forecast, by Distribution Channel 2019 & 2032
- Table 75: Global Crop Insurance Market Revenue Million Forecast, by Country 2019 & 2032
- Table 76: China Crop Insurance Market Revenue (Million) Forecast, by Application 2019 & 2032
- Table 77: India Crop Insurance Market Revenue (Million) Forecast, by Application 2019 & 2032
- Table 78: Japan Crop Insurance Market Revenue (Million) Forecast, by Application 2019 & 2032
- Table 79: South Korea Crop Insurance Market Revenue (Million) Forecast, by Application 2019 & 2032
- Table 80: ASEAN Crop Insurance Market Revenue (Million) Forecast, by Application 2019 & 2032
- Table 81: Oceania Crop Insurance Market Revenue (Million) Forecast, by Application 2019 & 2032
- Table 82: Rest of Asia Pacific Crop Insurance Market Revenue (Million) Forecast, by Application 2019 & 2032
Frequently Asked Questions
1. What is the projected Compound Annual Growth Rate (CAGR) of the Crop Insurance Market ?
The projected CAGR is approximately 5.77%.
2. Which companies are prominent players in the Crop Insurance Market ?
Key companies in the market include Sompo International Holdings Ltd, PICC, Fairfax Financial Holdings Limited, American Financial Group Inc, QBE Insurance Group Limited, ICICI Lombard General Insurance Company Limited, Zurich**List Not Exhaustive, Chubb, Tokio Marine HCC, Agriculture Insurance Company of India Limited (AIC).
3. What are the main segments of the Crop Insurance Market ?
The market segments include Type, Coverage, Distribution Channel.
4. Can you provide details about the market size?
The market size is estimated to be USD 38.10 Million as of 2022.
5. What are some drivers contributing to market growth?
Government Support. Including Subsidies and Initiatives. is a Significant Driver.
6. What are the notable trends driving market growth?
Increasing Value Crop Protection Globally.
7. Are there any restraints impacting market growth?
Instances of Fraud or Misreporting can Impact the Integrity of the Crop Insurance System.
8. Can you provide examples of recent developments in the market?
September 2023: The Shrimp Crop Insurance scheme developed by the Agricultural Insurance Company was launched in India. The insurance cover starts from the initial stage to 130 days till the shrimps are ready.
9. What pricing options are available for accessing the report?
Pricing options include single-user, multi-user, and enterprise licenses priced at USD 3800, USD 4500, and USD 5800 respectively.
10. Is the market size provided in terms of value or volume?
The market size is provided in terms of value, measured in Million.
11. Are there any specific market keywords associated with the report?
Yes, the market keyword associated with the report is "Crop Insurance Market ," which aids in identifying and referencing the specific market segment covered.
12. How do I determine which pricing option suits my needs best?
The pricing options vary based on user requirements and access needs. Individual users may opt for single-user licenses, while businesses requiring broader access may choose multi-user or enterprise licenses for cost-effective access to the report.
13. Are there any additional resources or data provided in the Crop Insurance Market report?
While the report offers comprehensive insights, it's advisable to review the specific contents or supplementary materials provided to ascertain if additional resources or data are available.
14. How can I stay updated on further developments or reports in the Crop Insurance Market ?
To stay informed about further developments, trends, and reports in the Crop Insurance Market , consider subscribing to industry newsletters, following relevant companies and organizations, or regularly checking reputable industry news sources and publications.
Methodology
Step 1 - Identification of Relevant Samples Size from Population Database


Step 2 - Approaches for Defining Global Market Size (Value, Volume* & Price*)

Note*: In applicable scenarios
Step 3 - Data Sources
Primary Research
- Web Analytics
- Survey Reports
- Research Institute
- Latest Research Reports
- Opinion Leaders
Secondary Research
- Annual Reports
- White Paper
- Latest Press Release
- Industry Association
- Paid Database
- Investor Presentations

Step 4 - Data Triangulation
Involves using different sources of information in order to increase the validity of a study
These sources are likely to be stakeholders in a program - participants, other researchers, program staff, other community members, and so on.
Then we put all data in single framework & apply various statistical tools to find out the dynamic on the market.
During the analysis stage, feedback from the stakeholder groups would be compared to determine areas of agreement as well as areas of divergence
