

Key Insights
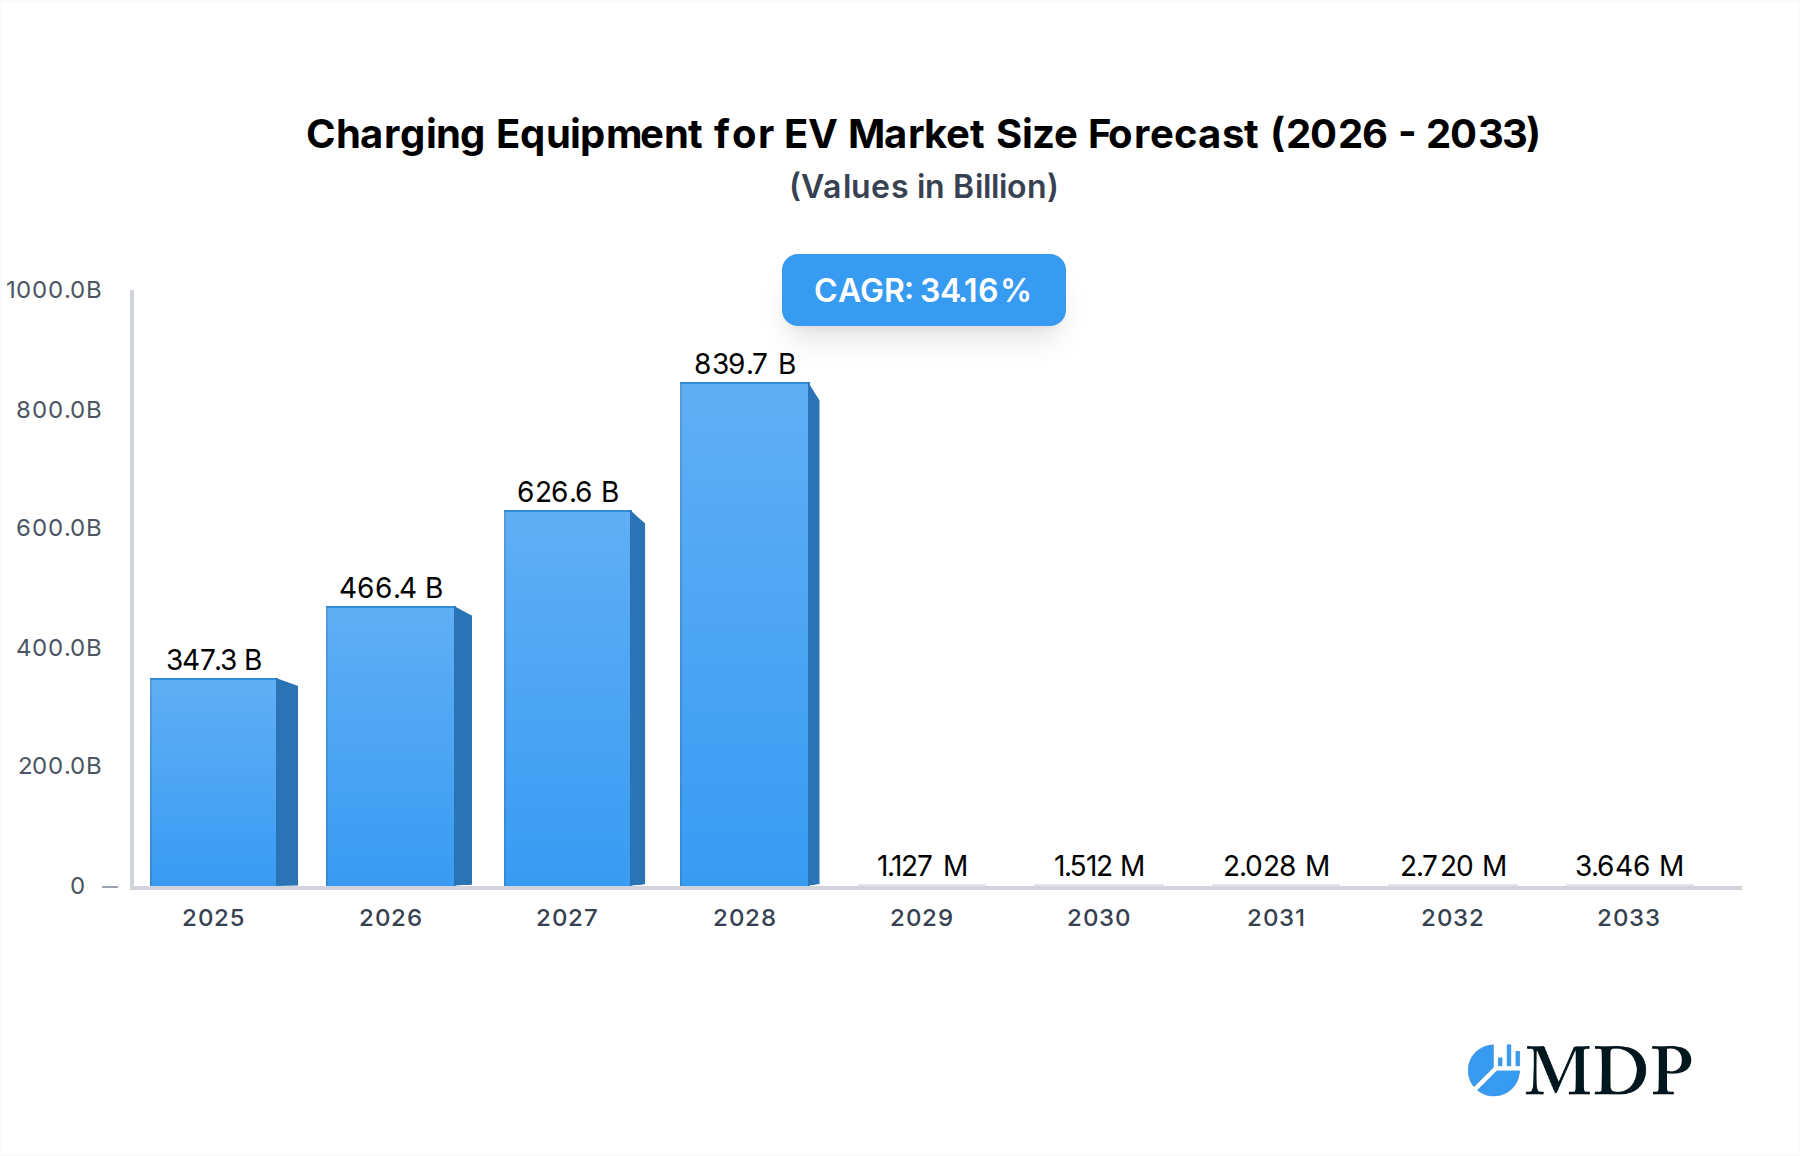
The global market for Electric Vehicle (EV) Charging Equipment is poised for explosive growth, projected to reach a substantial USD 347.29 billion by 2025. This significant valuation is underpinned by an impressive Compound Annual Growth Rate (CAGR) of 34.1%, indicating a rapid and sustained expansion in the EV charging infrastructure sector. This surge is primarily fueled by a confluence of factors: escalating consumer adoption of electric vehicles, driven by environmental concerns, government incentives, and advancements in battery technology. Furthermore, increasing investments in public charging networks by both governments and private entities are playing a crucial role in alleviating range anxiety and promoting EV ownership. The development of faster charging solutions, such as Level 3 chargers, is also a key driver, making EV charging more convenient and comparable to traditional refueling times. The market is segmented into various applications, including home/private chargers and public charging stations, with a growing emphasis on expanding the latter to support widespread EV usage. The integration of smart charging technologies, enabling grid optimization and V2G (Vehicle-to-Grid) capabilities, represents a significant emerging trend.

Charging Equipment for EV Market Size (In Billion)
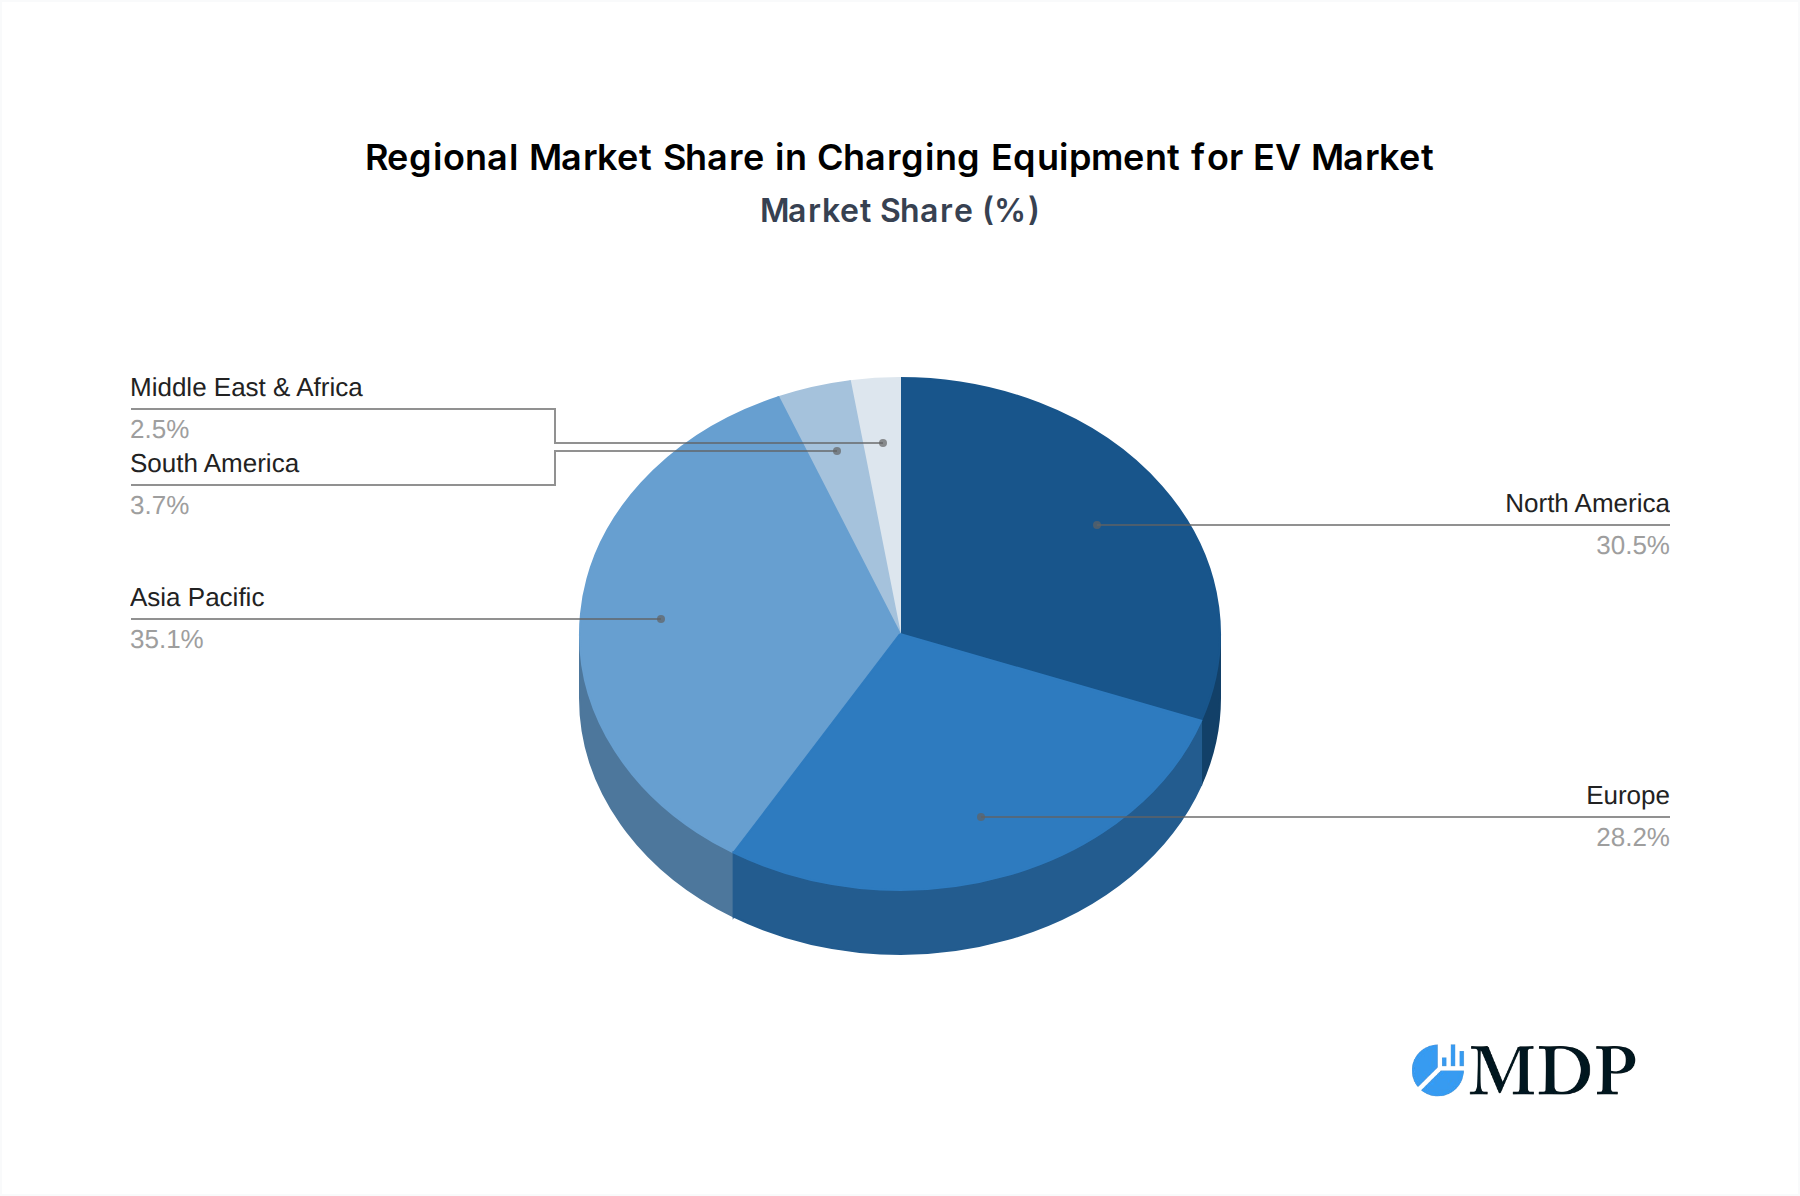
The expansion of the EV Charging Equipment market is experiencing dynamic regional penetration. North America, particularly the United States, is a frontrunner, supported by strong government mandates and a rapidly growing EV fleet. Europe, with its ambitious climate goals and robust EV sales, also represents a significant and growing market, with key countries like Germany, France, and the UK leading the charge. The Asia Pacific region, spearheaded by China, is a powerhouse in both EV manufacturing and adoption, making it a critical market for charging infrastructure development. While the market benefits from these robust drivers, certain restraints exist, including high initial installation costs for charging infrastructure, the need for grid upgrades to accommodate increased electricity demand, and the ongoing challenge of standardization across different charging technologies and connectors. Nonetheless, the overwhelming positive trajectory suggests a future where accessible and efficient EV charging is a ubiquitous reality, transforming transportation as we know it.
Charging Equipment for EV Company Market Share
This in-depth report offers a panoramic view of the global Electric Vehicle (EV) charging equipment market, dissecting its intricate dynamics, growth trajectories, and future outlook. Spanning from 2019 to 2033, with a base year of 2025, this study provides actionable insights for industry stakeholders, investors, and policymakers navigating the rapidly evolving EV charging landscape. We delve into market concentration, innovation drivers, regulatory frameworks, product substitutes, end-user trends, and M&A activities, forecasting market size and penetration with meticulous detail.
Charging Equipment for EV Market Dynamics & Concentration
The global EV charging equipment market exhibits a dynamic and moderately concentrated landscape. Innovation is primarily driven by the escalating demand for electric vehicles, fueled by environmental consciousness and government incentives. Key innovation drivers include advancements in charging speeds (Level 3), smart charging capabilities for grid integration, and the development of user-friendly charging solutions. Regulatory frameworks, such as emission standards and EV adoption mandates, play a pivotal role in shaping market growth across different regions. While product substitutes for dedicated EV charging equipment are limited, the efficiency and accessibility of charging infrastructure remain crucial competitive differentiators. End-user trends are shifting towards seamless charging experiences, with increasing adoption of home and public charging solutions. Mergers and acquisitions (M&A) are moderately active, with companies strategically acquiring innovative technologies or expanding their geographical reach. We anticipate a steady number of M&A deals throughout the forecast period, contributing to market consolidation. The market share of leading players is expected to evolve as new entrants and established automotive and energy companies vie for dominance.
Charging Equipment for EV Industry Trends & Analysis
The EV charging equipment industry is experiencing exponential growth, propelled by a confluence of technological advancements, evolving consumer preferences, and robust government support. The increasing adoption of electric vehicles globally is the primary market growth driver, creating an insatiable demand for reliable and efficient charging infrastructure. Technological disruptions, such as the advent of ultra-fast charging (Level 3), bidirectional charging (Vehicle-to-Grid or V2G), and wireless charging, are revolutionizing the charging experience, offering enhanced convenience and grid benefits. Consumer preferences are increasingly prioritizing faster charging times, smart features for remote monitoring and control, and integration with smart home ecosystems. This is leading to a surge in demand for both home charging solutions and accessible public charging networks. Competitive dynamics are intensifying, with established players and new startups fiercely competing on product innovation, pricing, and service offerings. We forecast a significant Compound Annual Growth Rate (CAGR) for the EV charging equipment market throughout the study period, reflecting its strong upward trajectory. Market penetration is steadily increasing as more countries implement supportive policies and build out charging infrastructure, making EV ownership more practical and appealing to a wider demographic. The global market size is projected to reach billions by the end of the forecast period, underscoring the immense potential of this sector.
Leading Markets & Segments in Charging Equipment for EV
The global EV charging equipment market showcases distinct leadership across various regions and segments, driven by a complex interplay of economic policies, infrastructure development, and consumer adoption rates. North America and Europe currently lead in market penetration due to supportive government incentives, stringent emission regulations, and a rapidly growing EV fleet. Asian markets, particularly China, are rapidly expanding their charging infrastructure to accommodate the world's largest EV market.
Within the Application segment:
- Public Charging is a dominant force, fueled by the necessity for accessible charging points for long-distance travel and for EV owners without dedicated home charging facilities. Government investments in public charging networks and commercial fleet electrification are key drivers.
- Home/Private Chargers are experiencing robust growth as EV adoption increases, offering unparalleled convenience and cost savings for daily commutes. The increasing trend of smart home integration further enhances the appeal of home charging solutions.
- Others, encompassing workplace charging and fleet charging depots, are emerging as significant growth areas as organizations increasingly electrify their fleets and encourage employee EV adoption.
Regarding Types of charging equipment:
- Level 2 Chargers currently hold a substantial market share, offering a balance of charging speed and affordability for both home and public installations. Their widespread adoption is a testament to their versatility.
- Level 3 (DC Fast Chargers) are rapidly gaining prominence, driven by the demand for ultra-fast charging solutions that significantly reduce charging times, making long-distance EV travel more feasible. The expansion of highway charging corridors is a major catalyst.
The dominance of these segments is further reinforced by ongoing technological advancements and strategic investments by key players aiming to capture market share in these high-demand areas.
Charging Equipment for EV Product Developments
Product innovation in EV charging equipment is rapidly advancing, focusing on enhanced charging speeds, intelligent grid integration, and improved user experience. Companies are developing next-generation Level 3 chargers capable of delivering unprecedented charging speeds, significantly reducing vehicle downtime. Smart charging functionalities are becoming standard, enabling load balancing, demand response, and integration with renewable energy sources. The development of bidirectional charging technology, allowing EVs to supply power back to the grid or home, is a significant trend. These innovations offer competitive advantages by addressing key consumer pain points like range anxiety and charging time, while also contributing to grid stability and the efficient utilization of renewable energy.
Key Drivers of Charging Equipment for EV Growth
The explosive growth in the EV charging equipment market is primarily propelled by several interconnected factors.
- Technological Advancements: The continuous evolution of battery technology, leading to longer EV ranges and faster charging capabilities, directly stimulates the demand for more advanced charging solutions. Innovations in DC fast charging and smart grid integration are pivotal.
- Economic Factors: Declining EV prices, coupled with government incentives such as tax credits and subsidies for EV purchases and charging infrastructure, make EV ownership more affordable and attractive, thereby driving demand for charging equipment.
- Regulatory Support: Increasingly stringent emission regulations and government mandates for EV adoption in major economies worldwide are forcing automakers and consumers to transition to electric vehicles, consequently boosting the charging equipment market.
Challenges in the Charging Equipment for EV Market
Despite the strong growth trajectory, the EV charging equipment market faces several significant challenges.
- High Initial Investment Costs: The upfront cost of installing charging infrastructure, especially for Level 3 chargers and large-scale public charging networks, can be a substantial barrier for individuals and businesses.
- Interoperability and Standardization Issues: A lack of universal charging standards and connector types across different regions and manufacturers can lead to confusion and inconvenience for EV users.
- Grid Capacity Limitations: The increasing demand for electricity to charge a growing EV fleet can strain existing power grids, requiring significant upgrades and investments in grid infrastructure to support widespread charging.
- Supply Chain Constraints: Global supply chain disruptions and the availability of critical raw materials for battery and charger manufacturing can impact production volumes and lead times.
Emerging Opportunities in Charging Equipment for EV
The EV charging equipment market is ripe with emerging opportunities, driven by technological breakthroughs and strategic market expansion. The development of Vehicle-to-Grid (V2G) technology presents a significant opportunity to transform EVs into mobile energy storage units, creating new revenue streams for EV owners and enhancing grid stability. Strategic partnerships between charging infrastructure providers, utility companies, and automakers are crucial for building seamless and integrated charging ecosystems. Furthermore, the untapped potential in emerging markets and the growing demand for specialized charging solutions for commercial fleets and public transportation offer substantial avenues for growth. The continued focus on renewable energy integration with charging infrastructure also opens doors for innovative business models.
Leading Players in the Charging Equipment for EV Sector
- ABB
- Schneider Electric
- Siemens
- Chargepoint
- Webasto
- Leviton
- Eaton
- Clipper Creek
- Pod Point
- Xuji Group
- Auto Electric Power Plant
- DBT-CEV
- Efacec
- NARI
- IES Synergy
Key Milestones in Charging Equipment for EV Industry
- 2019: Increased government commitments to EV targets and infrastructure funding globally.
- 2020: Significant surge in EV sales driving demand for charging solutions; development of higher-power Level 2 chargers.
- 2021: Growing investment in DC fast-charging networks; introduction of smart charging features for grid integration.
- 2022: Expansion of V2G (Vehicle-to-Grid) pilot programs and early-stage commercialization.
- 2023: Advancements in wireless charging technology; increased focus on interoperability standards.
- 2024: Continued global expansion of charging infrastructure; anticipation of further regulatory support.
- 2025 (Base Year): Expected significant acceleration in EV adoption and corresponding charging infrastructure build-out.
- 2026-2033 (Forecast Period): Continued technological innovation, market consolidation, and expansion into new geographical regions and application areas.
Strategic Outlook for Charging Equipment for EV Market
The strategic outlook for the EV charging equipment market is exceptionally promising, characterized by sustained growth accelerators and immense future potential. The continued electrification of transportation, driven by environmental concerns and government mandates, will remain the primary growth engine. Strategic opportunities lie in the expansion of fast-charging infrastructure along major transportation routes, the integration of smart charging technologies for optimized grid management, and the development of user-friendly, integrated charging solutions that enhance the overall EV ownership experience. Collaborations between technology providers, energy companies, and municipalities will be crucial for building a robust and accessible charging ecosystem, unlocking significant market value in the coming years.
Charging Equipment for EV Segmentation
-
1. Application
- 1.1. Home/Private Chargers
- 1.2. Public Charging
- 1.3. Others
-
2. Types
- 2.1. Lever 2
- 2.2. Lever 3
Charging Equipment for EV Segmentation By Geography
-
1. North America
- 1.1. United States
- 1.2. Canada
- 1.3. Mexico
-
2. South America
- 2.1. Brazil
- 2.2. Argentina
- 2.3. Rest of South America
-
3. Europe
- 3.1. United Kingdom
- 3.2. Germany
- 3.3. France
- 3.4. Italy
- 3.5. Spain
- 3.6. Russia
- 3.7. Benelux
- 3.8. Nordics
- 3.9. Rest of Europe
-
4. Middle East & Africa
- 4.1. Turkey
- 4.2. Israel
- 4.3. GCC
- 4.4. North Africa
- 4.5. South Africa
- 4.6. Rest of Middle East & Africa
-
5. Asia Pacific
- 5.1. China
- 5.2. India
- 5.3. Japan
- 5.4. South Korea
- 5.5. ASEAN
- 5.6. Oceania
- 5.7. Rest of Asia Pacific
Charging Equipment for EV Regional Market Share
Geographic Coverage of Charging Equipment for EV
Charging Equipment for EV REPORT HIGHLIGHTS
| Aspects | Details |
|---|---|
| Study Period | 2020-2034 |
| Base Year | 2025 |
| Estimated Year | 2026 |
| Forecast Period | 2026-2034 |
| Historical Period | 2020-2025 |
| Growth Rate | CAGR of 34.1% from 2020-2034 |
| Segmentation |
|
Table of Contents
- 1. Introduction
- 1.1. Research Scope
- 1.2. Market Segmentation
- 1.3. Research Methodology
- 1.4. Definitions and Assumptions
- 2. Executive Summary
- 2.1. Introduction
- 3. Market Dynamics
- 3.1. Introduction
- 3.2. Market Drivers
- 3.3. Market Restrains
- 3.4. Market Trends
- 4. Market Factor Analysis
- 4.1. Porters Five Forces
- 4.2. Supply/Value Chain
- 4.3. PESTEL analysis
- 4.4. Market Entropy
- 4.5. Patent/Trademark Analysis
- 5. Global Charging Equipment for EV Analysis, Insights and Forecast, 2020-2032
- 5.1. Market Analysis, Insights and Forecast - by Application
- 5.1.1. Home/Private Chargers
- 5.1.2. Public Charging
- 5.1.3. Others
- 5.2. Market Analysis, Insights and Forecast - by Types
- 5.2.1. Lever 2
- 5.2.2. Lever 3
- 5.3. Market Analysis, Insights and Forecast - by Region
- 5.3.1. North America
- 5.3.2. South America
- 5.3.3. Europe
- 5.3.4. Middle East & Africa
- 5.3.5. Asia Pacific
- 5.1. Market Analysis, Insights and Forecast - by Application
- 6. North America Charging Equipment for EV Analysis, Insights and Forecast, 2020-2032
- 6.1. Market Analysis, Insights and Forecast - by Application
- 6.1.1. Home/Private Chargers
- 6.1.2. Public Charging
- 6.1.3. Others
- 6.2. Market Analysis, Insights and Forecast - by Types
- 6.2.1. Lever 2
- 6.2.2. Lever 3
- 6.1. Market Analysis, Insights and Forecast - by Application
- 7. South America Charging Equipment for EV Analysis, Insights and Forecast, 2020-2032
- 7.1. Market Analysis, Insights and Forecast - by Application
- 7.1.1. Home/Private Chargers
- 7.1.2. Public Charging
- 7.1.3. Others
- 7.2. Market Analysis, Insights and Forecast - by Types
- 7.2.1. Lever 2
- 7.2.2. Lever 3
- 7.1. Market Analysis, Insights and Forecast - by Application
- 8. Europe Charging Equipment for EV Analysis, Insights and Forecast, 2020-2032
- 8.1. Market Analysis, Insights and Forecast - by Application
- 8.1.1. Home/Private Chargers
- 8.1.2. Public Charging
- 8.1.3. Others
- 8.2. Market Analysis, Insights and Forecast - by Types
- 8.2.1. Lever 2
- 8.2.2. Lever 3
- 8.1. Market Analysis, Insights and Forecast - by Application
- 9. Middle East & Africa Charging Equipment for EV Analysis, Insights and Forecast, 2020-2032
- 9.1. Market Analysis, Insights and Forecast - by Application
- 9.1.1. Home/Private Chargers
- 9.1.2. Public Charging
- 9.1.3. Others
- 9.2. Market Analysis, Insights and Forecast - by Types
- 9.2.1. Lever 2
- 9.2.2. Lever 3
- 9.1. Market Analysis, Insights and Forecast - by Application
- 10. Asia Pacific Charging Equipment for EV Analysis, Insights and Forecast, 2020-2032
- 10.1. Market Analysis, Insights and Forecast - by Application
- 10.1.1. Home/Private Chargers
- 10.1.2. Public Charging
- 10.1.3. Others
- 10.2. Market Analysis, Insights and Forecast - by Types
- 10.2.1. Lever 2
- 10.2.2. Lever 3
- 10.1. Market Analysis, Insights and Forecast - by Application
- 11. Competitive Analysis
- 11.1. Global Market Share Analysis 2025
- 11.2. Company Profiles
- 11.2.1 Webasto
- 11.2.1.1. Overview
- 11.2.1.2. Products
- 11.2.1.3. SWOT Analysis
- 11.2.1.4. Recent Developments
- 11.2.1.5. Financials (Based on Availability)
- 11.2.2 Leviton
- 11.2.2.1. Overview
- 11.2.2.2. Products
- 11.2.2.3. SWOT Analysis
- 11.2.2.4. Recent Developments
- 11.2.2.5. Financials (Based on Availability)
- 11.2.3 Auto Electric Power Plant
- 11.2.3.1. Overview
- 11.2.3.2. Products
- 11.2.3.3. SWOT Analysis
- 11.2.3.4. Recent Developments
- 11.2.3.5. Financials (Based on Availability)
- 11.2.4 Pod Point
- 11.2.4.1. Overview
- 11.2.4.2. Products
- 11.2.4.3. SWOT Analysis
- 11.2.4.4. Recent Developments
- 11.2.4.5. Financials (Based on Availability)
- 11.2.5 Clipper Creek
- 11.2.5.1. Overview
- 11.2.5.2. Products
- 11.2.5.3. SWOT Analysis
- 11.2.5.4. Recent Developments
- 11.2.5.5. Financials (Based on Availability)
- 11.2.6 Chargepoint
- 11.2.6.1. Overview
- 11.2.6.2. Products
- 11.2.6.3. SWOT Analysis
- 11.2.6.4. Recent Developments
- 11.2.6.5. Financials (Based on Availability)
- 11.2.7 Xuji Group
- 11.2.7.1. Overview
- 11.2.7.2. Products
- 11.2.7.3. SWOT Analysis
- 11.2.7.4. Recent Developments
- 11.2.7.5. Financials (Based on Availability)
- 11.2.8 Eaton
- 11.2.8.1. Overview
- 11.2.8.2. Products
- 11.2.8.3. SWOT Analysis
- 11.2.8.4. Recent Developments
- 11.2.8.5. Financials (Based on Availability)
- 11.2.9 ABB
- 11.2.9.1. Overview
- 11.2.9.2. Products
- 11.2.9.3. SWOT Analysis
- 11.2.9.4. Recent Developments
- 11.2.9.5. Financials (Based on Availability)
- 11.2.10 Schneider Electric
- 11.2.10.1. Overview
- 11.2.10.2. Products
- 11.2.10.3. SWOT Analysis
- 11.2.10.4. Recent Developments
- 11.2.10.5. Financials (Based on Availability)
- 11.2.11 Siemens
- 11.2.11.1. Overview
- 11.2.11.2. Products
- 11.2.11.3. SWOT Analysis
- 11.2.11.4. Recent Developments
- 11.2.11.5. Financials (Based on Availability)
- 11.2.12 DBT-CEV
- 11.2.12.1. Overview
- 11.2.12.2. Products
- 11.2.12.3. SWOT Analysis
- 11.2.12.4. Recent Developments
- 11.2.12.5. Financials (Based on Availability)
- 11.2.13 Efacec
- 11.2.13.1. Overview
- 11.2.13.2. Products
- 11.2.13.3. SWOT Analysis
- 11.2.13.4. Recent Developments
- 11.2.13.5. Financials (Based on Availability)
- 11.2.14 NARI
- 11.2.14.1. Overview
- 11.2.14.2. Products
- 11.2.14.3. SWOT Analysis
- 11.2.14.4. Recent Developments
- 11.2.14.5. Financials (Based on Availability)
- 11.2.15 IES Synergy
- 11.2.15.1. Overview
- 11.2.15.2. Products
- 11.2.15.3. SWOT Analysis
- 11.2.15.4. Recent Developments
- 11.2.15.5. Financials (Based on Availability)
- 11.2.1 Webasto
List of Figures
- Figure 1: Global Charging Equipment for EV Revenue Breakdown (billion, %) by Region 2025 & 2033
- Figure 2: North America Charging Equipment for EV Revenue (billion), by Application 2025 & 2033
- Figure 3: North America Charging Equipment for EV Revenue Share (%), by Application 2025 & 2033
- Figure 4: North America Charging Equipment for EV Revenue (billion), by Types 2025 & 2033
- Figure 5: North America Charging Equipment for EV Revenue Share (%), by Types 2025 & 2033
- Figure 6: North America Charging Equipment for EV Revenue (billion), by Country 2025 & 2033
- Figure 7: North America Charging Equipment for EV Revenue Share (%), by Country 2025 & 2033
- Figure 8: South America Charging Equipment for EV Revenue (billion), by Application 2025 & 2033
- Figure 9: South America Charging Equipment for EV Revenue Share (%), by Application 2025 & 2033
- Figure 10: South America Charging Equipment for EV Revenue (billion), by Types 2025 & 2033
- Figure 11: South America Charging Equipment for EV Revenue Share (%), by Types 2025 & 2033
- Figure 12: South America Charging Equipment for EV Revenue (billion), by Country 2025 & 2033
- Figure 13: South America Charging Equipment for EV Revenue Share (%), by Country 2025 & 2033
- Figure 14: Europe Charging Equipment for EV Revenue (billion), by Application 2025 & 2033
- Figure 15: Europe Charging Equipment for EV Revenue Share (%), by Application 2025 & 2033
- Figure 16: Europe Charging Equipment for EV Revenue (billion), by Types 2025 & 2033
- Figure 17: Europe Charging Equipment for EV Revenue Share (%), by Types 2025 & 2033
- Figure 18: Europe Charging Equipment for EV Revenue (billion), by Country 2025 & 2033
- Figure 19: Europe Charging Equipment for EV Revenue Share (%), by Country 2025 & 2033
- Figure 20: Middle East & Africa Charging Equipment for EV Revenue (billion), by Application 2025 & 2033
- Figure 21: Middle East & Africa Charging Equipment for EV Revenue Share (%), by Application 2025 & 2033
- Figure 22: Middle East & Africa Charging Equipment for EV Revenue (billion), by Types 2025 & 2033
- Figure 23: Middle East & Africa Charging Equipment for EV Revenue Share (%), by Types 2025 & 2033
- Figure 24: Middle East & Africa Charging Equipment for EV Revenue (billion), by Country 2025 & 2033
- Figure 25: Middle East & Africa Charging Equipment for EV Revenue Share (%), by Country 2025 & 2033
- Figure 26: Asia Pacific Charging Equipment for EV Revenue (billion), by Application 2025 & 2033
- Figure 27: Asia Pacific Charging Equipment for EV Revenue Share (%), by Application 2025 & 2033
- Figure 28: Asia Pacific Charging Equipment for EV Revenue (billion), by Types 2025 & 2033
- Figure 29: Asia Pacific Charging Equipment for EV Revenue Share (%), by Types 2025 & 2033
- Figure 30: Asia Pacific Charging Equipment for EV Revenue (billion), by Country 2025 & 2033
- Figure 31: Asia Pacific Charging Equipment for EV Revenue Share (%), by Country 2025 & 2033
List of Tables
- Table 1: Global Charging Equipment for EV Revenue billion Forecast, by Application 2020 & 2033
- Table 2: Global Charging Equipment for EV Revenue billion Forecast, by Types 2020 & 2033
- Table 3: Global Charging Equipment for EV Revenue billion Forecast, by Region 2020 & 2033
- Table 4: Global Charging Equipment for EV Revenue billion Forecast, by Application 2020 & 2033
- Table 5: Global Charging Equipment for EV Revenue billion Forecast, by Types 2020 & 2033
- Table 6: Global Charging Equipment for EV Revenue billion Forecast, by Country 2020 & 2033
- Table 7: United States Charging Equipment for EV Revenue (billion) Forecast, by Application 2020 & 2033
- Table 8: Canada Charging Equipment for EV Revenue (billion) Forecast, by Application 2020 & 2033
- Table 9: Mexico Charging Equipment for EV Revenue (billion) Forecast, by Application 2020 & 2033
- Table 10: Global Charging Equipment for EV Revenue billion Forecast, by Application 2020 & 2033
- Table 11: Global Charging Equipment for EV Revenue billion Forecast, by Types 2020 & 2033
- Table 12: Global Charging Equipment for EV Revenue billion Forecast, by Country 2020 & 2033
- Table 13: Brazil Charging Equipment for EV Revenue (billion) Forecast, by Application 2020 & 2033
- Table 14: Argentina Charging Equipment for EV Revenue (billion) Forecast, by Application 2020 & 2033
- Table 15: Rest of South America Charging Equipment for EV Revenue (billion) Forecast, by Application 2020 & 2033
- Table 16: Global Charging Equipment for EV Revenue billion Forecast, by Application 2020 & 2033
- Table 17: Global Charging Equipment for EV Revenue billion Forecast, by Types 2020 & 2033
- Table 18: Global Charging Equipment for EV Revenue billion Forecast, by Country 2020 & 2033
- Table 19: United Kingdom Charging Equipment for EV Revenue (billion) Forecast, by Application 2020 & 2033
- Table 20: Germany Charging Equipment for EV Revenue (billion) Forecast, by Application 2020 & 2033
- Table 21: France Charging Equipment for EV Revenue (billion) Forecast, by Application 2020 & 2033
- Table 22: Italy Charging Equipment for EV Revenue (billion) Forecast, by Application 2020 & 2033
- Table 23: Spain Charging Equipment for EV Revenue (billion) Forecast, by Application 2020 & 2033
- Table 24: Russia Charging Equipment for EV Revenue (billion) Forecast, by Application 2020 & 2033
- Table 25: Benelux Charging Equipment for EV Revenue (billion) Forecast, by Application 2020 & 2033
- Table 26: Nordics Charging Equipment for EV Revenue (billion) Forecast, by Application 2020 & 2033
- Table 27: Rest of Europe Charging Equipment for EV Revenue (billion) Forecast, by Application 2020 & 2033
- Table 28: Global Charging Equipment for EV Revenue billion Forecast, by Application 2020 & 2033
- Table 29: Global Charging Equipment for EV Revenue billion Forecast, by Types 2020 & 2033
- Table 30: Global Charging Equipment for EV Revenue billion Forecast, by Country 2020 & 2033
- Table 31: Turkey Charging Equipment for EV Revenue (billion) Forecast, by Application 2020 & 2033
- Table 32: Israel Charging Equipment for EV Revenue (billion) Forecast, by Application 2020 & 2033
- Table 33: GCC Charging Equipment for EV Revenue (billion) Forecast, by Application 2020 & 2033
- Table 34: North Africa Charging Equipment for EV Revenue (billion) Forecast, by Application 2020 & 2033
- Table 35: South Africa Charging Equipment for EV Revenue (billion) Forecast, by Application 2020 & 2033
- Table 36: Rest of Middle East & Africa Charging Equipment for EV Revenue (billion) Forecast, by Application 2020 & 2033
- Table 37: Global Charging Equipment for EV Revenue billion Forecast, by Application 2020 & 2033
- Table 38: Global Charging Equipment for EV Revenue billion Forecast, by Types 2020 & 2033
- Table 39: Global Charging Equipment for EV Revenue billion Forecast, by Country 2020 & 2033
- Table 40: China Charging Equipment for EV Revenue (billion) Forecast, by Application 2020 & 2033
- Table 41: India Charging Equipment for EV Revenue (billion) Forecast, by Application 2020 & 2033
- Table 42: Japan Charging Equipment for EV Revenue (billion) Forecast, by Application 2020 & 2033
- Table 43: South Korea Charging Equipment for EV Revenue (billion) Forecast, by Application 2020 & 2033
- Table 44: ASEAN Charging Equipment for EV Revenue (billion) Forecast, by Application 2020 & 2033
- Table 45: Oceania Charging Equipment for EV Revenue (billion) Forecast, by Application 2020 & 2033
- Table 46: Rest of Asia Pacific Charging Equipment for EV Revenue (billion) Forecast, by Application 2020 & 2033
Frequently Asked Questions
1. What is the projected Compound Annual Growth Rate (CAGR) of the Charging Equipment for EV?
The projected CAGR is approximately 34.1%.
2. Which companies are prominent players in the Charging Equipment for EV?
Key companies in the market include Webasto, Leviton, Auto Electric Power Plant, Pod Point, Clipper Creek, Chargepoint, Xuji Group, Eaton, ABB, Schneider Electric, Siemens, DBT-CEV, Efacec, NARI, IES Synergy.
3. What are the main segments of the Charging Equipment for EV?
The market segments include Application, Types.
4. Can you provide details about the market size?
The market size is estimated to be USD 347.29 billion as of 2022.
5. What are some drivers contributing to market growth?
N/A
6. What are the notable trends driving market growth?
N/A
7. Are there any restraints impacting market growth?
N/A
8. Can you provide examples of recent developments in the market?
N/A
9. What pricing options are available for accessing the report?
Pricing options include single-user, multi-user, and enterprise licenses priced at USD 5600.00, USD 8400.00, and USD 11200.00 respectively.
10. Is the market size provided in terms of value or volume?
The market size is provided in terms of value, measured in billion.
11. Are there any specific market keywords associated with the report?
Yes, the market keyword associated with the report is "Charging Equipment for EV," which aids in identifying and referencing the specific market segment covered.
12. How do I determine which pricing option suits my needs best?
The pricing options vary based on user requirements and access needs. Individual users may opt for single-user licenses, while businesses requiring broader access may choose multi-user or enterprise licenses for cost-effective access to the report.
13. Are there any additional resources or data provided in the Charging Equipment for EV report?
While the report offers comprehensive insights, it's advisable to review the specific contents or supplementary materials provided to ascertain if additional resources or data are available.
14. How can I stay updated on further developments or reports in the Charging Equipment for EV?
To stay informed about further developments, trends, and reports in the Charging Equipment for EV, consider subscribing to industry newsletters, following relevant companies and organizations, or regularly checking reputable industry news sources and publications.
Methodology
Step 1 - Identification of Relevant Samples Size from Population Database


Step 2 - Approaches for Defining Global Market Size (Value, Volume* & Price*)

Note*: In applicable scenarios
Step 3 - Data Sources
Primary Research
- Web Analytics
- Survey Reports
- Research Institute
- Latest Research Reports
- Opinion Leaders
Secondary Research
- Annual Reports
- White Paper
- Latest Press Release
- Industry Association
- Paid Database
- Investor Presentations

Step 4 - Data Triangulation
Involves using different sources of information in order to increase the validity of a study
These sources are likely to be stakeholders in a program - participants, other researchers, program staff, other community members, and so on.
Then we put all data in single framework & apply various statistical tools to find out the dynamic on the market.
During the analysis stage, feedback from the stakeholder groups would be compared to determine areas of agreement as well as areas of divergence