

Key Insights
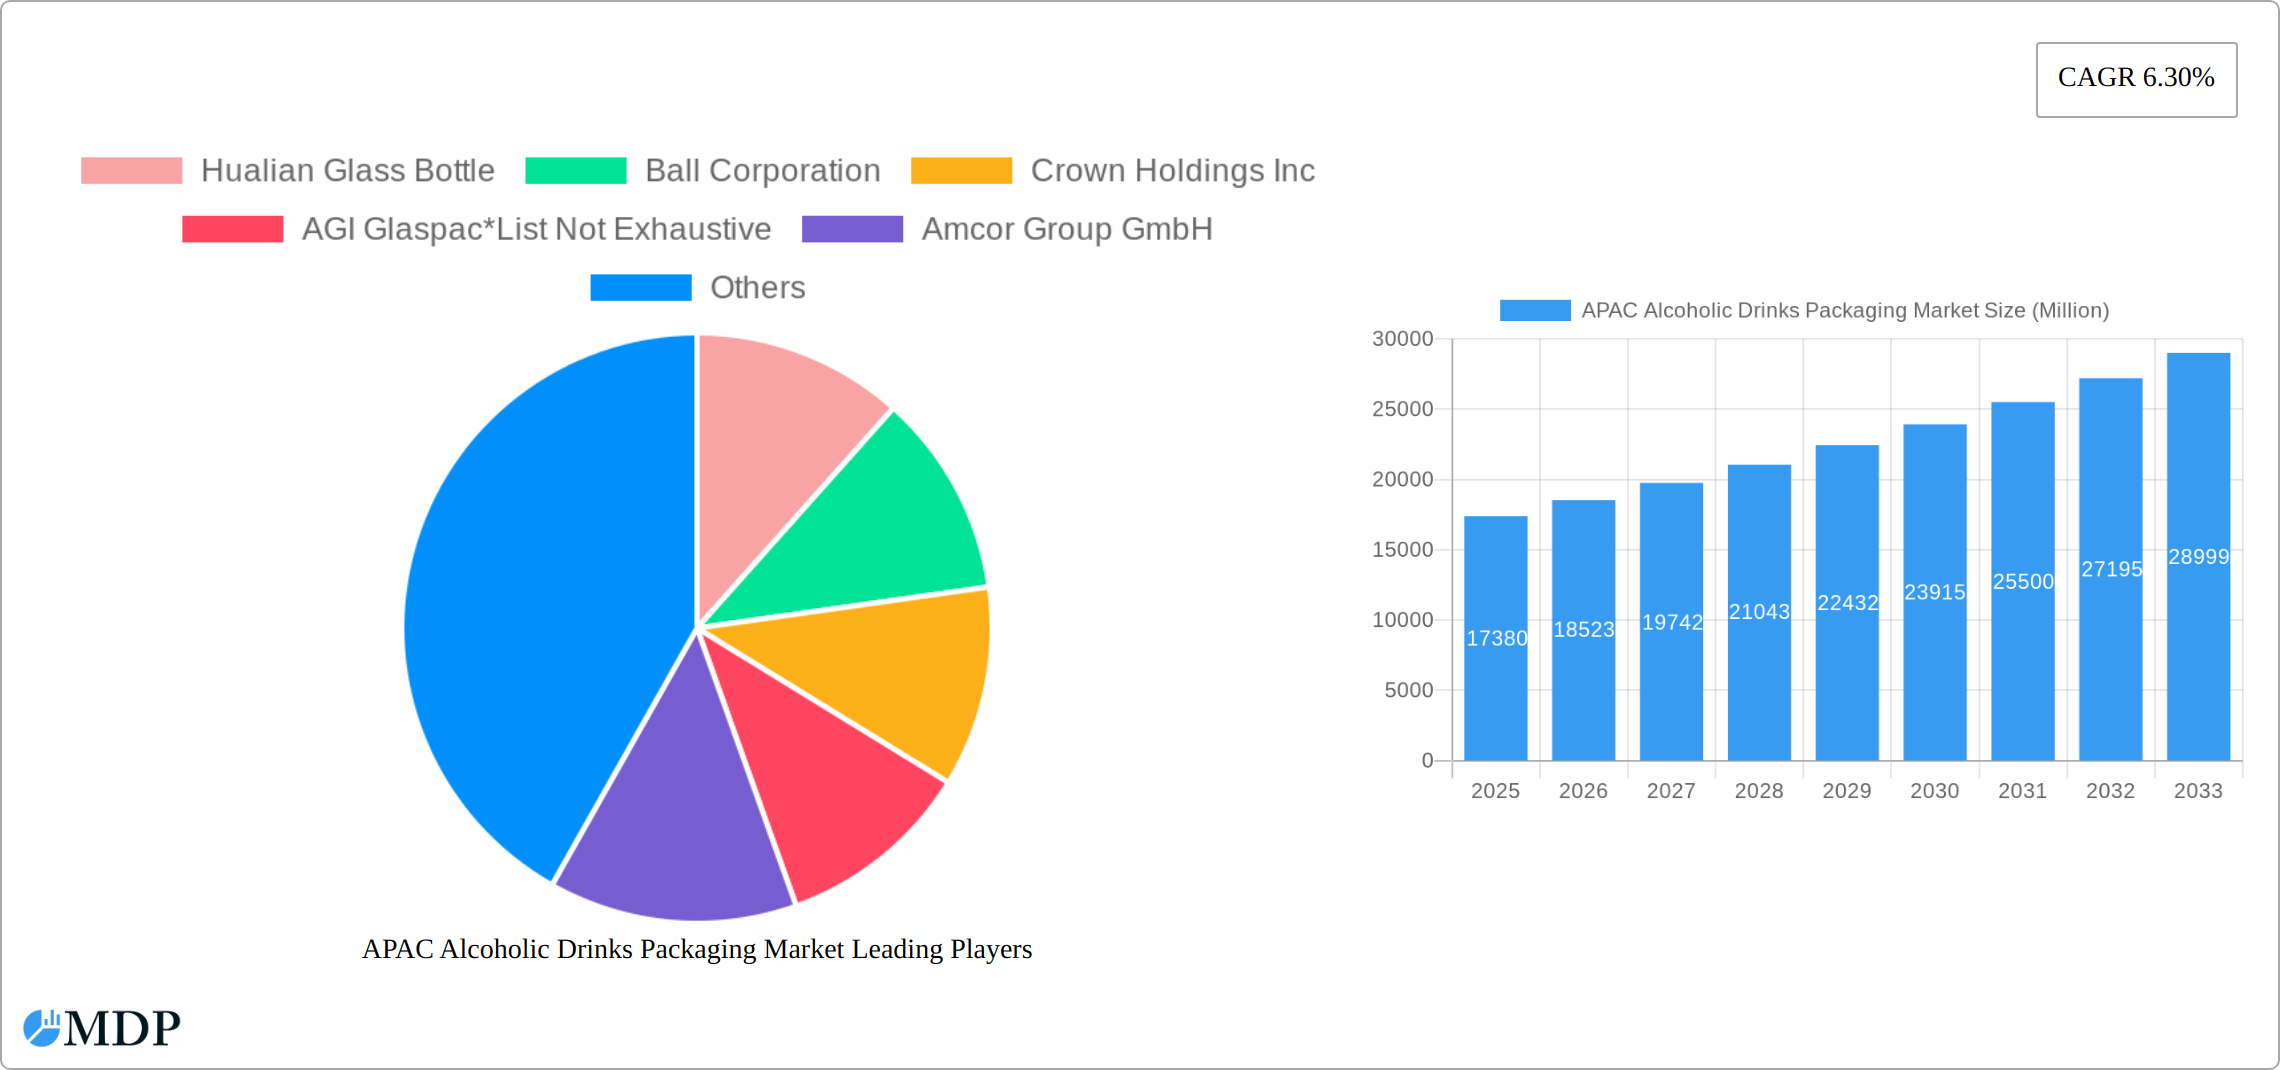
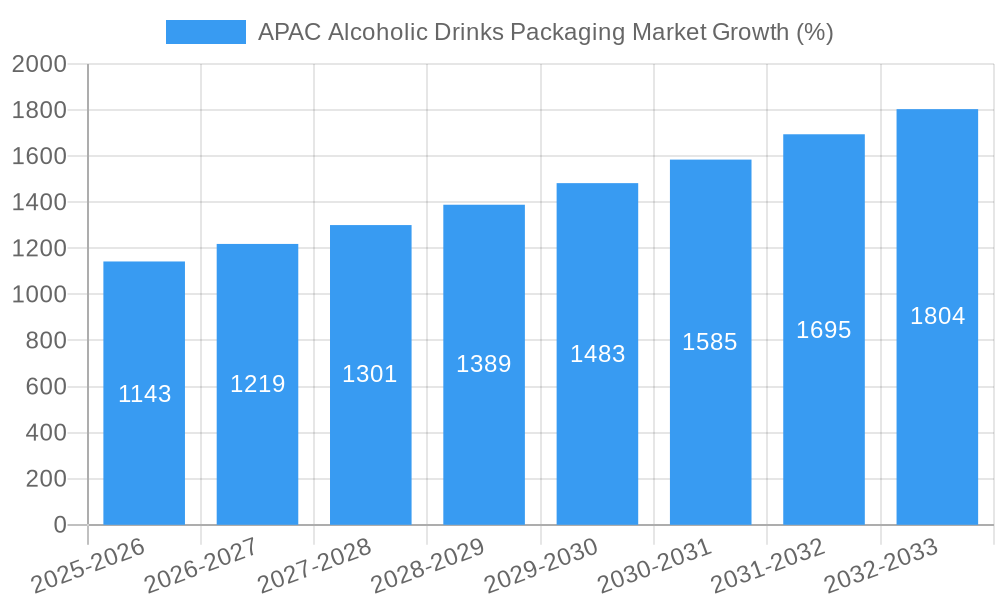
The Asia-Pacific (APAC) alcoholic drinks packaging market, valued at $17.38 billion in 2025, is projected to experience robust growth, driven by a compound annual growth rate (CAGR) of 6.30% from 2025 to 2033. This expansion is fueled by several key factors. The rising disposable incomes and changing lifestyles in developing economies like India and China are significantly boosting alcohol consumption, creating a surge in demand for attractive and functional packaging. Furthermore, the increasing preference for premium and craft alcoholic beverages is driving innovation in packaging materials and designs. Consumers are increasingly drawn to sustainable and eco-friendly packaging options, leading to a rise in demand for recyclable and biodegradable materials like paper and lightweight plastics. The growth is further propelled by advancements in packaging technologies, such as tamper-evident seals and improved barrier properties to ensure product freshness and prevent counterfeiting. While potential regulatory changes regarding alcohol packaging and labeling could pose challenges, the overall market outlook remains positive, supported by the region’s burgeoning middle class and evolving consumer preferences.
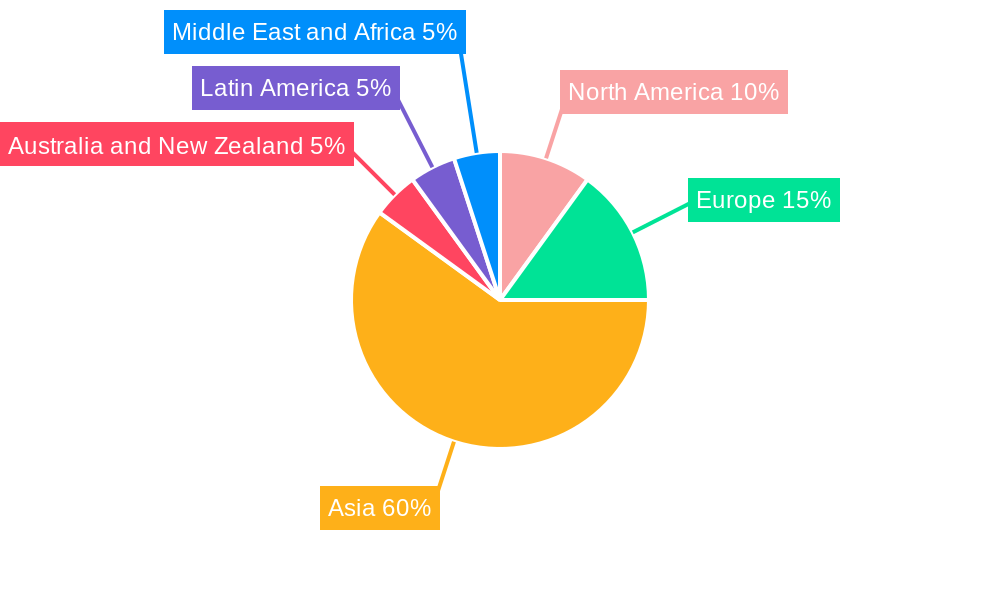
Within the APAC region, China, India, Japan, Singapore, Australia, and New Zealand represent significant market segments. China and India, with their large populations and expanding middle classes, are expected to contribute substantially to market growth. The preference for specific packaging materials varies across these countries, reflecting cultural norms and consumer habits. For example, glass bottles might retain popularity in some areas for their perceived premium image, while plastic and pouches offer cost-effectiveness and convenience. Competition within the market is intense, with major players like Hualian Glass Bottle, Ball Corporation, Crown Holdings Inc., Amcor, Mondi Group, and Gerresheimer AG vying for market share through product innovation, strategic partnerships, and geographic expansion. The forecast period (2025-2033) promises continued growth, albeit at a potentially moderated pace as the market matures and saturation in some segments is reached. However, emerging trends like e-commerce growth and increasing demand for convenient packaging formats for online alcohol sales are expected to contribute to long-term market expansion.
APAC Alcoholic Drinks Packaging Market: A Comprehensive Report (2019-2033)
This comprehensive report offers an in-depth analysis of the Asia-Pacific (APAC) alcoholic drinks packaging market, providing crucial insights for stakeholders seeking to navigate this dynamic sector. The report covers the period 2019-2033, with a focus on the estimated year 2025 and a forecast period of 2025-2033. The study analyzes market dynamics, industry trends, leading players, and future opportunities, offering actionable intelligence to drive strategic decision-making. Key segments covered include packaging materials (plastic, paper, metal, glass), product types (bottles, cans, pouches, cartons), and major APAC countries (China, India, Japan, Singapore, Australia, and New Zealand).
APAC Alcoholic Drinks Packaging Market Market Dynamics & Concentration
The APAC alcoholic drinks packaging market is characterized by a moderately concentrated yet dynamic landscape. While established global giants such as Hualian Glass Bottle, Ball Corporation, Crown Holdings Inc., AGI Glaspac, Amcor Group GmbH, Mondi Group, and Gerresheimer AG continue to command significant market share, there's a discernible rise in competition from agile, smaller packaging specialists focusing on niche segments and innovative solutions. This evolving competitive environment is shaped by several interconnected factors. Stringent and evolving regulatory frameworks, particularly those championing sustainable packaging and waste reduction, are pivotal. Simultaneously, the relentless pursuit of innovation, both in the development of novel, eco-friendly materials (like biodegradable plastics, recycled glass, and advanced paper-based solutions) and in the creation of aesthetically appealing, functional designs, is a key growth driver. Fluctuations in the prices of essential raw materials such as glass, aluminum, and paper pulp also contribute to market dynamics. Mergers and Acquisitions (M&A) have been instrumental in consolidating market power. In the historical period (2019-2024), an estimated [Insert actual number] M&A deals reshaped the competitive landscape, leading to a further concentration of market share towards larger, more integrated players. The projected market share for the top 5 players in 2025 is estimated at [Insert actual percentage] %. The regulatory patchwork across APAC countries significantly influences material choices and packaging standards, with a growing emphasis on recyclability and reduced environmental impact. Consumer preferences are increasingly leaning towards premiumization, demanding sophisticated and visually striking packaging, alongside a strong and growing demand for eco-conscious choices, pushing brands towards sustainable alternatives.
APAC Alcoholic Drinks Packaging Market Industry Trends & Analysis
The APAC alcoholic drinks packaging market exhibits a robust growth trajectory, driven primarily by rising disposable incomes, changing consumer preferences (e.g., a growing preference for premium spirits and craft beers), and the increasing popularity of alcoholic beverages across various demographics. The market is experiencing technological disruptions such as the adoption of lightweighting techniques, smart packaging solutions, and sustainable materials like biodegradable plastics and recycled paper. Consumer preferences are shifting towards convenient, aesthetically pleasing, and environmentally friendly packaging options. The market is also seeing increased competition, forcing companies to innovate and offer value-added services. The CAGR for the forecast period (2025-2033) is estimated to be xx%, with market penetration of xx% by 2033. The increasing adoption of e-commerce and online alcohol delivery services is also significantly influencing packaging requirements, demanding tamper-evident and durable solutions.
Leading Markets & Segments in APAC Alcoholic Drinks Packaging Market
China dominates the APAC alcoholic drinks packaging market, driven by its large population, expanding middle class, and burgeoning alcoholic beverage industry. India follows as a significant market, witnessing rapid growth fueled by increasing alcohol consumption.
By Material:
- Glass: Remains dominant due to its perceived premium image and suitability for various alcoholic beverages.
- Plastic: Significant share due to cost-effectiveness and versatility. Growing demand for sustainable alternatives.
- Metal: Strong presence for canned alcoholic beverages, driven by convenience and durability.
- Paper: Growing segment fueled by the increasing demand for eco-friendly options and the rise of sustainable packaging.
By Product Type:
- Bottles: The largest segment across most countries.
- Cans: Strong demand for convenience and protection.
- Pouches: Growing segment for flexible packaging solutions, primarily for smaller volumes.
- Carton: Growing share for premium products and eco-conscious consumers.
Key Drivers by Country:
- China: Economic growth, increasing urbanization, and government policies supporting the food and beverage industry.
- India: Rising disposable incomes, a young and growing population, and a shift towards westernized lifestyles.
- Japan: Mature market, with a focus on premium and innovative packaging.
- Singapore: High disposable incomes and preference for imported premium beverages.
- Australia & New Zealand: Sophisticated market with a focus on premiumization and sustainability.
APAC Alcoholic Drinks Packaging Market Product Developments
Recent product innovations include the development of lightweight packaging solutions, eco-friendly materials (such as recycled plastic and plant-based polymers), and smart packaging technologies integrating features such as RFID tagging and temperature sensors. These innovations aim to enhance product shelf life, protect against counterfeiting, and appeal to environmentally conscious consumers. The market is seeing a trend toward customization, with brands incorporating unique designs and functionalities into their packaging to boost brand visibility and consumer engagement.
Key Drivers of APAP Alcoholic Drinks Packaging Market Growth
Several factors fuel the growth of the APAC alcoholic drinks packaging market. Firstly, the rising disposable incomes and increasing urbanization across the region are driving consumption of alcoholic beverages. Secondly, the ongoing shift towards premiumization and the popularity of craft beverages necessitate innovative and sophisticated packaging. Finally, supportive government policies in some nations promoting the growth of local food and beverage industries are also contributing factors. Technological advancements, particularly in sustainable materials and packaging designs, further contribute to market expansion.
Challenges in the APAC Alcoholic Drinks Packaging Market
The APAC alcoholic drinks packaging market faces challenges including stringent regulatory compliance in relation to material composition and labeling. Supply chain disruptions, particularly related to raw materials, can significantly impact production costs and timelines. Furthermore, intense competition from domestic and international players necessitates continuous innovation to remain competitive. This increased competition also leads to pressure on profit margins. Lastly, fluctuating raw material prices pose a significant challenge.
Emerging Opportunities in APAC Alcoholic Drinks Packaging Market
The APAC alcoholic drinks packaging market is ripe with significant and diverse opportunities. The forefront of these opportunities lies in the rapid advancements in sustainable and smart packaging solutions. Innovations such as active and intelligent packaging, which can monitor freshness, provide authentication, or offer interactive consumer experiences, are gaining traction. Furthermore, the development and widespread adoption of circular economy principles in packaging design and material sourcing present a substantial avenue for growth. Strategic partnerships and collaborations between forward-thinking packaging manufacturers and alcoholic beverage brands are crucial for co-creating innovative products that resonate with evolving consumer demands and regulatory requirements. The expansion into emerging markets within the APAC region, where disposable incomes are rising and the demand for alcoholic beverages is growing, offers immense potential. Leveraging the burgeoning e-commerce sector, with its unique packaging needs for direct-to-consumer delivery, provides another significant growth avenue. Focusing on value-added services, such as customized design, supply chain optimization, and sustainability consulting, can further differentiate players and unlock deeper market penetration.
Leading Players in the APAC Alcoholic Drinks Packaging Market Sector
- Hualian Glass Bottle
- Ball Corporation
- Crown Holdings Inc
- AGI Glaspac
- Amcor Group GmbH
- Mondi Group
- Gerresheimer AG
Key Milestones in APAC Alcoholic Drinks Packaging Market Industry
- 2020: A marked increase in the adoption of sustainable packaging materials, including recycled content and biodegradable alternatives, across several key players in response to growing environmental awareness.
- 2021: The launch of numerous innovative packaging designs, many incorporating smart technologies like QR codes for traceability and augmented reality (AR) experiences, enhancing consumer engagement.
- 2022: A significant surge in Mergers and Acquisitions (M&A) activities, leading to greater market consolidation and increased market share for prominent players in the region.
- 2023: The introduction of new and stricter regulations concerning plastic packaging and single-use plastics in several key APAC markets, driving a faster shift towards alternative materials.
- 2024: Substantial investments in Research and Development (R&D) were observed, with a strong focus on developing cost-effective and scalable eco-friendly packaging solutions and advanced material technologies.
Strategic Outlook for APAC Alcoholic Drinks Packaging Market
The APAC alcoholic drinks packaging market is poised for robust and sustained long-term growth, driven by a confluence of evolving consumer preferences, technological advancements, and a growing global emphasis on sustainability. Strategic agility and a forward-looking approach will be paramount for success. Key strategic imperatives for market players include a deep and unwavering commitment to sustainability, encompassing the development and adoption of circular economy principles, the use of recycled and renewable materials, and the design of easily recyclable or compostable packaging. Continuous investment in innovation, particularly in areas like smart packaging, advanced material science (e.g., bio-based polymers, enhanced barrier properties), and functional design, will be critical to differentiate and meet the sophisticated demands of the market. Offering and enhancing value-added services, beyond just packaging production, such as design consulting, supply chain integration, and sustainability reporting, will foster stronger client relationships and create competitive advantages. Strategic partnerships and synergistic mergers and acquisitions will continue to play a pivotal role in shaping the market landscape, enabling companies to expand their capabilities, reach, and market share. Furthermore, proactively targeting and expanding into the burgeoning emerging markets within APAC, and strategically capitalizing on the exponential growth of the e-commerce sector by offering tailored packaging solutions for online retail, are crucial strategic priorities for achieving future growth and solidifying market dominance.
APAC Alcoholic Drinks Packaging Market Segmentation
-
1. Material
- 1.1. Plastic
- 1.2. Paper
- 1.3. Metal
- 1.4. Glass
-
2. Product Type
- 2.1. Bottles
- 2.2. Cans
- 2.3. Pouches
- 2.4. Carton
APAC Alcoholic Drinks Packaging Market Segmentation By Geography
-
1. North America
- 1.1. United States
- 1.2. Canada
- 1.3. Mexico
-
2. South America
- 2.1. Brazil
- 2.2. Argentina
- 2.3. Rest of South America
-
3. Europe
- 3.1. United Kingdom
- 3.2. Germany
- 3.3. France
- 3.4. Italy
- 3.5. Spain
- 3.6. Russia
- 3.7. Benelux
- 3.8. Nordics
- 3.9. Rest of Europe
-
4. Middle East & Africa
- 4.1. Turkey
- 4.2. Israel
- 4.3. GCC
- 4.4. North Africa
- 4.5. South Africa
- 4.6. Rest of Middle East & Africa
-
5. Asia Pacific
- 5.1. China
- 5.2. India
- 5.3. Japan
- 5.4. South Korea
- 5.5. ASEAN
- 5.6. Oceania
- 5.7. Rest of Asia Pacific
APAC Alcoholic Drinks Packaging Market REPORT HIGHLIGHTS
| Aspects | Details |
|---|---|
| Study Period | 2019-2033 |
| Base Year | 2024 |
| Estimated Year | 2025 |
| Forecast Period | 2025-2033 |
| Historical Period | 2019-2024 |
| Growth Rate | CAGR of 6.30% from 2019-2033 |
| Segmentation |
|
Table of Contents
- 1. Introduction
- 1.1. Research Scope
- 1.2. Market Segmentation
- 1.3. Research Methodology
- 1.4. Definitions and Assumptions
- 2. Executive Summary
- 2.1. Introduction
- 3. Market Dynamics
- 3.1. Introduction
- 3.2. Market Drivers
- 3.2.1. Increasing Demand for Sustainable Packaging; Increasing Consumption of Alcoholic Drinks in Asia
- 3.3. Market Restrains
- 3.3.1. Government Regulation for Plastic Usage
- 3.4. Market Trends
- 3.4.1. Significant Growth in Metal Packaging to Boost the Market
- 4. Market Factor Analysis
- 4.1. Porters Five Forces
- 4.2. Supply/Value Chain
- 4.3. PESTEL analysis
- 4.4. Market Entropy
- 4.5. Patent/Trademark Analysis
- 5. Global APAC Alcoholic Drinks Packaging Market Analysis, Insights and Forecast, 2019-2031
- 5.1. Market Analysis, Insights and Forecast - by Material
- 5.1.1. Plastic
- 5.1.2. Paper
- 5.1.3. Metal
- 5.1.4. Glass
- 5.2. Market Analysis, Insights and Forecast - by Product Type
- 5.2.1. Bottles
- 5.2.2. Cans
- 5.2.3. Pouches
- 5.2.4. Carton
- 5.3. Market Analysis, Insights and Forecast - by Region
- 5.3.1. North America
- 5.3.2. South America
- 5.3.3. Europe
- 5.3.4. Middle East & Africa
- 5.3.5. Asia Pacific
- 5.1. Market Analysis, Insights and Forecast - by Material
- 6. North America APAC Alcoholic Drinks Packaging Market Analysis, Insights and Forecast, 2019-2031
- 6.1. Market Analysis, Insights and Forecast - by Material
- 6.1.1. Plastic
- 6.1.2. Paper
- 6.1.3. Metal
- 6.1.4. Glass
- 6.2. Market Analysis, Insights and Forecast - by Product Type
- 6.2.1. Bottles
- 6.2.2. Cans
- 6.2.3. Pouches
- 6.2.4. Carton
- 6.1. Market Analysis, Insights and Forecast - by Material
- 7. South America APAC Alcoholic Drinks Packaging Market Analysis, Insights and Forecast, 2019-2031
- 7.1. Market Analysis, Insights and Forecast - by Material
- 7.1.1. Plastic
- 7.1.2. Paper
- 7.1.3. Metal
- 7.1.4. Glass
- 7.2. Market Analysis, Insights and Forecast - by Product Type
- 7.2.1. Bottles
- 7.2.2. Cans
- 7.2.3. Pouches
- 7.2.4. Carton
- 7.1. Market Analysis, Insights and Forecast - by Material
- 8. Europe APAC Alcoholic Drinks Packaging Market Analysis, Insights and Forecast, 2019-2031
- 8.1. Market Analysis, Insights and Forecast - by Material
- 8.1.1. Plastic
- 8.1.2. Paper
- 8.1.3. Metal
- 8.1.4. Glass
- 8.2. Market Analysis, Insights and Forecast - by Product Type
- 8.2.1. Bottles
- 8.2.2. Cans
- 8.2.3. Pouches
- 8.2.4. Carton
- 8.1. Market Analysis, Insights and Forecast - by Material
- 9. Middle East & Africa APAC Alcoholic Drinks Packaging Market Analysis, Insights and Forecast, 2019-2031
- 9.1. Market Analysis, Insights and Forecast - by Material
- 9.1.1. Plastic
- 9.1.2. Paper
- 9.1.3. Metal
- 9.1.4. Glass
- 9.2. Market Analysis, Insights and Forecast - by Product Type
- 9.2.1. Bottles
- 9.2.2. Cans
- 9.2.3. Pouches
- 9.2.4. Carton
- 9.1. Market Analysis, Insights and Forecast - by Material
- 10. Asia Pacific APAC Alcoholic Drinks Packaging Market Analysis, Insights and Forecast, 2019-2031
- 10.1. Market Analysis, Insights and Forecast - by Material
- 10.1.1. Plastic
- 10.1.2. Paper
- 10.1.3. Metal
- 10.1.4. Glass
- 10.2. Market Analysis, Insights and Forecast - by Product Type
- 10.2.1. Bottles
- 10.2.2. Cans
- 10.2.3. Pouches
- 10.2.4. Carton
- 10.1. Market Analysis, Insights and Forecast - by Material
- 11. North America APAC Alcoholic Drinks Packaging Market Analysis, Insights and Forecast, 2019-2031
- 11.1. Market Analysis, Insights and Forecast - By Country/Sub-region
- 11.1.1.
- 12. Europe APAC Alcoholic Drinks Packaging Market Analysis, Insights and Forecast, 2019-2031
- 12.1. Market Analysis, Insights and Forecast - By Country/Sub-region
- 12.1.1.
- 13. Asia APAC Alcoholic Drinks Packaging Market Analysis, Insights and Forecast, 2019-2031
- 13.1. Market Analysis, Insights and Forecast - By Country/Sub-region
- 13.1.1.
- 14. Australia and New Zealand APAC Alcoholic Drinks Packaging Market Analysis, Insights and Forecast, 2019-2031
- 14.1. Market Analysis, Insights and Forecast - By Country/Sub-region
- 14.1.1.
- 15. Latin America APAC Alcoholic Drinks Packaging Market Analysis, Insights and Forecast, 2019-2031
- 15.1. Market Analysis, Insights and Forecast - By Country/Sub-region
- 15.1.1.
- 16. Middle East and Africa APAC Alcoholic Drinks Packaging Market Analysis, Insights and Forecast, 2019-2031
- 16.1. Market Analysis, Insights and Forecast - By Country/Sub-region
- 16.1.1.
- 17. Competitive Analysis
- 17.1. Global Market Share Analysis 2024
- 17.2. Company Profiles
- 17.2.1 Hualian Glass Bottle
- 17.2.1.1. Overview
- 17.2.1.2. Products
- 17.2.1.3. SWOT Analysis
- 17.2.1.4. Recent Developments
- 17.2.1.5. Financials (Based on Availability)
- 17.2.2 Ball Corporation
- 17.2.2.1. Overview
- 17.2.2.2. Products
- 17.2.2.3. SWOT Analysis
- 17.2.2.4. Recent Developments
- 17.2.2.5. Financials (Based on Availability)
- 17.2.3 Crown Holdings Inc
- 17.2.3.1. Overview
- 17.2.3.2. Products
- 17.2.3.3. SWOT Analysis
- 17.2.3.4. Recent Developments
- 17.2.3.5. Financials (Based on Availability)
- 17.2.4 AGI Glaspac*List Not Exhaustive
- 17.2.4.1. Overview
- 17.2.4.2. Products
- 17.2.4.3. SWOT Analysis
- 17.2.4.4. Recent Developments
- 17.2.4.5. Financials (Based on Availability)
- 17.2.5 Amcor Group GmbH
- 17.2.5.1. Overview
- 17.2.5.2. Products
- 17.2.5.3. SWOT Analysis
- 17.2.5.4. Recent Developments
- 17.2.5.5. Financials (Based on Availability)
- 17.2.6 Mondi Group
- 17.2.6.1. Overview
- 17.2.6.2. Products
- 17.2.6.3. SWOT Analysis
- 17.2.6.4. Recent Developments
- 17.2.6.5. Financials (Based on Availability)
- 17.2.7 Gerresheimer AG
- 17.2.7.1. Overview
- 17.2.7.2. Products
- 17.2.7.3. SWOT Analysis
- 17.2.7.4. Recent Developments
- 17.2.7.5. Financials (Based on Availability)
- 17.2.1 Hualian Glass Bottle
List of Figures
- Figure 1: Global APAC Alcoholic Drinks Packaging Market Revenue Breakdown (Million, %) by Region 2024 & 2032
- Figure 2: North America APAC Alcoholic Drinks Packaging Market Revenue (Million), by Country 2024 & 2032
- Figure 3: North America APAC Alcoholic Drinks Packaging Market Revenue Share (%), by Country 2024 & 2032
- Figure 4: Europe APAC Alcoholic Drinks Packaging Market Revenue (Million), by Country 2024 & 2032
- Figure 5: Europe APAC Alcoholic Drinks Packaging Market Revenue Share (%), by Country 2024 & 2032
- Figure 6: Asia APAC Alcoholic Drinks Packaging Market Revenue (Million), by Country 2024 & 2032
- Figure 7: Asia APAC Alcoholic Drinks Packaging Market Revenue Share (%), by Country 2024 & 2032
- Figure 8: Australia and New Zealand APAC Alcoholic Drinks Packaging Market Revenue (Million), by Country 2024 & 2032
- Figure 9: Australia and New Zealand APAC Alcoholic Drinks Packaging Market Revenue Share (%), by Country 2024 & 2032
- Figure 10: Latin America APAC Alcoholic Drinks Packaging Market Revenue (Million), by Country 2024 & 2032
- Figure 11: Latin America APAC Alcoholic Drinks Packaging Market Revenue Share (%), by Country 2024 & 2032
- Figure 12: Middle East and Africa APAC Alcoholic Drinks Packaging Market Revenue (Million), by Country 2024 & 2032
- Figure 13: Middle East and Africa APAC Alcoholic Drinks Packaging Market Revenue Share (%), by Country 2024 & 2032
- Figure 14: North America APAC Alcoholic Drinks Packaging Market Revenue (Million), by Material 2024 & 2032
- Figure 15: North America APAC Alcoholic Drinks Packaging Market Revenue Share (%), by Material 2024 & 2032
- Figure 16: North America APAC Alcoholic Drinks Packaging Market Revenue (Million), by Product Type 2024 & 2032
- Figure 17: North America APAC Alcoholic Drinks Packaging Market Revenue Share (%), by Product Type 2024 & 2032
- Figure 18: North America APAC Alcoholic Drinks Packaging Market Revenue (Million), by Country 2024 & 2032
- Figure 19: North America APAC Alcoholic Drinks Packaging Market Revenue Share (%), by Country 2024 & 2032
- Figure 20: South America APAC Alcoholic Drinks Packaging Market Revenue (Million), by Material 2024 & 2032
- Figure 21: South America APAC Alcoholic Drinks Packaging Market Revenue Share (%), by Material 2024 & 2032
- Figure 22: South America APAC Alcoholic Drinks Packaging Market Revenue (Million), by Product Type 2024 & 2032
- Figure 23: South America APAC Alcoholic Drinks Packaging Market Revenue Share (%), by Product Type 2024 & 2032
- Figure 24: South America APAC Alcoholic Drinks Packaging Market Revenue (Million), by Country 2024 & 2032
- Figure 25: South America APAC Alcoholic Drinks Packaging Market Revenue Share (%), by Country 2024 & 2032
- Figure 26: Europe APAC Alcoholic Drinks Packaging Market Revenue (Million), by Material 2024 & 2032
- Figure 27: Europe APAC Alcoholic Drinks Packaging Market Revenue Share (%), by Material 2024 & 2032
- Figure 28: Europe APAC Alcoholic Drinks Packaging Market Revenue (Million), by Product Type 2024 & 2032
- Figure 29: Europe APAC Alcoholic Drinks Packaging Market Revenue Share (%), by Product Type 2024 & 2032
- Figure 30: Europe APAC Alcoholic Drinks Packaging Market Revenue (Million), by Country 2024 & 2032
- Figure 31: Europe APAC Alcoholic Drinks Packaging Market Revenue Share (%), by Country 2024 & 2032
- Figure 32: Middle East & Africa APAC Alcoholic Drinks Packaging Market Revenue (Million), by Material 2024 & 2032
- Figure 33: Middle East & Africa APAC Alcoholic Drinks Packaging Market Revenue Share (%), by Material 2024 & 2032
- Figure 34: Middle East & Africa APAC Alcoholic Drinks Packaging Market Revenue (Million), by Product Type 2024 & 2032
- Figure 35: Middle East & Africa APAC Alcoholic Drinks Packaging Market Revenue Share (%), by Product Type 2024 & 2032
- Figure 36: Middle East & Africa APAC Alcoholic Drinks Packaging Market Revenue (Million), by Country 2024 & 2032
- Figure 37: Middle East & Africa APAC Alcoholic Drinks Packaging Market Revenue Share (%), by Country 2024 & 2032
- Figure 38: Asia Pacific APAC Alcoholic Drinks Packaging Market Revenue (Million), by Material 2024 & 2032
- Figure 39: Asia Pacific APAC Alcoholic Drinks Packaging Market Revenue Share (%), by Material 2024 & 2032
- Figure 40: Asia Pacific APAC Alcoholic Drinks Packaging Market Revenue (Million), by Product Type 2024 & 2032
- Figure 41: Asia Pacific APAC Alcoholic Drinks Packaging Market Revenue Share (%), by Product Type 2024 & 2032
- Figure 42: Asia Pacific APAC Alcoholic Drinks Packaging Market Revenue (Million), by Country 2024 & 2032
- Figure 43: Asia Pacific APAC Alcoholic Drinks Packaging Market Revenue Share (%), by Country 2024 & 2032
List of Tables
- Table 1: Global APAC Alcoholic Drinks Packaging Market Revenue Million Forecast, by Region 2019 & 2032
- Table 2: Global APAC Alcoholic Drinks Packaging Market Revenue Million Forecast, by Material 2019 & 2032
- Table 3: Global APAC Alcoholic Drinks Packaging Market Revenue Million Forecast, by Product Type 2019 & 2032
- Table 4: Global APAC Alcoholic Drinks Packaging Market Revenue Million Forecast, by Region 2019 & 2032
- Table 5: Global APAC Alcoholic Drinks Packaging Market Revenue Million Forecast, by Country 2019 & 2032
- Table 6: APAC Alcoholic Drinks Packaging Market Revenue (Million) Forecast, by Application 2019 & 2032
- Table 7: Global APAC Alcoholic Drinks Packaging Market Revenue Million Forecast, by Country 2019 & 2032
- Table 8: APAC Alcoholic Drinks Packaging Market Revenue (Million) Forecast, by Application 2019 & 2032
- Table 9: Global APAC Alcoholic Drinks Packaging Market Revenue Million Forecast, by Country 2019 & 2032
- Table 10: APAC Alcoholic Drinks Packaging Market Revenue (Million) Forecast, by Application 2019 & 2032
- Table 11: Global APAC Alcoholic Drinks Packaging Market Revenue Million Forecast, by Country 2019 & 2032
- Table 12: APAC Alcoholic Drinks Packaging Market Revenue (Million) Forecast, by Application 2019 & 2032
- Table 13: Global APAC Alcoholic Drinks Packaging Market Revenue Million Forecast, by Country 2019 & 2032
- Table 14: APAC Alcoholic Drinks Packaging Market Revenue (Million) Forecast, by Application 2019 & 2032
- Table 15: Global APAC Alcoholic Drinks Packaging Market Revenue Million Forecast, by Country 2019 & 2032
- Table 16: APAC Alcoholic Drinks Packaging Market Revenue (Million) Forecast, by Application 2019 & 2032
- Table 17: Global APAC Alcoholic Drinks Packaging Market Revenue Million Forecast, by Material 2019 & 2032
- Table 18: Global APAC Alcoholic Drinks Packaging Market Revenue Million Forecast, by Product Type 2019 & 2032
- Table 19: Global APAC Alcoholic Drinks Packaging Market Revenue Million Forecast, by Country 2019 & 2032
- Table 20: United States APAC Alcoholic Drinks Packaging Market Revenue (Million) Forecast, by Application 2019 & 2032
- Table 21: Canada APAC Alcoholic Drinks Packaging Market Revenue (Million) Forecast, by Application 2019 & 2032
- Table 22: Mexico APAC Alcoholic Drinks Packaging Market Revenue (Million) Forecast, by Application 2019 & 2032
- Table 23: Global APAC Alcoholic Drinks Packaging Market Revenue Million Forecast, by Material 2019 & 2032
- Table 24: Global APAC Alcoholic Drinks Packaging Market Revenue Million Forecast, by Product Type 2019 & 2032
- Table 25: Global APAC Alcoholic Drinks Packaging Market Revenue Million Forecast, by Country 2019 & 2032
- Table 26: Brazil APAC Alcoholic Drinks Packaging Market Revenue (Million) Forecast, by Application 2019 & 2032
- Table 27: Argentina APAC Alcoholic Drinks Packaging Market Revenue (Million) Forecast, by Application 2019 & 2032
- Table 28: Rest of South America APAC Alcoholic Drinks Packaging Market Revenue (Million) Forecast, by Application 2019 & 2032
- Table 29: Global APAC Alcoholic Drinks Packaging Market Revenue Million Forecast, by Material 2019 & 2032
- Table 30: Global APAC Alcoholic Drinks Packaging Market Revenue Million Forecast, by Product Type 2019 & 2032
- Table 31: Global APAC Alcoholic Drinks Packaging Market Revenue Million Forecast, by Country 2019 & 2032
- Table 32: United Kingdom APAC Alcoholic Drinks Packaging Market Revenue (Million) Forecast, by Application 2019 & 2032
- Table 33: Germany APAC Alcoholic Drinks Packaging Market Revenue (Million) Forecast, by Application 2019 & 2032
- Table 34: France APAC Alcoholic Drinks Packaging Market Revenue (Million) Forecast, by Application 2019 & 2032
- Table 35: Italy APAC Alcoholic Drinks Packaging Market Revenue (Million) Forecast, by Application 2019 & 2032
- Table 36: Spain APAC Alcoholic Drinks Packaging Market Revenue (Million) Forecast, by Application 2019 & 2032
- Table 37: Russia APAC Alcoholic Drinks Packaging Market Revenue (Million) Forecast, by Application 2019 & 2032
- Table 38: Benelux APAC Alcoholic Drinks Packaging Market Revenue (Million) Forecast, by Application 2019 & 2032
- Table 39: Nordics APAC Alcoholic Drinks Packaging Market Revenue (Million) Forecast, by Application 2019 & 2032
- Table 40: Rest of Europe APAC Alcoholic Drinks Packaging Market Revenue (Million) Forecast, by Application 2019 & 2032
- Table 41: Global APAC Alcoholic Drinks Packaging Market Revenue Million Forecast, by Material 2019 & 2032
- Table 42: Global APAC Alcoholic Drinks Packaging Market Revenue Million Forecast, by Product Type 2019 & 2032
- Table 43: Global APAC Alcoholic Drinks Packaging Market Revenue Million Forecast, by Country 2019 & 2032
- Table 44: Turkey APAC Alcoholic Drinks Packaging Market Revenue (Million) Forecast, by Application 2019 & 2032
- Table 45: Israel APAC Alcoholic Drinks Packaging Market Revenue (Million) Forecast, by Application 2019 & 2032
- Table 46: GCC APAC Alcoholic Drinks Packaging Market Revenue (Million) Forecast, by Application 2019 & 2032
- Table 47: North Africa APAC Alcoholic Drinks Packaging Market Revenue (Million) Forecast, by Application 2019 & 2032
- Table 48: South Africa APAC Alcoholic Drinks Packaging Market Revenue (Million) Forecast, by Application 2019 & 2032
- Table 49: Rest of Middle East & Africa APAC Alcoholic Drinks Packaging Market Revenue (Million) Forecast, by Application 2019 & 2032
- Table 50: Global APAC Alcoholic Drinks Packaging Market Revenue Million Forecast, by Material 2019 & 2032
- Table 51: Global APAC Alcoholic Drinks Packaging Market Revenue Million Forecast, by Product Type 2019 & 2032
- Table 52: Global APAC Alcoholic Drinks Packaging Market Revenue Million Forecast, by Country 2019 & 2032
- Table 53: China APAC Alcoholic Drinks Packaging Market Revenue (Million) Forecast, by Application 2019 & 2032
- Table 54: India APAC Alcoholic Drinks Packaging Market Revenue (Million) Forecast, by Application 2019 & 2032
- Table 55: Japan APAC Alcoholic Drinks Packaging Market Revenue (Million) Forecast, by Application 2019 & 2032
- Table 56: South Korea APAC Alcoholic Drinks Packaging Market Revenue (Million) Forecast, by Application 2019 & 2032
- Table 57: ASEAN APAC Alcoholic Drinks Packaging Market Revenue (Million) Forecast, by Application 2019 & 2032
- Table 58: Oceania APAC Alcoholic Drinks Packaging Market Revenue (Million) Forecast, by Application 2019 & 2032
- Table 59: Rest of Asia Pacific APAC Alcoholic Drinks Packaging Market Revenue (Million) Forecast, by Application 2019 & 2032
Frequently Asked Questions
1. What is the projected Compound Annual Growth Rate (CAGR) of the APAC Alcoholic Drinks Packaging Market?
The projected CAGR is approximately 6.30%.
2. Which companies are prominent players in the APAC Alcoholic Drinks Packaging Market?
Key companies in the market include Hualian Glass Bottle, Ball Corporation, Crown Holdings Inc, AGI Glaspac*List Not Exhaustive, Amcor Group GmbH, Mondi Group, Gerresheimer AG.
3. What are the main segments of the APAC Alcoholic Drinks Packaging Market?
The market segments include Material, Product Type.
4. Can you provide details about the market size?
The market size is estimated to be USD 17.38 Million as of 2022.
5. What are some drivers contributing to market growth?
Increasing Demand for Sustainable Packaging; Increasing Consumption of Alcoholic Drinks in Asia.
6. What are the notable trends driving market growth?
Significant Growth in Metal Packaging to Boost the Market.
7. Are there any restraints impacting market growth?
Government Regulation for Plastic Usage.
8. Can you provide examples of recent developments in the market?
N/A
9. What pricing options are available for accessing the report?
Pricing options include single-user, multi-user, and enterprise licenses priced at USD 4750, USD 4950, and USD 6800 respectively.
10. Is the market size provided in terms of value or volume?
The market size is provided in terms of value, measured in Million.
11. Are there any specific market keywords associated with the report?
Yes, the market keyword associated with the report is "APAC Alcoholic Drinks Packaging Market," which aids in identifying and referencing the specific market segment covered.
12. How do I determine which pricing option suits my needs best?
The pricing options vary based on user requirements and access needs. Individual users may opt for single-user licenses, while businesses requiring broader access may choose multi-user or enterprise licenses for cost-effective access to the report.
13. Are there any additional resources or data provided in the APAC Alcoholic Drinks Packaging Market report?
While the report offers comprehensive insights, it's advisable to review the specific contents or supplementary materials provided to ascertain if additional resources or data are available.
14. How can I stay updated on further developments or reports in the APAC Alcoholic Drinks Packaging Market?
To stay informed about further developments, trends, and reports in the APAC Alcoholic Drinks Packaging Market, consider subscribing to industry newsletters, following relevant companies and organizations, or regularly checking reputable industry news sources and publications.
Methodology
Step 1 - Identification of Relevant Samples Size from Population Database


Step 2 - Approaches for Defining Global Market Size (Value, Volume* & Price*)

Note*: In applicable scenarios
Step 3 - Data Sources
Primary Research
- Web Analytics
- Survey Reports
- Research Institute
- Latest Research Reports
- Opinion Leaders
Secondary Research
- Annual Reports
- White Paper
- Latest Press Release
- Industry Association
- Paid Database
- Investor Presentations

Step 4 - Data Triangulation
Involves using different sources of information in order to increase the validity of a study
These sources are likely to be stakeholders in a program - participants, other researchers, program staff, other community members, and so on.
Then we put all data in single framework & apply various statistical tools to find out the dynamic on the market.
During the analysis stage, feedback from the stakeholder groups would be compared to determine areas of agreement as well as areas of divergence
