

Key Insights
The global wood pulp market, valued at $166.65 billion in 2025, is poised for sustained expansion, projecting a compound annual growth rate (CAGR) of 2.7% from 2025 to 2033. Key growth drivers include the rapidly expanding packaging industry, propelled by e-commerce proliferation and escalating consumer demand. The increasing adoption of sustainable and eco-friendly materials across sectors like textiles and paper manufacturing further fuels demand for wood pulp. Innovations in pulp production, enhancing efficiency and minimizing environmental impact, also contribute positively to market growth. However, market expansion faces potential constraints from volatile raw material pricing and stringent environmental regulations. Segmentation analysis highlights the significant contribution of chemical pulp in premium paper and packaging, alongside mechanical pulp for newsprint and lower-grade paper. Dissolving pulp, essential for textiles and specialty products, represents a growing niche segment. While North America and Europe currently dominate market share, the Asia-Pacific region, especially China and India, is expected to experience robust growth driven by rapid industrialization and population increases. Industry leaders such as Kimberly-Clark, Procter & Gamble, Georgia-Pacific, International Paper, and UPM are actively pursuing capacity expansions, technological advancements, and strategic acquisitions to leverage these market trends.
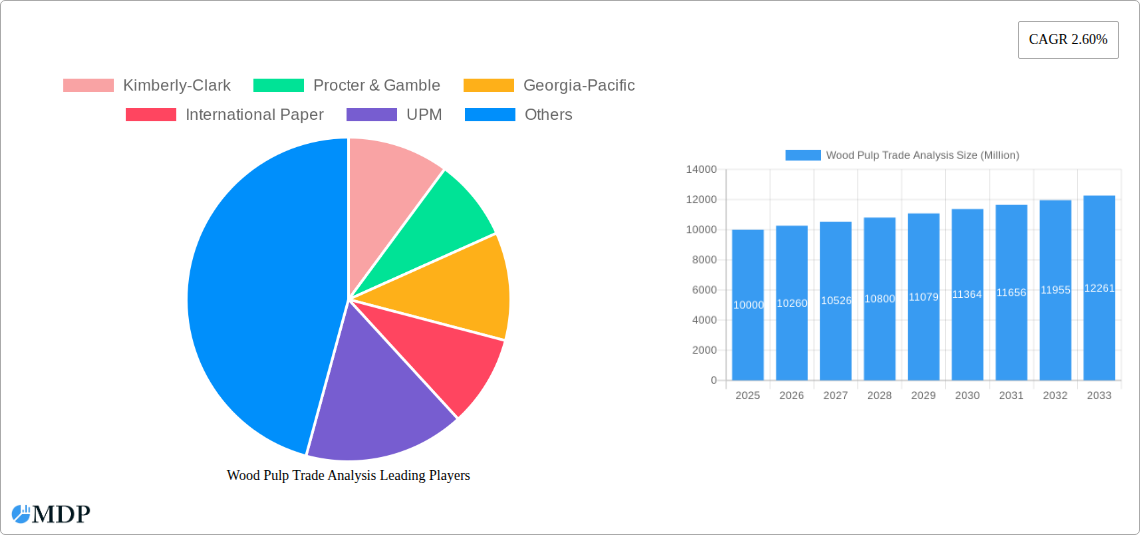
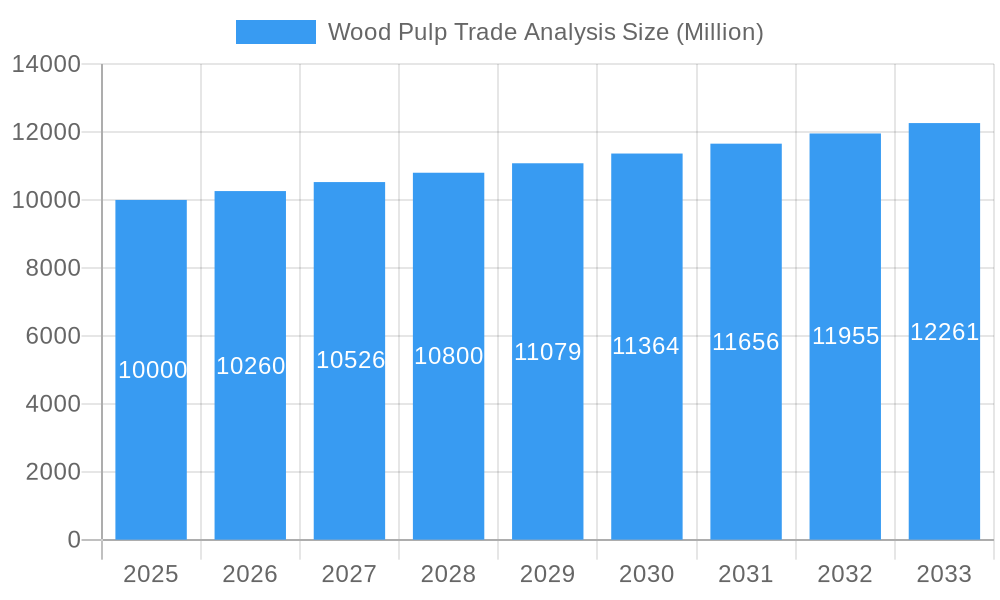
Wood Pulp Trade Analysis Market Size (In Billion)
The competitive environment comprises both global corporations and localized enterprises, with anticipated market consolidation through acquisitions aimed at expanding reach and product diversification. Regional growth trajectories will be influenced by economic development, government policies supporting sustainable forestry, and the embrace of innovative pulp production technologies. The forecast period indicates continued market growth, subject to global economic fluctuations and evolving consumer preferences for sustainable and recyclable products. A comprehensive understanding of these dynamics is imperative for industry participants to develop effective strategies for navigating this evolving market.
Wood Pulp Trade Analysis Company Market Share
Wood Pulp Trade Analysis: 2019-2033 Market Outlook & Forecast
Uncover lucrative opportunities and navigate challenges in the dynamic wood pulp market with this comprehensive report. This in-depth analysis provides a detailed examination of the wood pulp trade, offering invaluable insights for industry stakeholders, investors, and strategic decision-makers. Covering the period 2019-2033, with a focus on 2025, this report dissects market dynamics, leading players, and future trends to empower informed business strategies.
Wood Pulp Trade Analysis Market Dynamics & Concentration
The global wood pulp market, valued at xx Million in 2024, exhibits a moderate level of concentration with key players like Kimberly-Clark, Procter & Gamble, Georgia-Pacific, International Paper, and UPM holding significant market share. Market concentration is influenced by factors such as economies of scale, access to raw materials, and technological advancements. Innovation, particularly in sustainable pulp production and new product applications, is a major driver. Stringent environmental regulations, focused on reducing deforestation and pollution, are shaping industry practices. Product substitutes, such as recycled fibers and alternative packaging materials, pose a competitive threat, though their market penetration remains limited. Evolving end-user trends, particularly the growth of e-commerce and the packaging sector, are boosting demand for specific pulp types, like packaging paper. M&A activity, while not exceptionally frequent, plays a role in consolidating market share and enhancing technological capabilities. Over the historical period (2019-2024), the average annual M&A deal count was approximately xx, with a combined value of approximately xx Million. The forecast period (2025-2033) anticipates a similar deal flow, focusing on strategic acquisitions within the packaging segment.
- Market Share: Kimberly-Clark (xx%), Procter & Gamble (xx%), Georgia-Pacific (xx%), International Paper (xx%), UPM (xx%), Others (xx%).
- Innovation Drivers: Sustainable forestry practices, bio-based pulp innovations, advanced fiber processing techniques.
- Regulatory Frameworks: Emissions standards, forest management regulations, waste management policies.
- M&A Activity: Consolidation within the packaging segment, acquisitions of technology companies.
Wood Pulp Trade Analysis Industry Trends & Analysis
The wood pulp market is experiencing a period of transformation driven by several key factors. The Compound Annual Growth Rate (CAGR) from 2019 to 2024 was xx%, and a similar rate is projected for the forecast period (2025-2033). Technological advancements, such as improved pulping processes and automation, are enhancing efficiency and reducing production costs. Consumer preferences are shifting towards sustainable and eco-friendly products, driving demand for responsibly sourced wood pulp. The rising popularity of e-commerce and the consequent surge in demand for packaging materials are major growth catalysts. Intense competition among leading players, characterized by pricing pressures and innovation races, is shaping market dynamics. Market penetration of recycled pulp is gradually increasing, although natural wood pulp maintains its dominance. The shift in demand towards packaging paper, as highlighted by ICRA's April 2022 report, is a significant trend impacting the market. Digitization, however, negatively impacts demand for newsprint and printing-writing papers.
Leading Markets & Segments in Wood Pulp Trade Analysis
The packaging segment is the leading end-use industry for wood pulp, driven by the flourishing e-commerce sector and the increasing demand for food and FMCG packaging. Geographically, Asia-Pacific is the dominant region, particularly China, due to its large population and robust manufacturing base. Chemical pulp represents the largest product type segment, attributed to its versatility and suitability for a wide range of applications.
- Key Drivers for Packaging Segment Dominance:
- Growth of e-commerce and online retail.
- Expansion of the food and beverage industry.
- Increased demand for consumer goods.
- Key Drivers for Asia-Pacific Regional Dominance:
- Rapid economic growth and industrialization.
- Large population and expanding middle class.
- Government support for infrastructure development.
- Key Drivers for Chemical Pulp Dominance:
- Versatile properties suitable for diverse applications.
- Higher strength and quality compared to other pulp types.
- Established manufacturing infrastructure.
Wood Pulp Trade Analysis Product Developments
Recent product innovations focus on enhancing pulp properties for specific applications, such as improved strength, absorbency, and printability. There is a growing emphasis on developing sustainable and biodegradable wood pulp alternatives, driven by increasing environmental concerns. Technological advancements in pulping processes lead to higher yields and reduced environmental impact. These innovations enhance the competitive advantage of manufacturers by catering to the evolving demands of end-use industries.
Key Drivers of Wood Pulp Trade Analysis Growth
Several factors are driving the growth of the wood pulp trade. Firstly, the expanding global population and rising disposable incomes are fueling demand for paper and packaging products. Secondly, technological advancements in pulping and paper manufacturing are improving efficiency and reducing costs. Thirdly, governmental policies promoting sustainable forestry practices are creating a more stable and environmentally responsible supply chain. Lastly, the continuing growth of the packaging industry remains a key driver, especially within the expanding e-commerce and food processing sectors.
Challenges in the Wood Pulp Trade Analysis Market
The wood pulp market faces several challenges. Fluctuations in raw material prices and the availability of sustainable wood sources pose significant risks. Increasing environmental regulations and the need to adopt more sustainable practices add to production costs. Intense competition among established players and the emergence of new technologies also presents a considerable challenge. Supply chain disruptions, particularly those related to transportation and logistics, can severely impact market stability.
Emerging Opportunities in Wood Pulp Trade Analysis
The long-term outlook for the wood pulp market is positive. Advancements in bio-based pulp technologies offer significant opportunities for sustainable growth. Strategic partnerships between pulp producers and end-use industries can improve efficiency and create new applications. Expansion into developing economies with rising paper consumption offers considerable potential for market penetration. Research and development focused on value-added wood pulp products will create new avenues for revenue generation.
Leading Players in the Wood Pulp Trade Analysis Sector
- Kimberly-Clark
- Procter & Gamble
- Georgia-Pacific
- International Paper
- UPM
Key Milestones in Wood Pulp Trade Analysis Industry
- December 2022: IIT Roorkee and Shah Paper Mills Limited launch a project for advanced packaging research and skill development. This highlights the industry's focus on innovation and technological advancement.
- April 2022: ICRA reports a paradigm shift in Indian paper demand, with growth in packaging paper and decline in newsprint and printing-writing paper, reflecting the impact of digitization. This emphasizes the need for adaptation and diversification within the industry.
Strategic Outlook for Wood Pulp Trade Analysis Market
The future of the wood pulp market holds significant growth potential, driven by continued demand from packaging and hygiene applications. Strategic investments in sustainable forestry, technological innovation, and efficient supply chains will be crucial for success. Companies that successfully integrate sustainable practices and adapt to changing consumer preferences will be best positioned for long-term profitability. Expanding into new markets and developing value-added products will be key strategies for achieving growth.
Wood Pulp Trade Analysis Segmentation
- 1. Production Analysis
- 2. Consumption Analysis
- 3. Import Market Analysis (Value & Volume)
- 4. Export Market Analysis (Value & Volume)
- 5. Price Trend Analysis
Wood Pulp Trade Analysis Segmentation By Geography
-
1. North America
- 1.1. United States
- 1.2. Canada
- 1.3. Mexico
-
2. Europe
- 2.1. Germany
- 2.2. United Kingdom
- 2.3. Italy
- 2.4. France
- 2.5. Netherlands
- 2.6. Sweden
- 2.7. Russia
-
3. Asia Pacific
- 3.1. China
- 3.2. Australia
- 3.3. India
- 3.4. South Korea
- 3.5. Japan
- 3.6. Indonesia
-
4. South America
- 4.1. Brazil
- 4.2. Chile
-
5. Africa
- 5.1. South Africa
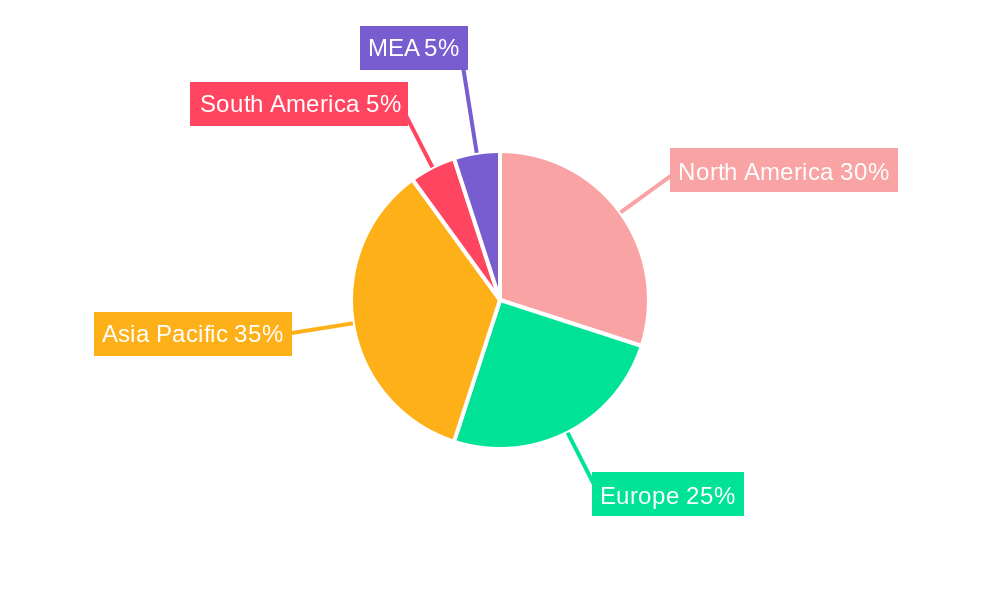
Wood Pulp Trade Analysis Regional Market Share
Geographic Coverage of Wood Pulp Trade Analysis
Wood Pulp Trade Analysis REPORT HIGHLIGHTS
| Aspects | Details |
|---|---|
| Study Period | 2020-2034 |
| Base Year | 2025 |
| Estimated Year | 2026 |
| Forecast Period | 2026-2034 |
| Historical Period | 2020-2025 |
| Growth Rate | CAGR of 2.7% from 2020-2034 |
| Segmentation |
|
Table of Contents
- 1. Introduction
- 1.1. Research Scope
- 1.2. Market Segmentation
- 1.3. Research Objective
- 1.4. Definitions and Assumptions
- 2. Executive Summary
- 2.1. Market Snapshot
- 3. Market Dynamics
- 3.1. Market Drivers
- 3.2. Market Restrains
- 3.3. Market Trends
- 3.4. Market Opportunities
- 4. Market Factor Analysis
- 4.1. Porters Five Forces
- 4.1.1. Bargaining Power of Suppliers
- 4.1.2. Bargaining Power of Buyers
- 4.1.3. Threat of New Entrants
- 4.1.4. Threat of Substitutes
- 4.1.5. Competitive Rivalry
- 4.2. PESTEL analysis
- 4.3. BCG Analysis
- 4.3.1. Stars (High Growth, High Market Share)
- 4.3.2. Cash Cows (Low Growth, High Market Share)
- 4.3.3. Question Mark (High Growth, Low Market Share)
- 4.3.4. Dogs (Low Growth, Low Market Share)
- 4.4. Ansoff Matrix Analysis
- 4.5. Supply Chain Analysis
- 4.6. Regulatory Landscape
- 4.7. Current Market Potential and Opportunity Assessment (TAM–SAM–SOM Framework)
- 4.8. MDP Analyst Note
- 4.1. Porters Five Forces
- 5. Market Analysis, Insights and Forecast 2021-2033
- 5.1. Market Analysis, Insights and Forecast - by Production Analysis
- 5.2. Market Analysis, Insights and Forecast - by Consumption Analysis
- 5.3. Market Analysis, Insights and Forecast - by Import Market Analysis (Value & Volume)
- 5.4. Market Analysis, Insights and Forecast - by Export Market Analysis (Value & Volume)
- 5.5. Market Analysis, Insights and Forecast - by Price Trend Analysis
- 5.6. Market Analysis, Insights and Forecast - by Region
- 5.6.1. North America
- 5.6.2. Europe
- 5.6.3. Asia Pacific
- 5.6.4. South America
- 5.6.5. Africa
- 6. Global Wood Pulp Trade Analysis Analysis, Insights and Forecast, 2021-2033
- 6.1. Market Analysis, Insights and Forecast - by Production Analysis
- 6.2. Market Analysis, Insights and Forecast - by Consumption Analysis
- 6.3. Market Analysis, Insights and Forecast - by Import Market Analysis (Value & Volume)
- 6.4. Market Analysis, Insights and Forecast - by Export Market Analysis (Value & Volume)
- 6.5. Market Analysis, Insights and Forecast - by Price Trend Analysis
- 7. North America Wood Pulp Trade Analysis Analysis, Insights and Forecast, 2020-2032
- 7.1. Market Analysis, Insights and Forecast - by Production Analysis
- 7.2. Market Analysis, Insights and Forecast - by Consumption Analysis
- 7.3. Market Analysis, Insights and Forecast - by Import Market Analysis (Value & Volume)
- 7.4. Market Analysis, Insights and Forecast - by Export Market Analysis (Value & Volume)
- 7.5. Market Analysis, Insights and Forecast - by Price Trend Analysis
- 8. Europe Wood Pulp Trade Analysis Analysis, Insights and Forecast, 2020-2032
- 8.1. Market Analysis, Insights and Forecast - by Production Analysis
- 8.2. Market Analysis, Insights and Forecast - by Consumption Analysis
- 8.3. Market Analysis, Insights and Forecast - by Import Market Analysis (Value & Volume)
- 8.4. Market Analysis, Insights and Forecast - by Export Market Analysis (Value & Volume)
- 8.5. Market Analysis, Insights and Forecast - by Price Trend Analysis
- 9. Asia Pacific Wood Pulp Trade Analysis Analysis, Insights and Forecast, 2020-2032
- 9.1. Market Analysis, Insights and Forecast - by Production Analysis
- 9.2. Market Analysis, Insights and Forecast - by Consumption Analysis
- 9.3. Market Analysis, Insights and Forecast - by Import Market Analysis (Value & Volume)
- 9.4. Market Analysis, Insights and Forecast - by Export Market Analysis (Value & Volume)
- 9.5. Market Analysis, Insights and Forecast - by Price Trend Analysis
- 10. South America Wood Pulp Trade Analysis Analysis, Insights and Forecast, 2020-2032
- 10.1. Market Analysis, Insights and Forecast - by Production Analysis
- 10.2. Market Analysis, Insights and Forecast - by Consumption Analysis
- 10.3. Market Analysis, Insights and Forecast - by Import Market Analysis (Value & Volume)
- 10.4. Market Analysis, Insights and Forecast - by Export Market Analysis (Value & Volume)
- 10.5. Market Analysis, Insights and Forecast - by Price Trend Analysis
- 11. Africa Wood Pulp Trade Analysis Analysis, Insights and Forecast, 2020-2032
- 11.1. Market Analysis, Insights and Forecast - by Production Analysis
- 11.2. Market Analysis, Insights and Forecast - by Consumption Analysis
- 11.3. Market Analysis, Insights and Forecast - by Import Market Analysis (Value & Volume)
- 11.4. Market Analysis, Insights and Forecast - by Export Market Analysis (Value & Volume)
- 11.5. Market Analysis, Insights and Forecast - by Price Trend Analysis
- 12. Competitive Analysis
- 12.1. Company Profiles
- 12.1.1 Kimberly-Clark
- 12.1.1.1. Company Overview
- 12.1.1.2. Products
- 12.1.1.3. Company Financials
- 12.1.1.4. SWOT Analysis
- 12.1.2 Procter & Gamble
- 12.1.2.1. Company Overview
- 12.1.2.2. Products
- 12.1.2.3. Company Financials
- 12.1.2.4. SWOT Analysis
- 12.1.3 Georgia-Pacific
- 12.1.3.1. Company Overview
- 12.1.3.2. Products
- 12.1.3.3. Company Financials
- 12.1.3.4. SWOT Analysis
- 12.1.4 International Paper
- 12.1.4.1. Company Overview
- 12.1.4.2. Products
- 12.1.4.3. Company Financials
- 12.1.4.4. SWOT Analysis
- 12.1.5 UPM
- 12.1.5.1. Company Overview
- 12.1.5.2. Products
- 12.1.5.3. Company Financials
- 12.1.5.4. SWOT Analysis
- 12.1.1 Kimberly-Clark
- 12.2. Market Entropy
- 12.2.1 Company's Key Areas Served
- 12.2.2 Recent Developments
- 12.3. Company Market Share Analysis 2025
- 12.3.1 Top 5 Companies Market Share Analysis
- 12.3.2 Top 3 Companies Market Share Analysis
- 12.4. List of Potential Customers
- 13. Research Methodology
List of Figures
- Figure 1: Global Wood Pulp Trade Analysis Revenue Breakdown (billion, %) by Region 2025 & 2033
- Figure 2: North America Wood Pulp Trade Analysis Revenue (billion), by Production Analysis 2025 & 2033
- Figure 3: North America Wood Pulp Trade Analysis Revenue Share (%), by Production Analysis 2025 & 2033
- Figure 4: North America Wood Pulp Trade Analysis Revenue (billion), by Consumption Analysis 2025 & 2033
- Figure 5: North America Wood Pulp Trade Analysis Revenue Share (%), by Consumption Analysis 2025 & 2033
- Figure 6: North America Wood Pulp Trade Analysis Revenue (billion), by Import Market Analysis (Value & Volume) 2025 & 2033
- Figure 7: North America Wood Pulp Trade Analysis Revenue Share (%), by Import Market Analysis (Value & Volume) 2025 & 2033
- Figure 8: North America Wood Pulp Trade Analysis Revenue (billion), by Export Market Analysis (Value & Volume) 2025 & 2033
- Figure 9: North America Wood Pulp Trade Analysis Revenue Share (%), by Export Market Analysis (Value & Volume) 2025 & 2033
- Figure 10: North America Wood Pulp Trade Analysis Revenue (billion), by Price Trend Analysis 2025 & 2033
- Figure 11: North America Wood Pulp Trade Analysis Revenue Share (%), by Price Trend Analysis 2025 & 2033
- Figure 12: North America Wood Pulp Trade Analysis Revenue (billion), by Country 2025 & 2033
- Figure 13: North America Wood Pulp Trade Analysis Revenue Share (%), by Country 2025 & 2033
- Figure 14: Europe Wood Pulp Trade Analysis Revenue (billion), by Production Analysis 2025 & 2033
- Figure 15: Europe Wood Pulp Trade Analysis Revenue Share (%), by Production Analysis 2025 & 2033
- Figure 16: Europe Wood Pulp Trade Analysis Revenue (billion), by Consumption Analysis 2025 & 2033
- Figure 17: Europe Wood Pulp Trade Analysis Revenue Share (%), by Consumption Analysis 2025 & 2033
- Figure 18: Europe Wood Pulp Trade Analysis Revenue (billion), by Import Market Analysis (Value & Volume) 2025 & 2033
- Figure 19: Europe Wood Pulp Trade Analysis Revenue Share (%), by Import Market Analysis (Value & Volume) 2025 & 2033
- Figure 20: Europe Wood Pulp Trade Analysis Revenue (billion), by Export Market Analysis (Value & Volume) 2025 & 2033
- Figure 21: Europe Wood Pulp Trade Analysis Revenue Share (%), by Export Market Analysis (Value & Volume) 2025 & 2033
- Figure 22: Europe Wood Pulp Trade Analysis Revenue (billion), by Price Trend Analysis 2025 & 2033
- Figure 23: Europe Wood Pulp Trade Analysis Revenue Share (%), by Price Trend Analysis 2025 & 2033
- Figure 24: Europe Wood Pulp Trade Analysis Revenue (billion), by Country 2025 & 2033
- Figure 25: Europe Wood Pulp Trade Analysis Revenue Share (%), by Country 2025 & 2033
- Figure 26: Asia Pacific Wood Pulp Trade Analysis Revenue (billion), by Production Analysis 2025 & 2033
- Figure 27: Asia Pacific Wood Pulp Trade Analysis Revenue Share (%), by Production Analysis 2025 & 2033
- Figure 28: Asia Pacific Wood Pulp Trade Analysis Revenue (billion), by Consumption Analysis 2025 & 2033
- Figure 29: Asia Pacific Wood Pulp Trade Analysis Revenue Share (%), by Consumption Analysis 2025 & 2033
- Figure 30: Asia Pacific Wood Pulp Trade Analysis Revenue (billion), by Import Market Analysis (Value & Volume) 2025 & 2033
- Figure 31: Asia Pacific Wood Pulp Trade Analysis Revenue Share (%), by Import Market Analysis (Value & Volume) 2025 & 2033
- Figure 32: Asia Pacific Wood Pulp Trade Analysis Revenue (billion), by Export Market Analysis (Value & Volume) 2025 & 2033
- Figure 33: Asia Pacific Wood Pulp Trade Analysis Revenue Share (%), by Export Market Analysis (Value & Volume) 2025 & 2033
- Figure 34: Asia Pacific Wood Pulp Trade Analysis Revenue (billion), by Price Trend Analysis 2025 & 2033
- Figure 35: Asia Pacific Wood Pulp Trade Analysis Revenue Share (%), by Price Trend Analysis 2025 & 2033
- Figure 36: Asia Pacific Wood Pulp Trade Analysis Revenue (billion), by Country 2025 & 2033
- Figure 37: Asia Pacific Wood Pulp Trade Analysis Revenue Share (%), by Country 2025 & 2033
- Figure 38: South America Wood Pulp Trade Analysis Revenue (billion), by Production Analysis 2025 & 2033
- Figure 39: South America Wood Pulp Trade Analysis Revenue Share (%), by Production Analysis 2025 & 2033
- Figure 40: South America Wood Pulp Trade Analysis Revenue (billion), by Consumption Analysis 2025 & 2033
- Figure 41: South America Wood Pulp Trade Analysis Revenue Share (%), by Consumption Analysis 2025 & 2033
- Figure 42: South America Wood Pulp Trade Analysis Revenue (billion), by Import Market Analysis (Value & Volume) 2025 & 2033
- Figure 43: South America Wood Pulp Trade Analysis Revenue Share (%), by Import Market Analysis (Value & Volume) 2025 & 2033
- Figure 44: South America Wood Pulp Trade Analysis Revenue (billion), by Export Market Analysis (Value & Volume) 2025 & 2033
- Figure 45: South America Wood Pulp Trade Analysis Revenue Share (%), by Export Market Analysis (Value & Volume) 2025 & 2033
- Figure 46: South America Wood Pulp Trade Analysis Revenue (billion), by Price Trend Analysis 2025 & 2033
- Figure 47: South America Wood Pulp Trade Analysis Revenue Share (%), by Price Trend Analysis 2025 & 2033
- Figure 48: South America Wood Pulp Trade Analysis Revenue (billion), by Country 2025 & 2033
- Figure 49: South America Wood Pulp Trade Analysis Revenue Share (%), by Country 2025 & 2033
- Figure 50: Africa Wood Pulp Trade Analysis Revenue (billion), by Production Analysis 2025 & 2033
- Figure 51: Africa Wood Pulp Trade Analysis Revenue Share (%), by Production Analysis 2025 & 2033
- Figure 52: Africa Wood Pulp Trade Analysis Revenue (billion), by Consumption Analysis 2025 & 2033
- Figure 53: Africa Wood Pulp Trade Analysis Revenue Share (%), by Consumption Analysis 2025 & 2033
- Figure 54: Africa Wood Pulp Trade Analysis Revenue (billion), by Import Market Analysis (Value & Volume) 2025 & 2033
- Figure 55: Africa Wood Pulp Trade Analysis Revenue Share (%), by Import Market Analysis (Value & Volume) 2025 & 2033
- Figure 56: Africa Wood Pulp Trade Analysis Revenue (billion), by Export Market Analysis (Value & Volume) 2025 & 2033
- Figure 57: Africa Wood Pulp Trade Analysis Revenue Share (%), by Export Market Analysis (Value & Volume) 2025 & 2033
- Figure 58: Africa Wood Pulp Trade Analysis Revenue (billion), by Price Trend Analysis 2025 & 2033
- Figure 59: Africa Wood Pulp Trade Analysis Revenue Share (%), by Price Trend Analysis 2025 & 2033
- Figure 60: Africa Wood Pulp Trade Analysis Revenue (billion), by Country 2025 & 2033
- Figure 61: Africa Wood Pulp Trade Analysis Revenue Share (%), by Country 2025 & 2033
List of Tables
- Table 1: Global Wood Pulp Trade Analysis Revenue billion Forecast, by Production Analysis 2020 & 2033
- Table 2: Global Wood Pulp Trade Analysis Revenue billion Forecast, by Consumption Analysis 2020 & 2033
- Table 3: Global Wood Pulp Trade Analysis Revenue billion Forecast, by Import Market Analysis (Value & Volume) 2020 & 2033
- Table 4: Global Wood Pulp Trade Analysis Revenue billion Forecast, by Export Market Analysis (Value & Volume) 2020 & 2033
- Table 5: Global Wood Pulp Trade Analysis Revenue billion Forecast, by Price Trend Analysis 2020 & 2033
- Table 6: Global Wood Pulp Trade Analysis Revenue billion Forecast, by Region 2020 & 2033
- Table 7: Global Wood Pulp Trade Analysis Revenue billion Forecast, by Production Analysis 2020 & 2033
- Table 8: Global Wood Pulp Trade Analysis Revenue billion Forecast, by Consumption Analysis 2020 & 2033
- Table 9: Global Wood Pulp Trade Analysis Revenue billion Forecast, by Import Market Analysis (Value & Volume) 2020 & 2033
- Table 10: Global Wood Pulp Trade Analysis Revenue billion Forecast, by Export Market Analysis (Value & Volume) 2020 & 2033
- Table 11: Global Wood Pulp Trade Analysis Revenue billion Forecast, by Price Trend Analysis 2020 & 2033
- Table 12: Global Wood Pulp Trade Analysis Revenue billion Forecast, by Country 2020 & 2033
- Table 13: United States Wood Pulp Trade Analysis Revenue (billion) Forecast, by Application 2020 & 2033
- Table 14: Canada Wood Pulp Trade Analysis Revenue (billion) Forecast, by Application 2020 & 2033
- Table 15: Mexico Wood Pulp Trade Analysis Revenue (billion) Forecast, by Application 2020 & 2033
- Table 16: Global Wood Pulp Trade Analysis Revenue billion Forecast, by Production Analysis 2020 & 2033
- Table 17: Global Wood Pulp Trade Analysis Revenue billion Forecast, by Consumption Analysis 2020 & 2033
- Table 18: Global Wood Pulp Trade Analysis Revenue billion Forecast, by Import Market Analysis (Value & Volume) 2020 & 2033
- Table 19: Global Wood Pulp Trade Analysis Revenue billion Forecast, by Export Market Analysis (Value & Volume) 2020 & 2033
- Table 20: Global Wood Pulp Trade Analysis Revenue billion Forecast, by Price Trend Analysis 2020 & 2033
- Table 21: Global Wood Pulp Trade Analysis Revenue billion Forecast, by Country 2020 & 2033
- Table 22: Germany Wood Pulp Trade Analysis Revenue (billion) Forecast, by Application 2020 & 2033
- Table 23: United Kingdom Wood Pulp Trade Analysis Revenue (billion) Forecast, by Application 2020 & 2033
- Table 24: Italy Wood Pulp Trade Analysis Revenue (billion) Forecast, by Application 2020 & 2033
- Table 25: France Wood Pulp Trade Analysis Revenue (billion) Forecast, by Application 2020 & 2033
- Table 26: Netherlands Wood Pulp Trade Analysis Revenue (billion) Forecast, by Application 2020 & 2033
- Table 27: Sweden Wood Pulp Trade Analysis Revenue (billion) Forecast, by Application 2020 & 2033
- Table 28: Russia Wood Pulp Trade Analysis Revenue (billion) Forecast, by Application 2020 & 2033
- Table 29: Global Wood Pulp Trade Analysis Revenue billion Forecast, by Production Analysis 2020 & 2033
- Table 30: Global Wood Pulp Trade Analysis Revenue billion Forecast, by Consumption Analysis 2020 & 2033
- Table 31: Global Wood Pulp Trade Analysis Revenue billion Forecast, by Import Market Analysis (Value & Volume) 2020 & 2033
- Table 32: Global Wood Pulp Trade Analysis Revenue billion Forecast, by Export Market Analysis (Value & Volume) 2020 & 2033
- Table 33: Global Wood Pulp Trade Analysis Revenue billion Forecast, by Price Trend Analysis 2020 & 2033
- Table 34: Global Wood Pulp Trade Analysis Revenue billion Forecast, by Country 2020 & 2033
- Table 35: China Wood Pulp Trade Analysis Revenue (billion) Forecast, by Application 2020 & 2033
- Table 36: Australia Wood Pulp Trade Analysis Revenue (billion) Forecast, by Application 2020 & 2033
- Table 37: India Wood Pulp Trade Analysis Revenue (billion) Forecast, by Application 2020 & 2033
- Table 38: South Korea Wood Pulp Trade Analysis Revenue (billion) Forecast, by Application 2020 & 2033
- Table 39: Japan Wood Pulp Trade Analysis Revenue (billion) Forecast, by Application 2020 & 2033
- Table 40: Indonesia Wood Pulp Trade Analysis Revenue (billion) Forecast, by Application 2020 & 2033
- Table 41: Global Wood Pulp Trade Analysis Revenue billion Forecast, by Production Analysis 2020 & 2033
- Table 42: Global Wood Pulp Trade Analysis Revenue billion Forecast, by Consumption Analysis 2020 & 2033
- Table 43: Global Wood Pulp Trade Analysis Revenue billion Forecast, by Import Market Analysis (Value & Volume) 2020 & 2033
- Table 44: Global Wood Pulp Trade Analysis Revenue billion Forecast, by Export Market Analysis (Value & Volume) 2020 & 2033
- Table 45: Global Wood Pulp Trade Analysis Revenue billion Forecast, by Price Trend Analysis 2020 & 2033
- Table 46: Global Wood Pulp Trade Analysis Revenue billion Forecast, by Country 2020 & 2033
- Table 47: Brazil Wood Pulp Trade Analysis Revenue (billion) Forecast, by Application 2020 & 2033
- Table 48: Chile Wood Pulp Trade Analysis Revenue (billion) Forecast, by Application 2020 & 2033
- Table 49: Global Wood Pulp Trade Analysis Revenue billion Forecast, by Production Analysis 2020 & 2033
- Table 50: Global Wood Pulp Trade Analysis Revenue billion Forecast, by Consumption Analysis 2020 & 2033
- Table 51: Global Wood Pulp Trade Analysis Revenue billion Forecast, by Import Market Analysis (Value & Volume) 2020 & 2033
- Table 52: Global Wood Pulp Trade Analysis Revenue billion Forecast, by Export Market Analysis (Value & Volume) 2020 & 2033
- Table 53: Global Wood Pulp Trade Analysis Revenue billion Forecast, by Price Trend Analysis 2020 & 2033
- Table 54: Global Wood Pulp Trade Analysis Revenue billion Forecast, by Country 2020 & 2033
- Table 55: South Africa Wood Pulp Trade Analysis Revenue (billion) Forecast, by Application 2020 & 2033
Frequently Asked Questions
1. What is the projected Compound Annual Growth Rate (CAGR) of the Wood Pulp Trade Analysis?
The projected CAGR is approximately 2.7%.
2. Which companies are prominent players in the Wood Pulp Trade Analysis?
Key companies in the market include Kimberly-Clark , Procter & Gamble , Georgia-Pacific, International Paper , UPM .
3. What are the main segments of the Wood Pulp Trade Analysis?
The market segments include Production Analysis, Consumption Analysis, Import Market Analysis (Value & Volume), Export Market Analysis (Value & Volume), Price Trend Analysis.
4. Can you provide details about the market size?
The market size is estimated to be USD 166.65 billion as of 2022.
5. What are some drivers contributing to market growth?
; Increasing Food Security Concerns; Inclination Toward a Healthy Lifestyle.
6. What are the notable trends driving market growth?
Huge Demand in Packaging and Industrial Papers.
7. Are there any restraints impacting market growth?
; Unfavorable Climatic Conditions; Higher Market Entry Cost.
8. Can you provide examples of recent developments in the market?
December 2022: The Indian Institute of Technology (IIT) Roorkee, in association with Shah Paper Mills Limited, launched a new project to develop the advanced packaging research laboratory and skill development program at the Department of Paper Technology, Saharanpur Campus. The institute has been fostering collaboration with paper industries from India, focusing on providing cutting-edge innovation research and skill development globally.
9. What pricing options are available for accessing the report?
Pricing options include single-user, multi-user, and enterprise licenses priced at USD 4750, USD 5250, and USD 8750 respectively.
10. Is the market size provided in terms of value or volume?
The market size is provided in terms of value, measured in billion.
11. Are there any specific market keywords associated with the report?
Yes, the market keyword associated with the report is "Wood Pulp Trade Analysis," which aids in identifying and referencing the specific market segment covered.
12. How do I determine which pricing option suits my needs best?
The pricing options vary based on user requirements and access needs. Individual users may opt for single-user licenses, while businesses requiring broader access may choose multi-user or enterprise licenses for cost-effective access to the report.
13. Are there any additional resources or data provided in the Wood Pulp Trade Analysis report?
While the report offers comprehensive insights, it's advisable to review the specific contents or supplementary materials provided to ascertain if additional resources or data are available.
14. How can I stay updated on further developments or reports in the Wood Pulp Trade Analysis?
To stay informed about further developments, trends, and reports in the Wood Pulp Trade Analysis, consider subscribing to industry newsletters, following relevant companies and organizations, or regularly checking reputable industry news sources and publications.
Methodology
Step 1 - Identification of Relevant Samples Size from Population Database


Step 2 - Approaches for Defining Global Market Size (Value, Volume* & Price*)

Note*: In applicable scenarios
Step 3 - Data Sources
Primary Research
- Web Analytics
- Survey Reports
- Research Institute
- Latest Research Reports
- Opinion Leaders
Secondary Research
- Annual Reports
- White Paper
- Latest Press Release
- Industry Association
- Paid Database
- Investor Presentations

Step 4 - Data Triangulation
Involves using different sources of information in order to increase the validity of a study
These sources are likely to be stakeholders in a program - participants, other researchers, program staff, other community members, and so on.
Then we put all data in single framework & apply various statistical tools to find out the dynamic on the market.
During the analysis stage, feedback from the stakeholder groups would be compared to determine areas of agreement as well as areas of divergence