

Key Insights
The global Crop Protection Industry is projected for robust expansion, driven by an escalating demand for enhanced agricultural productivity to feed a growing world population and the need to mitigate crop losses from pests and diseases. With an estimated market size of approximately USD 90,000 million in 2025, the industry is anticipated to witness a Compound Annual Growth Rate (CAGR) of 5.60% throughout the forecast period of 2025-2033. This growth trajectory is significantly influenced by increasing adoption of advanced agrochemical solutions, including fungicides, herbicides, and insecticides, to combat evolving pest resistance and plant pathogens. Furthermore, the surge in demand for fruits and vegetables, grains, and cereals, coupled with the commercial cultivation of crops like pulses and oilseeds, underscores the critical role of crop protection in ensuring food security and economic stability for agricultural economies. The trend towards precision agriculture and the development of integrated pest management (IPM) strategies are also contributing to market dynamics, as farmers seek efficient and sustainable solutions.
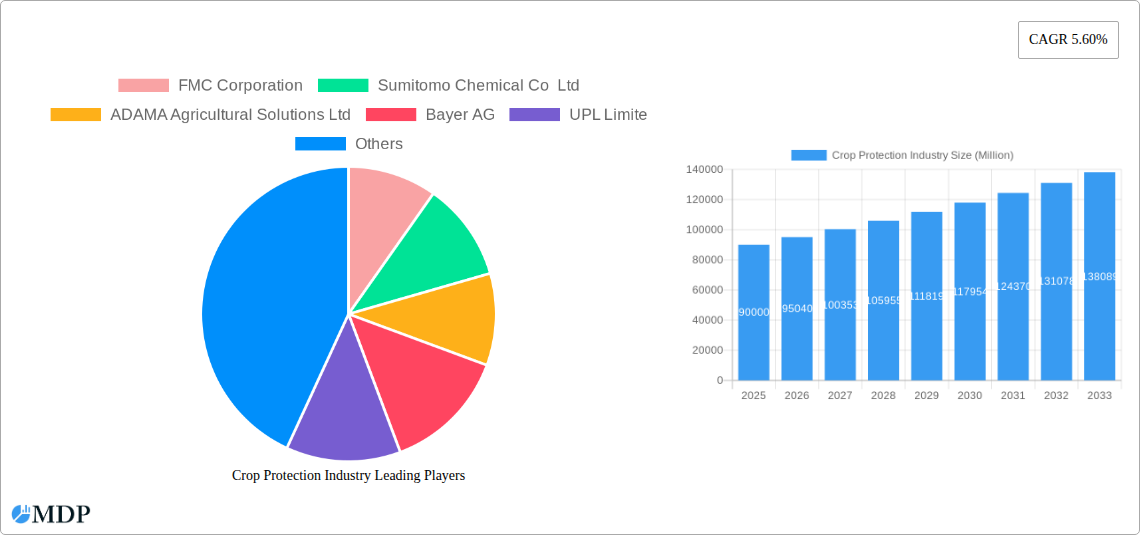
Crop Protection Industry Market Size (In Billion)
Key drivers for this growth include government initiatives promoting sustainable agriculture, rising disposable incomes leading to increased consumption of diverse food products, and ongoing research and development in novel, environmentally conscious crop protection chemicals. However, stringent regulatory frameworks surrounding pesticide usage, the development of pest resistance, and concerns over environmental impact pose significant restraints. The market segments are well-defined, with Fungicides, Herbicides, and Insecticides forming the dominant functional categories. Application modes like Foliar application and Seed Treatment are widely adopted, while Chemigation and Fumigation are gaining traction in specific regions and crop types. Geographically, Asia Pacific, particularly China and India, is expected to be a major growth engine due to its vast agricultural landscape and increasing adoption of modern farming techniques. North America and Europe, while mature markets, continue to drive innovation and demand for high-value crop protection products. Leading companies such as Bayer AG, Syngenta Group, BASF SE, and Corteva Agriscience are at the forefront, investing heavily in R&D to develop next-generation crop protection solutions.

Crop Protection Industry Company Market Share
This in-depth report provides a definitive analysis of the global Crop Protection Industry, offering unparalleled insights into market dynamics, emerging trends, and strategic opportunities. Spanning the comprehensive Study Period of 2019–2033, with a Base Year and Estimated Year of 2025, this report delves into the Historical Period of 2019–2024 and forecasts growth through the Forecast Period of 2025–2033. We dissect the intricate landscape of crop protection solutions, encompassing Fungicides, Herbicides, Insecticides, Molluscicides, and Nematicides, applied through modes like Chemigation, Foliar, Fumigation, Seed Treatment, and Soil Treatment. Our analysis covers a diverse range of Commercial Crops, Fruits & Vegetables, Grains & Cereals, Pulses & Oilseeds, and Turf & Ornamental segments, making it an essential resource for all industry stakeholders.
Crop Protection Industry Market Dynamics & Concentration
The Crop Protection Industry is characterized by a dynamic and moderately concentrated market, driven by a confluence of innovation, stringent regulatory frameworks, and evolving end-user demands. Key innovation drivers include the relentless pursuit of more effective and environmentally sustainable crop protection solutions, alongside the development of novel active ingredients and formulations to combat resistance. Regulatory bodies globally play a pivotal role, shaping product development and market access through rigorous approval processes and adherence to safety standards, impacting the market by an estimated $50 Million in compliance costs annually. The threat of product substitutes, such as biopesticides and integrated pest management (IPM) strategies, is increasing, pushing conventional chemical manufacturers to innovate and integrate sustainable practices. End-user trends are increasingly leaning towards precision agriculture and demand for residue-free produce, influencing product portfolios. Mergers & Acquisitions (M&A) activities remain a significant factor in market concentration. Between 2019 and 2024, there were approximately 30 significant M&A deals, valued at over $15 Billion collectively, consolidating market share among key players. For instance, the acquisition of a 15% market share in the herbicide segment by a leading player in 2022 significantly reshaped competitive dynamics. The top 10 companies collectively hold an estimated 70% of the global market share.
Crop Protection Industry Industry Trends & Analysis
The Crop Protection Industry is poised for robust growth, driven by an ever-increasing global population necessitating enhanced food security and improved agricultural yields. The market is projected to witness a Compound Annual Growth Rate (CAGR) of approximately 5.5% from 2025 to 2033. Technological disruptions are at the forefront, with the advent of precision agriculture, drones for targeted application, and advanced data analytics revolutionizing how crop protection products are utilized. These innovations contribute to reduced environmental impact and optimized resource allocation, with a market penetration of nearly 20% in advanced economies for precision application technologies. Consumer preferences are increasingly prioritizing food safety and sustainability, leading to a demand for residue-limited products and integrated pest management (IPM) solutions. This shift is compelling manufacturers to invest in research and development of biopesticides and reduced-risk chemistries. Competitive dynamics are intensifying, with established multinational corporations investing heavily in R&D and smaller, specialized companies focusing on niche markets and innovative formulations. The overall market size is estimated to reach $90 Billion by 2025, with a projected growth to $130 Billion by 2033. The increasing adoption of genetically modified crops with inherent pest resistance also influences the demand for certain chemical protectants, although their primary role remains crucial for broad-spectrum control and resistance management. The rise of digital farming platforms further integrates crop protection strategies into holistic farm management systems, providing farmers with data-driven recommendations and improved decision-making capabilities, with an estimated economic benefit of $5 Billion annually in reduced crop losses.
Leading Markets & Segments in Crop Protection Industry
The Herbicide segment currently dominates the global Crop Protection Industry, holding an estimated market share of 40%, largely driven by its critical role in weed management for major Grains & Cereals and Commercial Crops. The Foliar application mode is the most prevalent, accounting for approximately 55% of all applications due to its direct and rapid efficacy. Geographically, Asia Pacific stands out as the leading market, propelled by its vast agricultural landmass, significant population requiring food security, and increasing adoption of modern farming practices. Countries like China and India are major contributors, with their economies heavily reliant on agriculture. Economic policies supporting agricultural modernization, such as subsidies for crop protection inputs and investments in research and development, further bolster this dominance. Infrastructure development, including improved logistics for product distribution, also plays a crucial role in market accessibility.
Within the segments:
- Function:
- Herbicides: Dominant due to widespread need for weed control in staple crops. Economic policies encouraging large-scale grain production contribute to this.
- Insecticides: Crucial for protecting a wide array of crops, especially in regions prone to pest outbreaks. Government initiatives for pest surveillance and control are key drivers.
- Fungicides: Essential for disease management, particularly in fruits, vegetables, and cereals, impacting crop quality and yield significantly. Climate change impacts are increasing the demand for effective fungicides.
- Application Mode:
- Foliar: Universally applied for direct pest and disease control on leaves and stems. Its ease of use and broad applicability make it a consistent leader.
- Seed Treatment: Gaining traction for its efficiency in early-stage crop protection and reduced environmental dispersion, with an estimated market penetration of 30% in developed nations.
- Soil Treatment: Critical for controlling soil-borne pests and diseases, especially in high-value crops.
- Crop Type:
- Grains & Cereals: Represent the largest market segment due to their global cultivation scale and the inherent need for weed and pest management for food security. Government support for food production is a major factor.
- Commercial Crops: Includes crops like cotton, sugarcane, and soybeans, which often require intensive crop protection measures, contributing significantly to market value.
- Fruits & Vegetables: While smaller in acreage, these segments command higher value per unit and require specialized protection, driving demand for advanced formulations.
Crop Protection Industry Product Developments
Recent product developments in the Crop Protection Industry are characterized by a strong emphasis on enhanced efficacy, reduced environmental impact, and integrated solutions. Companies are launching advanced formulations that offer broader spectrum control, longer residual activity, and improved resistance management properties. For example, new active ingredients are being developed with novel modes of action to combat evolving pest and disease resistance. The integration of digital technologies with crop protection products is also a significant trend, enabling precision application and real-time monitoring. This leads to more targeted interventions, reducing chemical usage and improving overall sustainability. The market fit for these innovations is driven by increasing regulatory pressures and farmer demand for cost-effective, high-performance solutions that also align with environmental stewardship goals.
Key Drivers of Crop Protection Industry Growth
The Crop Protection Industry's growth is propelled by several interconnected factors. Firstly, the escalating global population and the subsequent demand for increased food production are primary drivers, necessitating enhanced crop yields and reduced post-harvest losses. Secondly, technological advancements, including the development of more potent and environmentally benign active ingredients, precision application technologies like drones and smart sprayers, and the integration of digital farming platforms, are enabling more efficient and sustainable crop protection strategies. This contributes an estimated $10 Billion in increased crop yields annually. Thirdly, evolving regulatory landscapes, while sometimes posing challenges, also incentivize the development of safer and more targeted solutions, creating market opportunities. Finally, the increasing incidence of pest and disease resistance to older chemistries necessitates continuous innovation and the adoption of newer, more effective products, driving market expansion.
Challenges in the Crop Protection Industry Market
Despite significant growth prospects, the Crop Protection Industry faces several formidable challenges. Stringent and evolving regulatory frameworks across different regions create lengthy and costly approval processes for new products, with an estimated $2 Billion annual investment in regulatory compliance. The development of pest and disease resistance to existing chemical agents necessitates constant R&D investment and the introduction of novel solutions, leading to increased operational costs. Supply chain disruptions, exacerbated by geopolitical events and logistical complexities, can impact the availability and pricing of raw materials and finished products. Furthermore, increasing public scrutiny regarding the environmental and health impacts of agrochemicals, coupled with the rise of organic farming and biopesticide alternatives, exerts competitive pressure and influences market perception, potentially reducing market share by 5% in specific segments due to the adoption of sustainable alternatives.
Emerging Opportunities in Crop Protection Industry
The Crop Protection Industry is ripe with emerging opportunities, primarily fueled by technological breakthroughs and strategic market expansion. The development and widespread adoption of biological crop protection solutions, including biopesticides derived from natural sources and microbial agents, present a significant growth avenue, driven by consumer preference for organic produce. Strategic partnerships between agrochemical companies and technology providers are fostering innovation in areas like smart agriculture, enabling data-driven decision-making for optimized product application and reduced waste. Market expansion into developing economies, where agricultural modernization is rapidly progressing, offers substantial potential for growth. Furthermore, the increasing focus on specialty crops and urban farming creates niche markets for highly targeted and sustainable crop protection solutions, representing an estimated $8 Billion untapped market potential.
Leading Players in the Crop Protection Industry Sector
- FMC Corporation
- Sumitomo Chemical Co Ltd
- ADAMA Agricultural Solutions Ltd
- Bayer AG
- UPL Limited
- Syngenta Group
- Jiangsu Yangnong Chemical Co Ltd
- Corteva Agriscience
- Nufarm Ltd
- BASF SE
Key Milestones in Crop Protection Industry Industry
- December 2023: ADAMA introduced its most advanced cross-spectrum herbicide, Kampai, for the grain business. This innovation provides the broadest application window for broadleaf and narrow-leaf weed control for cereal crops, significantly enhancing farmer efficiency.
- July 2023: ADAMA launched new products, Davai A Plus and Clearfield Broad-Spectrum Herbicide Solutions, specifically for imidazolinone-tolerant legumes such as lentils, peas, and soybeans, expanding options for legume farmers and improving crop quality.
- April 2023: Nufarm launched Tourney EZ, a new liquid formulation fungicide, exclusively for turf and ornamental crops. This launch was a direct response to customer demand and further solidifies Nufarm's strong position in the turf and ornamental crop protection sector.
Strategic Outlook for Crop Protection Industry Market
The strategic outlook for the Crop Protection Industry is characterized by a strong trajectory of innovation and sustainable growth. Future market potential lies in the continued development and integration of precision agriculture technologies, enabling farmers to optimize resource utilization and minimize environmental impact. The burgeoning market for biological crop protection solutions, coupled with advancements in gene editing and biotechnology, offers significant opportunities for diversification and market leadership. Strategic partnerships and collaborations will be crucial for accelerating R&D, expanding market reach, and navigating complex regulatory landscapes. Furthermore, focusing on emerging markets and developing tailored solutions for specific regional needs will be key to unlocking long-term growth and ensuring global food security in a sustainable manner. The industry is expected to see an increased investment of $20 Billion in sustainable solutions by 2030.
Crop Protection Industry Segmentation
-
1. Function
- 1.1. Fungicide
- 1.2. Herbicide
- 1.3. Insecticide
- 1.4. Molluscicide
- 1.5. Nematicide
-
2. Application Mode
- 2.1. Chemigation
- 2.2. Foliar
- 2.3. Fumigation
- 2.4. Seed Treatment
- 2.5. Soil Treatment
-
3. Crop Type
- 3.1. Commercial Crops
- 3.2. Fruits & Vegetables
- 3.3. Grains & Cereals
- 3.4. Pulses & Oilseeds
- 3.5. Turf & Ornamental
-
4. Function
- 4.1. Fungicide
- 4.2. Herbicide
- 4.3. Insecticide
- 4.4. Molluscicide
- 4.5. Nematicide
-
5. Application Mode
- 5.1. Chemigation
- 5.2. Foliar
- 5.3. Fumigation
- 5.4. Seed Treatment
- 5.5. Soil Treatment
-
6. Crop Type
- 6.1. Commercial Crops
- 6.2. Fruits & Vegetables
- 6.3. Grains & Cereals
- 6.4. Pulses & Oilseeds
- 6.5. Turf & Ornamental
Crop Protection Industry Segmentation By Geography
-
1. North America
- 1.1. United States
- 1.2. Canada
- 1.3. Mexico
-
2. South America
- 2.1. Brazil
- 2.2. Argentina
- 2.3. Rest of South America
-
3. Europe
- 3.1. United Kingdom
- 3.2. Germany
- 3.3. France
- 3.4. Italy
- 3.5. Spain
- 3.6. Russia
- 3.7. Benelux
- 3.8. Nordics
- 3.9. Rest of Europe
-
4. Middle East & Africa
- 4.1. Turkey
- 4.2. Israel
- 4.3. GCC
- 4.4. North Africa
- 4.5. South Africa
- 4.6. Rest of Middle East & Africa
-
5. Asia Pacific
- 5.1. China
- 5.2. India
- 5.3. Japan
- 5.4. South Korea
- 5.5. ASEAN
- 5.6. Oceania
- 5.7. Rest of Asia Pacific
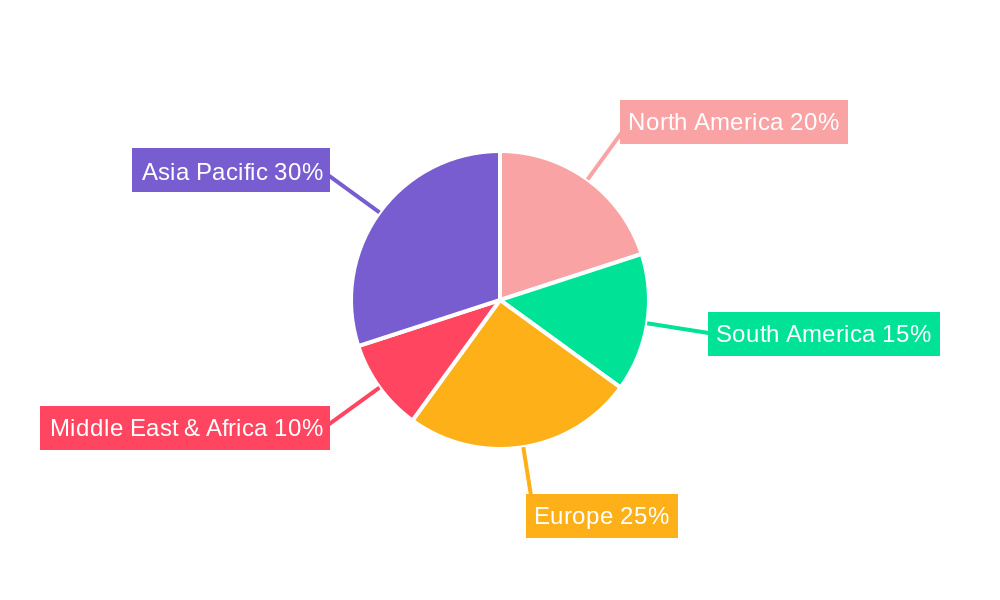
Crop Protection Industry Regional Market Share
Geographic Coverage of Crop Protection Industry
Crop Protection Industry REPORT HIGHLIGHTS
| Aspects | Details |
|---|---|
| Study Period | 2020-2034 |
| Base Year | 2025 |
| Estimated Year | 2026 |
| Forecast Period | 2026-2034 |
| Historical Period | 2020-2025 |
| Growth Rate | CAGR of 5.60% from 2020-2034 |
| Segmentation |
|
Table of Contents
- 1. Introduction
- 1.1. Research Scope
- 1.2. Market Segmentation
- 1.3. Research Objective
- 1.4. Definitions and Assumptions
- 2. Executive Summary
- 2.1. Market Snapshot
- 3. Market Dynamics
- 3.1. Market Drivers
- 3.2. Market Restrains
- 3.3. Market Trends
- 3.4. Market Opportunities
- 4. Market Factor Analysis
- 4.1. Porters Five Forces
- 4.1.1. Bargaining Power of Suppliers
- 4.1.2. Bargaining Power of Buyers
- 4.1.3. Threat of New Entrants
- 4.1.4. Threat of Substitutes
- 4.1.5. Competitive Rivalry
- 4.2. PESTEL analysis
- 4.3. BCG Analysis
- 4.3.1. Stars (High Growth, High Market Share)
- 4.3.2. Cash Cows (Low Growth, High Market Share)
- 4.3.3. Question Mark (High Growth, Low Market Share)
- 4.3.4. Dogs (Low Growth, Low Market Share)
- 4.4. Ansoff Matrix Analysis
- 4.5. Supply Chain Analysis
- 4.6. Regulatory Landscape
- 4.7. Current Market Potential and Opportunity Assessment (TAM–SAM–SOM Framework)
- 4.8. MDP Analyst Note
- 4.1. Porters Five Forces
- 5. Market Analysis, Insights and Forecast 2021-2033
- 5.1. Market Analysis, Insights and Forecast - by Function
- 5.1.1. Fungicide
- 5.1.2. Herbicide
- 5.1.3. Insecticide
- 5.1.4. Molluscicide
- 5.1.5. Nematicide
- 5.2. Market Analysis, Insights and Forecast - by Application Mode
- 5.2.1. Chemigation
- 5.2.2. Foliar
- 5.2.3. Fumigation
- 5.2.4. Seed Treatment
- 5.2.5. Soil Treatment
- 5.3. Market Analysis, Insights and Forecast - by Crop Type
- 5.3.1. Commercial Crops
- 5.3.2. Fruits & Vegetables
- 5.3.3. Grains & Cereals
- 5.3.4. Pulses & Oilseeds
- 5.3.5. Turf & Ornamental
- 5.4. Market Analysis, Insights and Forecast - by Function
- 5.4.1. Fungicide
- 5.4.2. Herbicide
- 5.4.3. Insecticide
- 5.4.4. Molluscicide
- 5.4.5. Nematicide
- 5.5. Market Analysis, Insights and Forecast - by Application Mode
- 5.5.1. Chemigation
- 5.5.2. Foliar
- 5.5.3. Fumigation
- 5.5.4. Seed Treatment
- 5.5.5. Soil Treatment
- 5.6. Market Analysis, Insights and Forecast - by Crop Type
- 5.6.1. Commercial Crops
- 5.6.2. Fruits & Vegetables
- 5.6.3. Grains & Cereals
- 5.6.4. Pulses & Oilseeds
- 5.6.5. Turf & Ornamental
- 5.7. Market Analysis, Insights and Forecast - by Region
- 5.7.1. North America
- 5.7.2. South America
- 5.7.3. Europe
- 5.7.4. Middle East & Africa
- 5.7.5. Asia Pacific
- 5.1. Market Analysis, Insights and Forecast - by Function
- 6. Global Crop Protection Industry Analysis, Insights and Forecast, 2021-2033
- 6.1. Market Analysis, Insights and Forecast - by Function
- 6.1.1. Fungicide
- 6.1.2. Herbicide
- 6.1.3. Insecticide
- 6.1.4. Molluscicide
- 6.1.5. Nematicide
- 6.2. Market Analysis, Insights and Forecast - by Application Mode
- 6.2.1. Chemigation
- 6.2.2. Foliar
- 6.2.3. Fumigation
- 6.2.4. Seed Treatment
- 6.2.5. Soil Treatment
- 6.3. Market Analysis, Insights and Forecast - by Crop Type
- 6.3.1. Commercial Crops
- 6.3.2. Fruits & Vegetables
- 6.3.3. Grains & Cereals
- 6.3.4. Pulses & Oilseeds
- 6.3.5. Turf & Ornamental
- 6.4. Market Analysis, Insights and Forecast - by Function
- 6.4.1. Fungicide
- 6.4.2. Herbicide
- 6.4.3. Insecticide
- 6.4.4. Molluscicide
- 6.4.5. Nematicide
- 6.5. Market Analysis, Insights and Forecast - by Application Mode
- 6.5.1. Chemigation
- 6.5.2. Foliar
- 6.5.3. Fumigation
- 6.5.4. Seed Treatment
- 6.5.5. Soil Treatment
- 6.6. Market Analysis, Insights and Forecast - by Crop Type
- 6.6.1. Commercial Crops
- 6.6.2. Fruits & Vegetables
- 6.6.3. Grains & Cereals
- 6.6.4. Pulses & Oilseeds
- 6.6.5. Turf & Ornamental
- 6.1. Market Analysis, Insights and Forecast - by Function
- 7. North America Crop Protection Industry Analysis, Insights and Forecast, 2020-2032
- 7.1. Market Analysis, Insights and Forecast - by Function
- 7.1.1. Fungicide
- 7.1.2. Herbicide
- 7.1.3. Insecticide
- 7.1.4. Molluscicide
- 7.1.5. Nematicide
- 7.2. Market Analysis, Insights and Forecast - by Application Mode
- 7.2.1. Chemigation
- 7.2.2. Foliar
- 7.2.3. Fumigation
- 7.2.4. Seed Treatment
- 7.2.5. Soil Treatment
- 7.3. Market Analysis, Insights and Forecast - by Crop Type
- 7.3.1. Commercial Crops
- 7.3.2. Fruits & Vegetables
- 7.3.3. Grains & Cereals
- 7.3.4. Pulses & Oilseeds
- 7.3.5. Turf & Ornamental
- 7.4. Market Analysis, Insights and Forecast - by Function
- 7.4.1. Fungicide
- 7.4.2. Herbicide
- 7.4.3. Insecticide
- 7.4.4. Molluscicide
- 7.4.5. Nematicide
- 7.5. Market Analysis, Insights and Forecast - by Application Mode
- 7.5.1. Chemigation
- 7.5.2. Foliar
- 7.5.3. Fumigation
- 7.5.4. Seed Treatment
- 7.5.5. Soil Treatment
- 7.6. Market Analysis, Insights and Forecast - by Crop Type
- 7.6.1. Commercial Crops
- 7.6.2. Fruits & Vegetables
- 7.6.3. Grains & Cereals
- 7.6.4. Pulses & Oilseeds
- 7.6.5. Turf & Ornamental
- 7.1. Market Analysis, Insights and Forecast - by Function
- 8. South America Crop Protection Industry Analysis, Insights and Forecast, 2020-2032
- 8.1. Market Analysis, Insights and Forecast - by Function
- 8.1.1. Fungicide
- 8.1.2. Herbicide
- 8.1.3. Insecticide
- 8.1.4. Molluscicide
- 8.1.5. Nematicide
- 8.2. Market Analysis, Insights and Forecast - by Application Mode
- 8.2.1. Chemigation
- 8.2.2. Foliar
- 8.2.3. Fumigation
- 8.2.4. Seed Treatment
- 8.2.5. Soil Treatment
- 8.3. Market Analysis, Insights and Forecast - by Crop Type
- 8.3.1. Commercial Crops
- 8.3.2. Fruits & Vegetables
- 8.3.3. Grains & Cereals
- 8.3.4. Pulses & Oilseeds
- 8.3.5. Turf & Ornamental
- 8.4. Market Analysis, Insights and Forecast - by Function
- 8.4.1. Fungicide
- 8.4.2. Herbicide
- 8.4.3. Insecticide
- 8.4.4. Molluscicide
- 8.4.5. Nematicide
- 8.5. Market Analysis, Insights and Forecast - by Application Mode
- 8.5.1. Chemigation
- 8.5.2. Foliar
- 8.5.3. Fumigation
- 8.5.4. Seed Treatment
- 8.5.5. Soil Treatment
- 8.6. Market Analysis, Insights and Forecast - by Crop Type
- 8.6.1. Commercial Crops
- 8.6.2. Fruits & Vegetables
- 8.6.3. Grains & Cereals
- 8.6.4. Pulses & Oilseeds
- 8.6.5. Turf & Ornamental
- 8.1. Market Analysis, Insights and Forecast - by Function
- 9. Europe Crop Protection Industry Analysis, Insights and Forecast, 2020-2032
- 9.1. Market Analysis, Insights and Forecast - by Function
- 9.1.1. Fungicide
- 9.1.2. Herbicide
- 9.1.3. Insecticide
- 9.1.4. Molluscicide
- 9.1.5. Nematicide
- 9.2. Market Analysis, Insights and Forecast - by Application Mode
- 9.2.1. Chemigation
- 9.2.2. Foliar
- 9.2.3. Fumigation
- 9.2.4. Seed Treatment
- 9.2.5. Soil Treatment
- 9.3. Market Analysis, Insights and Forecast - by Crop Type
- 9.3.1. Commercial Crops
- 9.3.2. Fruits & Vegetables
- 9.3.3. Grains & Cereals
- 9.3.4. Pulses & Oilseeds
- 9.3.5. Turf & Ornamental
- 9.4. Market Analysis, Insights and Forecast - by Function
- 9.4.1. Fungicide
- 9.4.2. Herbicide
- 9.4.3. Insecticide
- 9.4.4. Molluscicide
- 9.4.5. Nematicide
- 9.5. Market Analysis, Insights and Forecast - by Application Mode
- 9.5.1. Chemigation
- 9.5.2. Foliar
- 9.5.3. Fumigation
- 9.5.4. Seed Treatment
- 9.5.5. Soil Treatment
- 9.6. Market Analysis, Insights and Forecast - by Crop Type
- 9.6.1. Commercial Crops
- 9.6.2. Fruits & Vegetables
- 9.6.3. Grains & Cereals
- 9.6.4. Pulses & Oilseeds
- 9.6.5. Turf & Ornamental
- 9.1. Market Analysis, Insights and Forecast - by Function
- 10. Middle East & Africa Crop Protection Industry Analysis, Insights and Forecast, 2020-2032
- 10.1. Market Analysis, Insights and Forecast - by Function
- 10.1.1. Fungicide
- 10.1.2. Herbicide
- 10.1.3. Insecticide
- 10.1.4. Molluscicide
- 10.1.5. Nematicide
- 10.2. Market Analysis, Insights and Forecast - by Application Mode
- 10.2.1. Chemigation
- 10.2.2. Foliar
- 10.2.3. Fumigation
- 10.2.4. Seed Treatment
- 10.2.5. Soil Treatment
- 10.3. Market Analysis, Insights and Forecast - by Crop Type
- 10.3.1. Commercial Crops
- 10.3.2. Fruits & Vegetables
- 10.3.3. Grains & Cereals
- 10.3.4. Pulses & Oilseeds
- 10.3.5. Turf & Ornamental
- 10.4. Market Analysis, Insights and Forecast - by Function
- 10.4.1. Fungicide
- 10.4.2. Herbicide
- 10.4.3. Insecticide
- 10.4.4. Molluscicide
- 10.4.5. Nematicide
- 10.5. Market Analysis, Insights and Forecast - by Application Mode
- 10.5.1. Chemigation
- 10.5.2. Foliar
- 10.5.3. Fumigation
- 10.5.4. Seed Treatment
- 10.5.5. Soil Treatment
- 10.6. Market Analysis, Insights and Forecast - by Crop Type
- 10.6.1. Commercial Crops
- 10.6.2. Fruits & Vegetables
- 10.6.3. Grains & Cereals
- 10.6.4. Pulses & Oilseeds
- 10.6.5. Turf & Ornamental
- 10.1. Market Analysis, Insights and Forecast - by Function
- 11. Asia Pacific Crop Protection Industry Analysis, Insights and Forecast, 2020-2032
- 11.1. Market Analysis, Insights and Forecast - by Function
- 11.1.1. Fungicide
- 11.1.2. Herbicide
- 11.1.3. Insecticide
- 11.1.4. Molluscicide
- 11.1.5. Nematicide
- 11.2. Market Analysis, Insights and Forecast - by Application Mode
- 11.2.1. Chemigation
- 11.2.2. Foliar
- 11.2.3. Fumigation
- 11.2.4. Seed Treatment
- 11.2.5. Soil Treatment
- 11.3. Market Analysis, Insights and Forecast - by Crop Type
- 11.3.1. Commercial Crops
- 11.3.2. Fruits & Vegetables
- 11.3.3. Grains & Cereals
- 11.3.4. Pulses & Oilseeds
- 11.3.5. Turf & Ornamental
- 11.4. Market Analysis, Insights and Forecast - by Function
- 11.4.1. Fungicide
- 11.4.2. Herbicide
- 11.4.3. Insecticide
- 11.4.4. Molluscicide
- 11.4.5. Nematicide
- 11.5. Market Analysis, Insights and Forecast - by Application Mode
- 11.5.1. Chemigation
- 11.5.2. Foliar
- 11.5.3. Fumigation
- 11.5.4. Seed Treatment
- 11.5.5. Soil Treatment
- 11.6. Market Analysis, Insights and Forecast - by Crop Type
- 11.6.1. Commercial Crops
- 11.6.2. Fruits & Vegetables
- 11.6.3. Grains & Cereals
- 11.6.4. Pulses & Oilseeds
- 11.6.5. Turf & Ornamental
- 11.1. Market Analysis, Insights and Forecast - by Function
- 12. Competitive Analysis
- 12.1. Company Profiles
- 12.1.1 FMC Corporation
- 12.1.1.1. Company Overview
- 12.1.1.2. Products
- 12.1.1.3. Company Financials
- 12.1.1.4. SWOT Analysis
- 12.1.2 Sumitomo Chemical Co Ltd
- 12.1.2.1. Company Overview
- 12.1.2.2. Products
- 12.1.2.3. Company Financials
- 12.1.2.4. SWOT Analysis
- 12.1.3 ADAMA Agricultural Solutions Ltd
- 12.1.3.1. Company Overview
- 12.1.3.2. Products
- 12.1.3.3. Company Financials
- 12.1.3.4. SWOT Analysis
- 12.1.4 Bayer AG
- 12.1.4.1. Company Overview
- 12.1.4.2. Products
- 12.1.4.3. Company Financials
- 12.1.4.4. SWOT Analysis
- 12.1.5 UPL Limite
- 12.1.5.1. Company Overview
- 12.1.5.2. Products
- 12.1.5.3. Company Financials
- 12.1.5.4. SWOT Analysis
- 12.1.6 Syngenta Group
- 12.1.6.1. Company Overview
- 12.1.6.2. Products
- 12.1.6.3. Company Financials
- 12.1.6.4. SWOT Analysis
- 12.1.7 Jiangsu Yangnong Chemical Co Ltd
- 12.1.7.1. Company Overview
- 12.1.7.2. Products
- 12.1.7.3. Company Financials
- 12.1.7.4. SWOT Analysis
- 12.1.8 Corteva Agriscience
- 12.1.8.1. Company Overview
- 12.1.8.2. Products
- 12.1.8.3. Company Financials
- 12.1.8.4. SWOT Analysis
- 12.1.9 Nufarm Ltd
- 12.1.9.1. Company Overview
- 12.1.9.2. Products
- 12.1.9.3. Company Financials
- 12.1.9.4. SWOT Analysis
- 12.1.10 BASF SE
- 12.1.10.1. Company Overview
- 12.1.10.2. Products
- 12.1.10.3. Company Financials
- 12.1.10.4. SWOT Analysis
- 12.1.1 FMC Corporation
- 12.2. Market Entropy
- 12.2.1 Company's Key Areas Served
- 12.2.2 Recent Developments
- 12.3. Company Market Share Analysis 2025
- 12.3.1 Top 5 Companies Market Share Analysis
- 12.3.2 Top 3 Companies Market Share Analysis
- 12.4. List of Potential Customers
- 13. Research Methodology
List of Figures
- Figure 1: Global Crop Protection Industry Revenue Breakdown (Million, %) by Region 2025 & 2033
- Figure 2: Global Crop Protection Industry Volume Breakdown (kilotons, %) by Region 2025 & 2033
- Figure 3: North America Crop Protection Industry Revenue (Million), by Function 2025 & 2033
- Figure 4: North America Crop Protection Industry Volume (kilotons), by Function 2025 & 2033
- Figure 5: North America Crop Protection Industry Revenue Share (%), by Function 2025 & 2033
- Figure 6: North America Crop Protection Industry Volume Share (%), by Function 2025 & 2033
- Figure 7: North America Crop Protection Industry Revenue (Million), by Application Mode 2025 & 2033
- Figure 8: North America Crop Protection Industry Volume (kilotons), by Application Mode 2025 & 2033
- Figure 9: North America Crop Protection Industry Revenue Share (%), by Application Mode 2025 & 2033
- Figure 10: North America Crop Protection Industry Volume Share (%), by Application Mode 2025 & 2033
- Figure 11: North America Crop Protection Industry Revenue (Million), by Crop Type 2025 & 2033
- Figure 12: North America Crop Protection Industry Volume (kilotons), by Crop Type 2025 & 2033
- Figure 13: North America Crop Protection Industry Revenue Share (%), by Crop Type 2025 & 2033
- Figure 14: North America Crop Protection Industry Volume Share (%), by Crop Type 2025 & 2033
- Figure 15: North America Crop Protection Industry Revenue (Million), by Function 2025 & 2033
- Figure 16: North America Crop Protection Industry Volume (kilotons), by Function 2025 & 2033
- Figure 17: North America Crop Protection Industry Revenue Share (%), by Function 2025 & 2033
- Figure 18: North America Crop Protection Industry Volume Share (%), by Function 2025 & 2033
- Figure 19: North America Crop Protection Industry Revenue (Million), by Application Mode 2025 & 2033
- Figure 20: North America Crop Protection Industry Volume (kilotons), by Application Mode 2025 & 2033
- Figure 21: North America Crop Protection Industry Revenue Share (%), by Application Mode 2025 & 2033
- Figure 22: North America Crop Protection Industry Volume Share (%), by Application Mode 2025 & 2033
- Figure 23: North America Crop Protection Industry Revenue (Million), by Crop Type 2025 & 2033
- Figure 24: North America Crop Protection Industry Volume (kilotons), by Crop Type 2025 & 2033
- Figure 25: North America Crop Protection Industry Revenue Share (%), by Crop Type 2025 & 2033
- Figure 26: North America Crop Protection Industry Volume Share (%), by Crop Type 2025 & 2033
- Figure 27: North America Crop Protection Industry Revenue (Million), by Country 2025 & 2033
- Figure 28: North America Crop Protection Industry Volume (kilotons), by Country 2025 & 2033
- Figure 29: North America Crop Protection Industry Revenue Share (%), by Country 2025 & 2033
- Figure 30: North America Crop Protection Industry Volume Share (%), by Country 2025 & 2033
- Figure 31: South America Crop Protection Industry Revenue (Million), by Function 2025 & 2033
- Figure 32: South America Crop Protection Industry Volume (kilotons), by Function 2025 & 2033
- Figure 33: South America Crop Protection Industry Revenue Share (%), by Function 2025 & 2033
- Figure 34: South America Crop Protection Industry Volume Share (%), by Function 2025 & 2033
- Figure 35: South America Crop Protection Industry Revenue (Million), by Application Mode 2025 & 2033
- Figure 36: South America Crop Protection Industry Volume (kilotons), by Application Mode 2025 & 2033
- Figure 37: South America Crop Protection Industry Revenue Share (%), by Application Mode 2025 & 2033
- Figure 38: South America Crop Protection Industry Volume Share (%), by Application Mode 2025 & 2033
- Figure 39: South America Crop Protection Industry Revenue (Million), by Crop Type 2025 & 2033
- Figure 40: South America Crop Protection Industry Volume (kilotons), by Crop Type 2025 & 2033
- Figure 41: South America Crop Protection Industry Revenue Share (%), by Crop Type 2025 & 2033
- Figure 42: South America Crop Protection Industry Volume Share (%), by Crop Type 2025 & 2033
- Figure 43: South America Crop Protection Industry Revenue (Million), by Function 2025 & 2033
- Figure 44: South America Crop Protection Industry Volume (kilotons), by Function 2025 & 2033
- Figure 45: South America Crop Protection Industry Revenue Share (%), by Function 2025 & 2033
- Figure 46: South America Crop Protection Industry Volume Share (%), by Function 2025 & 2033
- Figure 47: South America Crop Protection Industry Revenue (Million), by Application Mode 2025 & 2033
- Figure 48: South America Crop Protection Industry Volume (kilotons), by Application Mode 2025 & 2033
- Figure 49: South America Crop Protection Industry Revenue Share (%), by Application Mode 2025 & 2033
- Figure 50: South America Crop Protection Industry Volume Share (%), by Application Mode 2025 & 2033
- Figure 51: South America Crop Protection Industry Revenue (Million), by Crop Type 2025 & 2033
- Figure 52: South America Crop Protection Industry Volume (kilotons), by Crop Type 2025 & 2033
- Figure 53: South America Crop Protection Industry Revenue Share (%), by Crop Type 2025 & 2033
- Figure 54: South America Crop Protection Industry Volume Share (%), by Crop Type 2025 & 2033
- Figure 55: South America Crop Protection Industry Revenue (Million), by Country 2025 & 2033
- Figure 56: South America Crop Protection Industry Volume (kilotons), by Country 2025 & 2033
- Figure 57: South America Crop Protection Industry Revenue Share (%), by Country 2025 & 2033
- Figure 58: South America Crop Protection Industry Volume Share (%), by Country 2025 & 2033
- Figure 59: Europe Crop Protection Industry Revenue (Million), by Function 2025 & 2033
- Figure 60: Europe Crop Protection Industry Volume (kilotons), by Function 2025 & 2033
- Figure 61: Europe Crop Protection Industry Revenue Share (%), by Function 2025 & 2033
- Figure 62: Europe Crop Protection Industry Volume Share (%), by Function 2025 & 2033
- Figure 63: Europe Crop Protection Industry Revenue (Million), by Application Mode 2025 & 2033
- Figure 64: Europe Crop Protection Industry Volume (kilotons), by Application Mode 2025 & 2033
- Figure 65: Europe Crop Protection Industry Revenue Share (%), by Application Mode 2025 & 2033
- Figure 66: Europe Crop Protection Industry Volume Share (%), by Application Mode 2025 & 2033
- Figure 67: Europe Crop Protection Industry Revenue (Million), by Crop Type 2025 & 2033
- Figure 68: Europe Crop Protection Industry Volume (kilotons), by Crop Type 2025 & 2033
- Figure 69: Europe Crop Protection Industry Revenue Share (%), by Crop Type 2025 & 2033
- Figure 70: Europe Crop Protection Industry Volume Share (%), by Crop Type 2025 & 2033
- Figure 71: Europe Crop Protection Industry Revenue (Million), by Function 2025 & 2033
- Figure 72: Europe Crop Protection Industry Volume (kilotons), by Function 2025 & 2033
- Figure 73: Europe Crop Protection Industry Revenue Share (%), by Function 2025 & 2033
- Figure 74: Europe Crop Protection Industry Volume Share (%), by Function 2025 & 2033
- Figure 75: Europe Crop Protection Industry Revenue (Million), by Application Mode 2025 & 2033
- Figure 76: Europe Crop Protection Industry Volume (kilotons), by Application Mode 2025 & 2033
- Figure 77: Europe Crop Protection Industry Revenue Share (%), by Application Mode 2025 & 2033
- Figure 78: Europe Crop Protection Industry Volume Share (%), by Application Mode 2025 & 2033
- Figure 79: Europe Crop Protection Industry Revenue (Million), by Crop Type 2025 & 2033
- Figure 80: Europe Crop Protection Industry Volume (kilotons), by Crop Type 2025 & 2033
- Figure 81: Europe Crop Protection Industry Revenue Share (%), by Crop Type 2025 & 2033
- Figure 82: Europe Crop Protection Industry Volume Share (%), by Crop Type 2025 & 2033
- Figure 83: Europe Crop Protection Industry Revenue (Million), by Country 2025 & 2033
- Figure 84: Europe Crop Protection Industry Volume (kilotons), by Country 2025 & 2033
- Figure 85: Europe Crop Protection Industry Revenue Share (%), by Country 2025 & 2033
- Figure 86: Europe Crop Protection Industry Volume Share (%), by Country 2025 & 2033
- Figure 87: Middle East & Africa Crop Protection Industry Revenue (Million), by Function 2025 & 2033
- Figure 88: Middle East & Africa Crop Protection Industry Volume (kilotons), by Function 2025 & 2033
- Figure 89: Middle East & Africa Crop Protection Industry Revenue Share (%), by Function 2025 & 2033
- Figure 90: Middle East & Africa Crop Protection Industry Volume Share (%), by Function 2025 & 2033
- Figure 91: Middle East & Africa Crop Protection Industry Revenue (Million), by Application Mode 2025 & 2033
- Figure 92: Middle East & Africa Crop Protection Industry Volume (kilotons), by Application Mode 2025 & 2033
- Figure 93: Middle East & Africa Crop Protection Industry Revenue Share (%), by Application Mode 2025 & 2033
- Figure 94: Middle East & Africa Crop Protection Industry Volume Share (%), by Application Mode 2025 & 2033
- Figure 95: Middle East & Africa Crop Protection Industry Revenue (Million), by Crop Type 2025 & 2033
- Figure 96: Middle East & Africa Crop Protection Industry Volume (kilotons), by Crop Type 2025 & 2033
- Figure 97: Middle East & Africa Crop Protection Industry Revenue Share (%), by Crop Type 2025 & 2033
- Figure 98: Middle East & Africa Crop Protection Industry Volume Share (%), by Crop Type 2025 & 2033
- Figure 99: Middle East & Africa Crop Protection Industry Revenue (Million), by Function 2025 & 2033
- Figure 100: Middle East & Africa Crop Protection Industry Volume (kilotons), by Function 2025 & 2033
- Figure 101: Middle East & Africa Crop Protection Industry Revenue Share (%), by Function 2025 & 2033
- Figure 102: Middle East & Africa Crop Protection Industry Volume Share (%), by Function 2025 & 2033
- Figure 103: Middle East & Africa Crop Protection Industry Revenue (Million), by Application Mode 2025 & 2033
- Figure 104: Middle East & Africa Crop Protection Industry Volume (kilotons), by Application Mode 2025 & 2033
- Figure 105: Middle East & Africa Crop Protection Industry Revenue Share (%), by Application Mode 2025 & 2033
- Figure 106: Middle East & Africa Crop Protection Industry Volume Share (%), by Application Mode 2025 & 2033
- Figure 107: Middle East & Africa Crop Protection Industry Revenue (Million), by Crop Type 2025 & 2033
- Figure 108: Middle East & Africa Crop Protection Industry Volume (kilotons), by Crop Type 2025 & 2033
- Figure 109: Middle East & Africa Crop Protection Industry Revenue Share (%), by Crop Type 2025 & 2033
- Figure 110: Middle East & Africa Crop Protection Industry Volume Share (%), by Crop Type 2025 & 2033
- Figure 111: Middle East & Africa Crop Protection Industry Revenue (Million), by Country 2025 & 2033
- Figure 112: Middle East & Africa Crop Protection Industry Volume (kilotons), by Country 2025 & 2033
- Figure 113: Middle East & Africa Crop Protection Industry Revenue Share (%), by Country 2025 & 2033
- Figure 114: Middle East & Africa Crop Protection Industry Volume Share (%), by Country 2025 & 2033
- Figure 115: Asia Pacific Crop Protection Industry Revenue (Million), by Function 2025 & 2033
- Figure 116: Asia Pacific Crop Protection Industry Volume (kilotons), by Function 2025 & 2033
- Figure 117: Asia Pacific Crop Protection Industry Revenue Share (%), by Function 2025 & 2033
- Figure 118: Asia Pacific Crop Protection Industry Volume Share (%), by Function 2025 & 2033
- Figure 119: Asia Pacific Crop Protection Industry Revenue (Million), by Application Mode 2025 & 2033
- Figure 120: Asia Pacific Crop Protection Industry Volume (kilotons), by Application Mode 2025 & 2033
- Figure 121: Asia Pacific Crop Protection Industry Revenue Share (%), by Application Mode 2025 & 2033
- Figure 122: Asia Pacific Crop Protection Industry Volume Share (%), by Application Mode 2025 & 2033
- Figure 123: Asia Pacific Crop Protection Industry Revenue (Million), by Crop Type 2025 & 2033
- Figure 124: Asia Pacific Crop Protection Industry Volume (kilotons), by Crop Type 2025 & 2033
- Figure 125: Asia Pacific Crop Protection Industry Revenue Share (%), by Crop Type 2025 & 2033
- Figure 126: Asia Pacific Crop Protection Industry Volume Share (%), by Crop Type 2025 & 2033
- Figure 127: Asia Pacific Crop Protection Industry Revenue (Million), by Function 2025 & 2033
- Figure 128: Asia Pacific Crop Protection Industry Volume (kilotons), by Function 2025 & 2033
- Figure 129: Asia Pacific Crop Protection Industry Revenue Share (%), by Function 2025 & 2033
- Figure 130: Asia Pacific Crop Protection Industry Volume Share (%), by Function 2025 & 2033
- Figure 131: Asia Pacific Crop Protection Industry Revenue (Million), by Application Mode 2025 & 2033
- Figure 132: Asia Pacific Crop Protection Industry Volume (kilotons), by Application Mode 2025 & 2033
- Figure 133: Asia Pacific Crop Protection Industry Revenue Share (%), by Application Mode 2025 & 2033
- Figure 134: Asia Pacific Crop Protection Industry Volume Share (%), by Application Mode 2025 & 2033
- Figure 135: Asia Pacific Crop Protection Industry Revenue (Million), by Crop Type 2025 & 2033
- Figure 136: Asia Pacific Crop Protection Industry Volume (kilotons), by Crop Type 2025 & 2033
- Figure 137: Asia Pacific Crop Protection Industry Revenue Share (%), by Crop Type 2025 & 2033
- Figure 138: Asia Pacific Crop Protection Industry Volume Share (%), by Crop Type 2025 & 2033
- Figure 139: Asia Pacific Crop Protection Industry Revenue (Million), by Country 2025 & 2033
- Figure 140: Asia Pacific Crop Protection Industry Volume (kilotons), by Country 2025 & 2033
- Figure 141: Asia Pacific Crop Protection Industry Revenue Share (%), by Country 2025 & 2033
- Figure 142: Asia Pacific Crop Protection Industry Volume Share (%), by Country 2025 & 2033
List of Tables
- Table 1: Global Crop Protection Industry Revenue Million Forecast, by Function 2020 & 2033
- Table 2: Global Crop Protection Industry Volume kilotons Forecast, by Function 2020 & 2033
- Table 3: Global Crop Protection Industry Revenue Million Forecast, by Application Mode 2020 & 2033
- Table 4: Global Crop Protection Industry Volume kilotons Forecast, by Application Mode 2020 & 2033
- Table 5: Global Crop Protection Industry Revenue Million Forecast, by Crop Type 2020 & 2033
- Table 6: Global Crop Protection Industry Volume kilotons Forecast, by Crop Type 2020 & 2033
- Table 7: Global Crop Protection Industry Revenue Million Forecast, by Function 2020 & 2033
- Table 8: Global Crop Protection Industry Volume kilotons Forecast, by Function 2020 & 2033
- Table 9: Global Crop Protection Industry Revenue Million Forecast, by Application Mode 2020 & 2033
- Table 10: Global Crop Protection Industry Volume kilotons Forecast, by Application Mode 2020 & 2033
- Table 11: Global Crop Protection Industry Revenue Million Forecast, by Crop Type 2020 & 2033
- Table 12: Global Crop Protection Industry Volume kilotons Forecast, by Crop Type 2020 & 2033
- Table 13: Global Crop Protection Industry Revenue Million Forecast, by Region 2020 & 2033
- Table 14: Global Crop Protection Industry Volume kilotons Forecast, by Region 2020 & 2033
- Table 15: Global Crop Protection Industry Revenue Million Forecast, by Function 2020 & 2033
- Table 16: Global Crop Protection Industry Volume kilotons Forecast, by Function 2020 & 2033
- Table 17: Global Crop Protection Industry Revenue Million Forecast, by Application Mode 2020 & 2033
- Table 18: Global Crop Protection Industry Volume kilotons Forecast, by Application Mode 2020 & 2033
- Table 19: Global Crop Protection Industry Revenue Million Forecast, by Crop Type 2020 & 2033
- Table 20: Global Crop Protection Industry Volume kilotons Forecast, by Crop Type 2020 & 2033
- Table 21: Global Crop Protection Industry Revenue Million Forecast, by Function 2020 & 2033
- Table 22: Global Crop Protection Industry Volume kilotons Forecast, by Function 2020 & 2033
- Table 23: Global Crop Protection Industry Revenue Million Forecast, by Application Mode 2020 & 2033
- Table 24: Global Crop Protection Industry Volume kilotons Forecast, by Application Mode 2020 & 2033
- Table 25: Global Crop Protection Industry Revenue Million Forecast, by Crop Type 2020 & 2033
- Table 26: Global Crop Protection Industry Volume kilotons Forecast, by Crop Type 2020 & 2033
- Table 27: Global Crop Protection Industry Revenue Million Forecast, by Country 2020 & 2033
- Table 28: Global Crop Protection Industry Volume kilotons Forecast, by Country 2020 & 2033
- Table 29: United States Crop Protection Industry Revenue (Million) Forecast, by Application 2020 & 2033
- Table 30: United States Crop Protection Industry Volume (kilotons) Forecast, by Application 2020 & 2033
- Table 31: Canada Crop Protection Industry Revenue (Million) Forecast, by Application 2020 & 2033
- Table 32: Canada Crop Protection Industry Volume (kilotons) Forecast, by Application 2020 & 2033
- Table 33: Mexico Crop Protection Industry Revenue (Million) Forecast, by Application 2020 & 2033
- Table 34: Mexico Crop Protection Industry Volume (kilotons) Forecast, by Application 2020 & 2033
- Table 35: Global Crop Protection Industry Revenue Million Forecast, by Function 2020 & 2033
- Table 36: Global Crop Protection Industry Volume kilotons Forecast, by Function 2020 & 2033
- Table 37: Global Crop Protection Industry Revenue Million Forecast, by Application Mode 2020 & 2033
- Table 38: Global Crop Protection Industry Volume kilotons Forecast, by Application Mode 2020 & 2033
- Table 39: Global Crop Protection Industry Revenue Million Forecast, by Crop Type 2020 & 2033
- Table 40: Global Crop Protection Industry Volume kilotons Forecast, by Crop Type 2020 & 2033
- Table 41: Global Crop Protection Industry Revenue Million Forecast, by Function 2020 & 2033
- Table 42: Global Crop Protection Industry Volume kilotons Forecast, by Function 2020 & 2033
- Table 43: Global Crop Protection Industry Revenue Million Forecast, by Application Mode 2020 & 2033
- Table 44: Global Crop Protection Industry Volume kilotons Forecast, by Application Mode 2020 & 2033
- Table 45: Global Crop Protection Industry Revenue Million Forecast, by Crop Type 2020 & 2033
- Table 46: Global Crop Protection Industry Volume kilotons Forecast, by Crop Type 2020 & 2033
- Table 47: Global Crop Protection Industry Revenue Million Forecast, by Country 2020 & 2033
- Table 48: Global Crop Protection Industry Volume kilotons Forecast, by Country 2020 & 2033
- Table 49: Brazil Crop Protection Industry Revenue (Million) Forecast, by Application 2020 & 2033
- Table 50: Brazil Crop Protection Industry Volume (kilotons) Forecast, by Application 2020 & 2033
- Table 51: Argentina Crop Protection Industry Revenue (Million) Forecast, by Application 2020 & 2033
- Table 52: Argentina Crop Protection Industry Volume (kilotons) Forecast, by Application 2020 & 2033
- Table 53: Rest of South America Crop Protection Industry Revenue (Million) Forecast, by Application 2020 & 2033
- Table 54: Rest of South America Crop Protection Industry Volume (kilotons) Forecast, by Application 2020 & 2033
- Table 55: Global Crop Protection Industry Revenue Million Forecast, by Function 2020 & 2033
- Table 56: Global Crop Protection Industry Volume kilotons Forecast, by Function 2020 & 2033
- Table 57: Global Crop Protection Industry Revenue Million Forecast, by Application Mode 2020 & 2033
- Table 58: Global Crop Protection Industry Volume kilotons Forecast, by Application Mode 2020 & 2033
- Table 59: Global Crop Protection Industry Revenue Million Forecast, by Crop Type 2020 & 2033
- Table 60: Global Crop Protection Industry Volume kilotons Forecast, by Crop Type 2020 & 2033
- Table 61: Global Crop Protection Industry Revenue Million Forecast, by Function 2020 & 2033
- Table 62: Global Crop Protection Industry Volume kilotons Forecast, by Function 2020 & 2033
- Table 63: Global Crop Protection Industry Revenue Million Forecast, by Application Mode 2020 & 2033
- Table 64: Global Crop Protection Industry Volume kilotons Forecast, by Application Mode 2020 & 2033
- Table 65: Global Crop Protection Industry Revenue Million Forecast, by Crop Type 2020 & 2033
- Table 66: Global Crop Protection Industry Volume kilotons Forecast, by Crop Type 2020 & 2033
- Table 67: Global Crop Protection Industry Revenue Million Forecast, by Country 2020 & 2033
- Table 68: Global Crop Protection Industry Volume kilotons Forecast, by Country 2020 & 2033
- Table 69: United Kingdom Crop Protection Industry Revenue (Million) Forecast, by Application 2020 & 2033
- Table 70: United Kingdom Crop Protection Industry Volume (kilotons) Forecast, by Application 2020 & 2033
- Table 71: Germany Crop Protection Industry Revenue (Million) Forecast, by Application 2020 & 2033
- Table 72: Germany Crop Protection Industry Volume (kilotons) Forecast, by Application 2020 & 2033
- Table 73: France Crop Protection Industry Revenue (Million) Forecast, by Application 2020 & 2033
- Table 74: France Crop Protection Industry Volume (kilotons) Forecast, by Application 2020 & 2033
- Table 75: Italy Crop Protection Industry Revenue (Million) Forecast, by Application 2020 & 2033
- Table 76: Italy Crop Protection Industry Volume (kilotons) Forecast, by Application 2020 & 2033
- Table 77: Spain Crop Protection Industry Revenue (Million) Forecast, by Application 2020 & 2033
- Table 78: Spain Crop Protection Industry Volume (kilotons) Forecast, by Application 2020 & 2033
- Table 79: Russia Crop Protection Industry Revenue (Million) Forecast, by Application 2020 & 2033
- Table 80: Russia Crop Protection Industry Volume (kilotons) Forecast, by Application 2020 & 2033
- Table 81: Benelux Crop Protection Industry Revenue (Million) Forecast, by Application 2020 & 2033
- Table 82: Benelux Crop Protection Industry Volume (kilotons) Forecast, by Application 2020 & 2033
- Table 83: Nordics Crop Protection Industry Revenue (Million) Forecast, by Application 2020 & 2033
- Table 84: Nordics Crop Protection Industry Volume (kilotons) Forecast, by Application 2020 & 2033
- Table 85: Rest of Europe Crop Protection Industry Revenue (Million) Forecast, by Application 2020 & 2033
- Table 86: Rest of Europe Crop Protection Industry Volume (kilotons) Forecast, by Application 2020 & 2033
- Table 87: Global Crop Protection Industry Revenue Million Forecast, by Function 2020 & 2033
- Table 88: Global Crop Protection Industry Volume kilotons Forecast, by Function 2020 & 2033
- Table 89: Global Crop Protection Industry Revenue Million Forecast, by Application Mode 2020 & 2033
- Table 90: Global Crop Protection Industry Volume kilotons Forecast, by Application Mode 2020 & 2033
- Table 91: Global Crop Protection Industry Revenue Million Forecast, by Crop Type 2020 & 2033
- Table 92: Global Crop Protection Industry Volume kilotons Forecast, by Crop Type 2020 & 2033
- Table 93: Global Crop Protection Industry Revenue Million Forecast, by Function 2020 & 2033
- Table 94: Global Crop Protection Industry Volume kilotons Forecast, by Function 2020 & 2033
- Table 95: Global Crop Protection Industry Revenue Million Forecast, by Application Mode 2020 & 2033
- Table 96: Global Crop Protection Industry Volume kilotons Forecast, by Application Mode 2020 & 2033
- Table 97: Global Crop Protection Industry Revenue Million Forecast, by Crop Type 2020 & 2033
- Table 98: Global Crop Protection Industry Volume kilotons Forecast, by Crop Type 2020 & 2033
- Table 99: Global Crop Protection Industry Revenue Million Forecast, by Country 2020 & 2033
- Table 100: Global Crop Protection Industry Volume kilotons Forecast, by Country 2020 & 2033
- Table 101: Turkey Crop Protection Industry Revenue (Million) Forecast, by Application 2020 & 2033
- Table 102: Turkey Crop Protection Industry Volume (kilotons) Forecast, by Application 2020 & 2033
- Table 103: Israel Crop Protection Industry Revenue (Million) Forecast, by Application 2020 & 2033
- Table 104: Israel Crop Protection Industry Volume (kilotons) Forecast, by Application 2020 & 2033
- Table 105: GCC Crop Protection Industry Revenue (Million) Forecast, by Application 2020 & 2033
- Table 106: GCC Crop Protection Industry Volume (kilotons) Forecast, by Application 2020 & 2033
- Table 107: North Africa Crop Protection Industry Revenue (Million) Forecast, by Application 2020 & 2033
- Table 108: North Africa Crop Protection Industry Volume (kilotons) Forecast, by Application 2020 & 2033
- Table 109: South Africa Crop Protection Industry Revenue (Million) Forecast, by Application 2020 & 2033
- Table 110: South Africa Crop Protection Industry Volume (kilotons) Forecast, by Application 2020 & 2033
- Table 111: Rest of Middle East & Africa Crop Protection Industry Revenue (Million) Forecast, by Application 2020 & 2033
- Table 112: Rest of Middle East & Africa Crop Protection Industry Volume (kilotons) Forecast, by Application 2020 & 2033
- Table 113: Global Crop Protection Industry Revenue Million Forecast, by Function 2020 & 2033
- Table 114: Global Crop Protection Industry Volume kilotons Forecast, by Function 2020 & 2033
- Table 115: Global Crop Protection Industry Revenue Million Forecast, by Application Mode 2020 & 2033
- Table 116: Global Crop Protection Industry Volume kilotons Forecast, by Application Mode 2020 & 2033
- Table 117: Global Crop Protection Industry Revenue Million Forecast, by Crop Type 2020 & 2033
- Table 118: Global Crop Protection Industry Volume kilotons Forecast, by Crop Type 2020 & 2033
- Table 119: Global Crop Protection Industry Revenue Million Forecast, by Function 2020 & 2033
- Table 120: Global Crop Protection Industry Volume kilotons Forecast, by Function 2020 & 2033
- Table 121: Global Crop Protection Industry Revenue Million Forecast, by Application Mode 2020 & 2033
- Table 122: Global Crop Protection Industry Volume kilotons Forecast, by Application Mode 2020 & 2033
- Table 123: Global Crop Protection Industry Revenue Million Forecast, by Crop Type 2020 & 2033
- Table 124: Global Crop Protection Industry Volume kilotons Forecast, by Crop Type 2020 & 2033
- Table 125: Global Crop Protection Industry Revenue Million Forecast, by Country 2020 & 2033
- Table 126: Global Crop Protection Industry Volume kilotons Forecast, by Country 2020 & 2033
- Table 127: China Crop Protection Industry Revenue (Million) Forecast, by Application 2020 & 2033
- Table 128: China Crop Protection Industry Volume (kilotons) Forecast, by Application 2020 & 2033
- Table 129: India Crop Protection Industry Revenue (Million) Forecast, by Application 2020 & 2033
- Table 130: India Crop Protection Industry Volume (kilotons) Forecast, by Application 2020 & 2033
- Table 131: Japan Crop Protection Industry Revenue (Million) Forecast, by Application 2020 & 2033
- Table 132: Japan Crop Protection Industry Volume (kilotons) Forecast, by Application 2020 & 2033
- Table 133: South Korea Crop Protection Industry Revenue (Million) Forecast, by Application 2020 & 2033
- Table 134: South Korea Crop Protection Industry Volume (kilotons) Forecast, by Application 2020 & 2033
- Table 135: ASEAN Crop Protection Industry Revenue (Million) Forecast, by Application 2020 & 2033
- Table 136: ASEAN Crop Protection Industry Volume (kilotons) Forecast, by Application 2020 & 2033
- Table 137: Oceania Crop Protection Industry Revenue (Million) Forecast, by Application 2020 & 2033
- Table 138: Oceania Crop Protection Industry Volume (kilotons) Forecast, by Application 2020 & 2033
- Table 139: Rest of Asia Pacific Crop Protection Industry Revenue (Million) Forecast, by Application 2020 & 2033
- Table 140: Rest of Asia Pacific Crop Protection Industry Volume (kilotons) Forecast, by Application 2020 & 2033
Frequently Asked Questions
1. What is the projected Compound Annual Growth Rate (CAGR) of the Crop Protection Industry?
The projected CAGR is approximately 5.60%.
2. Which companies are prominent players in the Crop Protection Industry?
Key companies in the market include FMC Corporation, Sumitomo Chemical Co Ltd, ADAMA Agricultural Solutions Ltd, Bayer AG, UPL Limite, Syngenta Group, Jiangsu Yangnong Chemical Co Ltd, Corteva Agriscience, Nufarm Ltd, BASF SE.
3. What are the main segments of the Crop Protection Industry?
The market segments include Function, Application Mode, Crop Type, Function, Application Mode, Crop Type.
4. Can you provide details about the market size?
The market size is estimated to be USD XX Million as of 2022.
5. What are some drivers contributing to market growth?
Seed Treatment As A Solution To Enhance Yield; Growing Awareness For Seed Treatment Among The Farmers; Rising Trend Of Organic Farming.
6. What are the notable trends driving market growth?
OTHER KEY INDUSTRY TRENDS COVERED IN THE REPORT.
7. Are there any restraints impacting market growth?
Limitations Across Farm-Level Seed Treatment; Rising Environmental Concerns.
8. Can you provide examples of recent developments in the market?
December 2023: ADAMA introduced its most advanced cross-spectrum herbicide called Kampai for the grain business. The new product provides the broadest application window for broadleaf and narrow-leaf weed control for cereal crops.July 2023: ADAMA introduced new products, Davai A Plus and Clearfield Broad-Spectrum Herbicide Solutions, for imidazolinone-tolerant legumes like lentils, peas, and soybeans.April 2023: Nufarm launched a new liquid formulation fungicide, Tourney EZ, exclusively for turf and ornamental crops based on customer demand, which further strengthens the company's role in turf and ornamental crop protection.
9. What pricing options are available for accessing the report?
Pricing options include single-user, multi-user, and enterprise licenses priced at USD 3800, USD 4500, and USD 5800 respectively.
10. Is the market size provided in terms of value or volume?
The market size is provided in terms of value, measured in Million and volume, measured in kilotons.
11. Are there any specific market keywords associated with the report?
Yes, the market keyword associated with the report is "Crop Protection Industry," which aids in identifying and referencing the specific market segment covered.
12. How do I determine which pricing option suits my needs best?
The pricing options vary based on user requirements and access needs. Individual users may opt for single-user licenses, while businesses requiring broader access may choose multi-user or enterprise licenses for cost-effective access to the report.
13. Are there any additional resources or data provided in the Crop Protection Industry report?
While the report offers comprehensive insights, it's advisable to review the specific contents or supplementary materials provided to ascertain if additional resources or data are available.
14. How can I stay updated on further developments or reports in the Crop Protection Industry?
To stay informed about further developments, trends, and reports in the Crop Protection Industry, consider subscribing to industry newsletters, following relevant companies and organizations, or regularly checking reputable industry news sources and publications.
Methodology
Step 1 - Identification of Relevant Samples Size from Population Database


Step 2 - Approaches for Defining Global Market Size (Value, Volume* & Price*)

Note*: In applicable scenarios
Step 3 - Data Sources
Primary Research
- Web Analytics
- Survey Reports
- Research Institute
- Latest Research Reports
- Opinion Leaders
Secondary Research
- Annual Reports
- White Paper
- Latest Press Release
- Industry Association
- Paid Database
- Investor Presentations

Step 4 - Data Triangulation
Involves using different sources of information in order to increase the validity of a study
These sources are likely to be stakeholders in a program - participants, other researchers, program staff, other community members, and so on.
Then we put all data in single framework & apply various statistical tools to find out the dynamic on the market.
During the analysis stage, feedback from the stakeholder groups would be compared to determine areas of agreement as well as areas of divergence