

Key Insights
The global crop sprayers market, valued at approximately $XX million in 2025, is projected to experience robust growth, driven by several key factors. The increasing global population necessitates higher agricultural output, fueling demand for efficient crop protection solutions. Simultaneously, the growing prevalence of crop diseases and pests necessitates more frequent and targeted spraying, boosting market expansion. Technological advancements in sprayer design, such as the incorporation of precision spraying technologies (GPS-guided application, variable rate technology) and the rise of battery-operated and solar sprayers, contribute to increased efficiency and reduced environmental impact. This shift towards sustainable agriculture is a significant market driver, encouraging adoption of environmentally friendly sprayers. Furthermore, the rising adoption of precision farming techniques and the growing awareness among farmers regarding the benefits of efficient crop protection are bolstering market growth. However, challenges remain, including the high initial investment costs associated with advanced sprayers and the potential for regulatory hurdles related to pesticide usage.
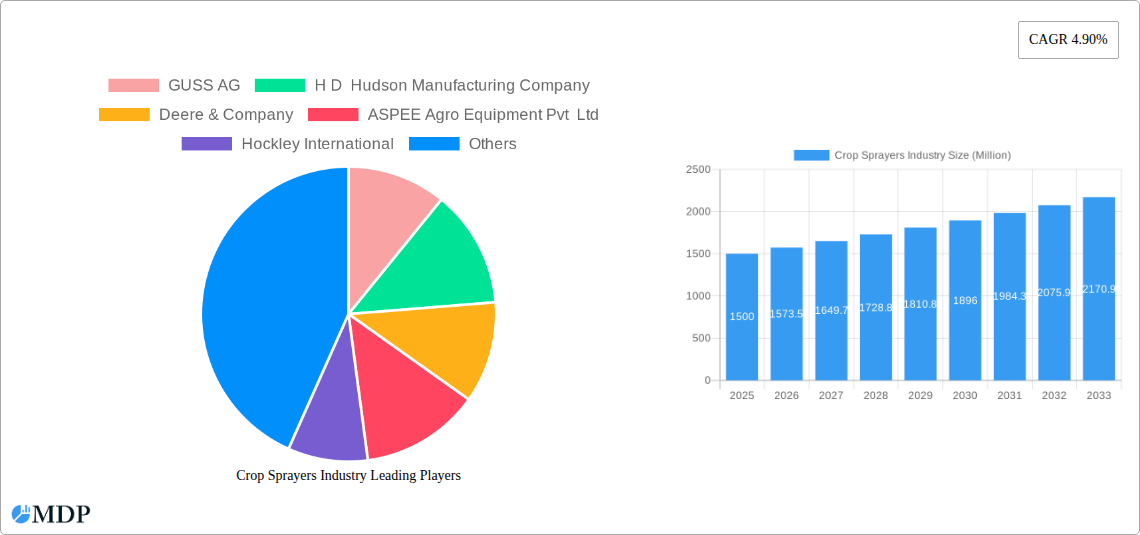
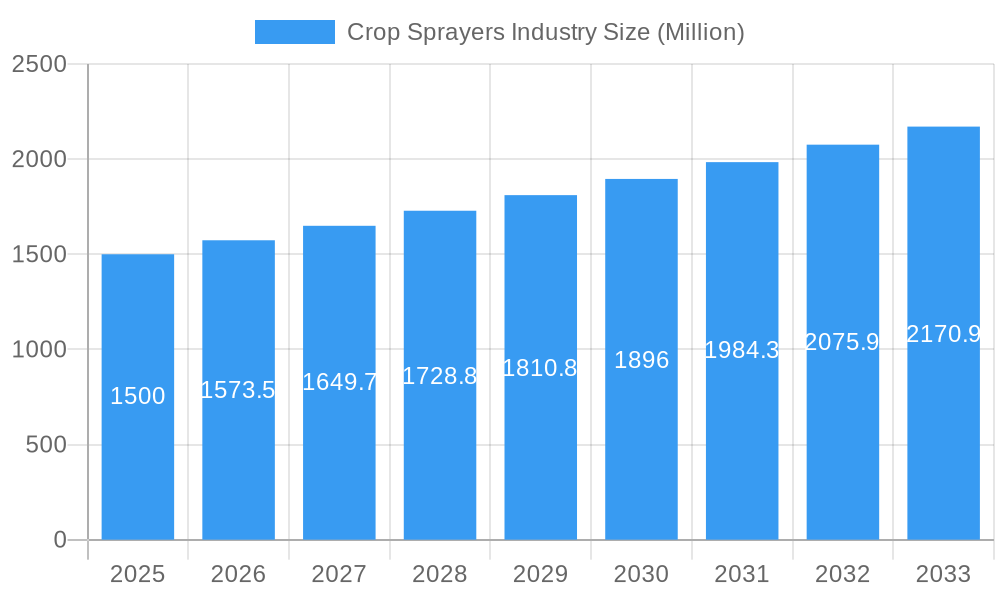
Crop Sprayers Industry Market Size (In Billion)
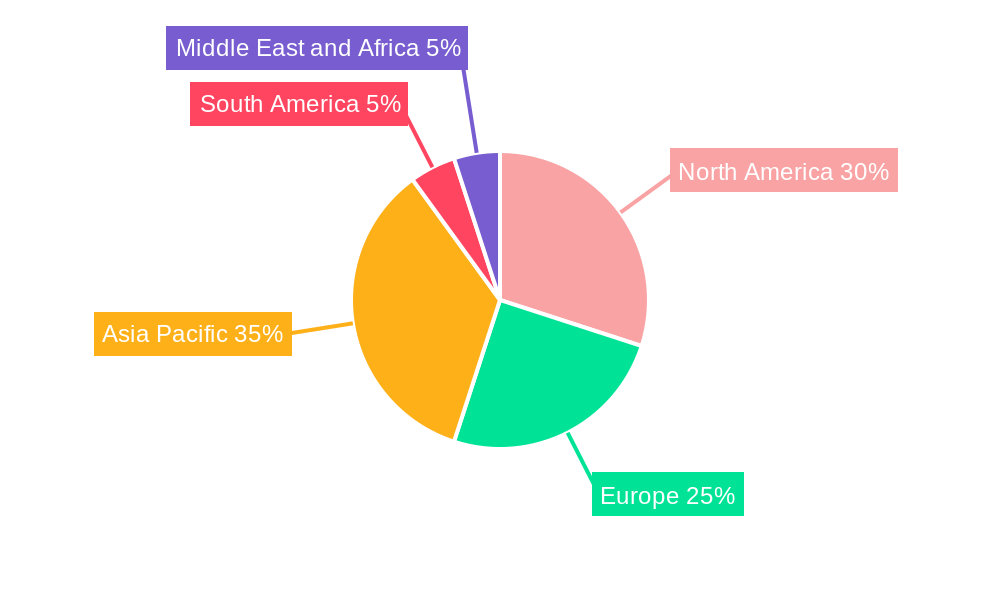
Market segmentation reveals a diverse landscape. Fuel-operated sprayers currently dominate, but battery-operated and solar sprayers are gaining traction due to their environmental benefits and reduced reliance on fossil fuels. In terms of usage, field sprayers constitute the largest segment, given the extensive acreage dedicated to field crops. Orchard and gardening sprayers cater to specialized needs, driving niche market growth. Geographically, North America and Europe hold significant market shares, driven by established agricultural practices and high adoption rates of advanced technologies. However, the Asia-Pacific region is expected to witness substantial growth in the forecast period (2025-2033), due to expanding agricultural activities and rising farmer incomes in developing economies like India and China. The projected CAGR of 4.90% indicates a steady and promising outlook for the crop sprayers market over the coming years.
Crop Sprayers Industry Company Market Share
Crop Sprayers Industry Report: 2019-2033
This comprehensive report provides an in-depth analysis of the global crop sprayers industry, covering market dynamics, leading players, technological advancements, and future growth prospects. The study period spans from 2019 to 2033, with 2025 serving as both the base and estimated year. The report offers actionable insights for industry stakeholders, investors, and businesses operating within this dynamic sector. The global market size is estimated at xx Million in 2025 and is projected to reach xx Million by 2033.
Crop Sprayers Industry Market Dynamics & Concentration
The global crop sprayers market exhibits a moderately concentrated landscape, with several key players holding significant market share. Market concentration is influenced by factors such as technological innovation, mergers and acquisitions (M&A) activity, and stringent regulatory frameworks. The industry witnesses continuous innovation, driven by the need for higher efficiency, precision, and sustainability. Regulatory changes concerning pesticide usage and environmental protection significantly impact market dynamics. Product substitutes, such as biological pest control methods, pose a competitive threat, albeit a limited one at present. End-user trends, such as the increasing adoption of precision agriculture techniques, are driving demand for advanced crop sprayers.
- Market Share: The top five players hold an estimated xx% of the global market share in 2025.
- M&A Activity: The number of M&A deals in the crop sprayers industry averaged approximately xx per year during the historical period (2019-2024), driven by companies seeking to expand their product portfolios and geographic reach.
- Innovation Drivers: Precision agriculture, automation, and sustainable technologies are major drivers of innovation.
- Regulatory Frameworks: Stringent environmental regulations regarding pesticide usage and safety standards influence product development and adoption.
- Product Substitutes: Biological pest control methods and other sustainable alternatives are emerging, although they currently pose a minor competitive threat.
- End-User Trends: Increasing adoption of precision agriculture and demand for higher efficiency and labor savings are key market drivers.
Crop Sprayers Industry Industry Trends & Analysis
The crop sprayers industry is characterized by robust growth, driven by several factors. The global market is experiencing a Compound Annual Growth Rate (CAGR) of xx% during the forecast period (2025-2033). This growth is fueled by the rising global population, increasing demand for food, and the escalating need for efficient and effective pest and disease management in agriculture. Technological advancements, such as the integration of GPS, sensors, and automation, are revolutionizing crop spraying, enhancing precision and reducing chemical usage. Consumer preferences are shifting towards sustainable and environmentally friendly spraying solutions. Competitive dynamics are shaping the market, with leading players investing heavily in R&D and strategic partnerships. Market penetration of advanced technologies like drone-based spraying is steadily increasing, representing a significant shift from traditional methods.
Leading Markets & Segments in Crop Sprayers Industry
The North American and European regions dominate the global crop sprayers market, driven by factors such as advanced agricultural practices, high technological adoption, and substantial investments in the agricultural sector. Within the product segments, fuel-operated sprayers maintain the largest market share, followed by battery-operated and manual sprayers. The field sprayers segment holds a dominant position in terms of usage, followed by orchard and gardening sprayers.
- Dominant Region: North America and Europe
- Key Drivers (North America & Europe):
- Well-established agricultural infrastructure.
- High adoption of advanced technologies.
- Favorable government policies and subsidies.
- Strong demand for efficient and precise spraying solutions.
- Dominant Segment (Source of Power): Fuel-operated sprayers.
- Dominant Segment (Usage): Field sprayers.
- Key Drivers (Fuel-operated): High capacity and suitability for large-scale operations.
- Key Drivers (Field Sprayers): Large-scale agricultural operations and high demand.
Crop Sprayers Industry Product Developments
Recent years have witnessed significant advancements in crop sprayer technology, including the integration of precision spraying systems, automated boom control, and GPS guidance. These innovations enhance spraying accuracy, reduce chemical usage, and optimize resource management. The market is also witnessing a rising trend towards drone-based spraying systems, offering increased efficiency and reach in challenging terrains. The integration of data analytics and AI is further enhancing the capabilities of crop sprayers, enabling predictive maintenance, optimized spraying schedules, and improved yield management. These developments cater to the increasing demand for sustainable and precise agricultural practices.
Key Drivers of Crop Sprayers Industry Growth
Several factors are driving the growth of the crop sprayers industry. Technological advancements, including automation and precision spraying technologies, are significantly enhancing efficiency and reducing input costs. The rising global population and increasing food demand are bolstering the need for higher agricultural productivity. Favorable government policies and subsidies aimed at promoting agricultural modernization are also playing a crucial role. Furthermore, increasing awareness regarding sustainable agricultural practices is contributing to the adoption of environmentally friendly crop spraying technologies.
Challenges in the Crop Sprayers Industry Market
The crop sprayers industry faces several challenges. Stricter environmental regulations on pesticide usage impose constraints on product development and application. Supply chain disruptions and volatile raw material prices can affect production costs and profitability. Intense competition from established and emerging players can put pressure on pricing and margins. Fluctuating fuel prices, especially for fuel-operated sprayers, directly impact operational costs. These factors need to be considered for effective market strategy.
Emerging Opportunities in Crop Sprayers Industry
The crop sprayers industry presents several promising opportunities for future growth. Technological advancements such as AI-powered spraying systems, autonomous operation, and drone-based applications hold immense potential for market expansion. Strategic partnerships and collaborations between manufacturers, technology providers, and agricultural businesses can lead to innovative solutions. Expansion into emerging markets with growing agricultural sectors offers significant growth opportunities. Furthermore, a focus on sustainability and environmentally friendly solutions will attract environmentally conscious consumers and drive market penetration.
Leading Players in the Crop Sprayers Industry Sector
- GUSS AG
- H D Hudson Manufacturing Company
- Deere & Company
- ASPE E Agro Equipment Pvt Ltd
- Hockley International
- DJI
- Kubota Corporation
- Mahindra & Mahindra Ltd
- Jacto Inc
- GVM Inc
- AGCO Corporation
Key Milestones in Crop Sprayers Industry Industry
- July 2022: Kubota launched a new range of high-value crop sprayers (XTA21, XTA22, XTA24, XTA31, XTA33, and XTA63), expanding its product portfolio and addressing the growing demand for orchard spraying solutions.
- October 2022: DJI launched the AGRAS T40, a drone sprayer with a Coaxial Twin Rotor design, enhancing payload capacity and efficiency. This launch signaled the growing significance of drone technology in the crop spraying sector.
- November 2022: DJI released the T50, T25, and Mavic 3 Multispectral drones, featuring advanced features such as active phased array radars and dual atomization spraying systems, further enhancing precision and efficiency in aerial crop spraying.
- November 2022: John Deere announced the upcoming launch of C&Spray technology in Europe, showcasing advancements in precision spraying through weed identification and targeted treatment using camera technology.
Strategic Outlook for Crop Sprayers Industry Market
The crop sprayers industry is poised for significant growth driven by technological advancements, increasing demand for efficient and sustainable solutions, and expansion into emerging markets. Strategic partnerships and collaborations are likely to become more prevalent, driving innovation and market consolidation. Companies focusing on precision agriculture, automation, and data-driven technologies will hold a competitive advantage. The market will continue to see the adoption of drone technology and AI-powered solutions, offering improved efficiency and reduced environmental impact. Companies that can effectively adapt to evolving regulations and consumer preferences while leveraging technological advancements will be best positioned for long-term success.
Crop Sprayers Industry Segmentation
- 1. Production Analysis
- 2. Consumption Analysis
- 3. Import Market Analysis (Value & Volume)
- 4. Export Market Analysis (Value & Volume)
- 5. Price Trend Analysis
Crop Sprayers Industry Segmentation By Geography
-
1. North America
- 1.1. United States
- 1.2. Canada
- 1.3. Mexico
-
2. South America
- 2.1. Brazil
- 2.2. Argentina
- 2.3. Rest of South America
-
3. Europe
- 3.1. United Kingdom
- 3.2. Germany
- 3.3. France
- 3.4. Italy
- 3.5. Spain
- 3.6. Russia
- 3.7. Benelux
- 3.8. Nordics
- 3.9. Rest of Europe
-
4. Middle East & Africa
- 4.1. Turkey
- 4.2. Israel
- 4.3. GCC
- 4.4. North Africa
- 4.5. South Africa
- 4.6. Rest of Middle East & Africa
-
5. Asia Pacific
- 5.1. China
- 5.2. India
- 5.3. Japan
- 5.4. South Korea
- 5.5. ASEAN
- 5.6. Oceania
- 5.7. Rest of Asia Pacific
Crop Sprayers Industry Regional Market Share
Geographic Coverage of Crop Sprayers Industry
Crop Sprayers Industry REPORT HIGHLIGHTS
| Aspects | Details |
|---|---|
| Study Period | 2020-2034 |
| Base Year | 2025 |
| Estimated Year | 2026 |
| Forecast Period | 2026-2034 |
| Historical Period | 2020-2025 |
| Growth Rate | CAGR of 3.5% from 2020-2034 |
| Segmentation |
|
Table of Contents
- 1. Introduction
- 1.1. Research Scope
- 1.2. Market Segmentation
- 1.3. Research Objective
- 1.4. Definitions and Assumptions
- 2. Executive Summary
- 2.1. Market Snapshot
- 3. Market Dynamics
- 3.1. Market Drivers
- 3.2. Market Restrains
- 3.3. Market Trends
- 3.4. Market Opportunities
- 4. Market Factor Analysis
- 4.1. Porters Five Forces
- 4.1.1. Bargaining Power of Suppliers
- 4.1.2. Bargaining Power of Buyers
- 4.1.3. Threat of New Entrants
- 4.1.4. Threat of Substitutes
- 4.1.5. Competitive Rivalry
- 4.2. PESTEL analysis
- 4.3. BCG Analysis
- 4.3.1. Stars (High Growth, High Market Share)
- 4.3.2. Cash Cows (Low Growth, High Market Share)
- 4.3.3. Question Mark (High Growth, Low Market Share)
- 4.3.4. Dogs (Low Growth, Low Market Share)
- 4.4. Ansoff Matrix Analysis
- 4.5. Supply Chain Analysis
- 4.6. Regulatory Landscape
- 4.7. Current Market Potential and Opportunity Assessment (TAM–SAM–SOM Framework)
- 4.8. MDP Analyst Note
- 4.1. Porters Five Forces
- 5. Market Analysis, Insights and Forecast 2021-2033
- 5.1. Market Analysis, Insights and Forecast - by Production Analysis
- 5.2. Market Analysis, Insights and Forecast - by Consumption Analysis
- 5.3. Market Analysis, Insights and Forecast - by Import Market Analysis (Value & Volume)
- 5.4. Market Analysis, Insights and Forecast - by Export Market Analysis (Value & Volume)
- 5.5. Market Analysis, Insights and Forecast - by Price Trend Analysis
- 5.6. Market Analysis, Insights and Forecast - by Region
- 5.6.1. North America
- 5.6.2. South America
- 5.6.3. Europe
- 5.6.4. Middle East & Africa
- 5.6.5. Asia Pacific
- 6. Global Crop Sprayers Industry Analysis, Insights and Forecast, 2021-2033
- 6.1. Market Analysis, Insights and Forecast - by Production Analysis
- 6.2. Market Analysis, Insights and Forecast - by Consumption Analysis
- 6.3. Market Analysis, Insights and Forecast - by Import Market Analysis (Value & Volume)
- 6.4. Market Analysis, Insights and Forecast - by Export Market Analysis (Value & Volume)
- 6.5. Market Analysis, Insights and Forecast - by Price Trend Analysis
- 7. North America Crop Sprayers Industry Analysis, Insights and Forecast, 2020-2032
- 7.1. Market Analysis, Insights and Forecast - by Production Analysis
- 7.2. Market Analysis, Insights and Forecast - by Consumption Analysis
- 7.3. Market Analysis, Insights and Forecast - by Import Market Analysis (Value & Volume)
- 7.4. Market Analysis, Insights and Forecast - by Export Market Analysis (Value & Volume)
- 7.5. Market Analysis, Insights and Forecast - by Price Trend Analysis
- 8. South America Crop Sprayers Industry Analysis, Insights and Forecast, 2020-2032
- 8.1. Market Analysis, Insights and Forecast - by Production Analysis
- 8.2. Market Analysis, Insights and Forecast - by Consumption Analysis
- 8.3. Market Analysis, Insights and Forecast - by Import Market Analysis (Value & Volume)
- 8.4. Market Analysis, Insights and Forecast - by Export Market Analysis (Value & Volume)
- 8.5. Market Analysis, Insights and Forecast - by Price Trend Analysis
- 9. Europe Crop Sprayers Industry Analysis, Insights and Forecast, 2020-2032
- 9.1. Market Analysis, Insights and Forecast - by Production Analysis
- 9.2. Market Analysis, Insights and Forecast - by Consumption Analysis
- 9.3. Market Analysis, Insights and Forecast - by Import Market Analysis (Value & Volume)
- 9.4. Market Analysis, Insights and Forecast - by Export Market Analysis (Value & Volume)
- 9.5. Market Analysis, Insights and Forecast - by Price Trend Analysis
- 10. Middle East & Africa Crop Sprayers Industry Analysis, Insights and Forecast, 2020-2032
- 10.1. Market Analysis, Insights and Forecast - by Production Analysis
- 10.2. Market Analysis, Insights and Forecast - by Consumption Analysis
- 10.3. Market Analysis, Insights and Forecast - by Import Market Analysis (Value & Volume)
- 10.4. Market Analysis, Insights and Forecast - by Export Market Analysis (Value & Volume)
- 10.5. Market Analysis, Insights and Forecast - by Price Trend Analysis
- 11. Asia Pacific Crop Sprayers Industry Analysis, Insights and Forecast, 2020-2032
- 11.1. Market Analysis, Insights and Forecast - by Production Analysis
- 11.2. Market Analysis, Insights and Forecast - by Consumption Analysis
- 11.3. Market Analysis, Insights and Forecast - by Import Market Analysis (Value & Volume)
- 11.4. Market Analysis, Insights and Forecast - by Export Market Analysis (Value & Volume)
- 11.5. Market Analysis, Insights and Forecast - by Price Trend Analysis
- 12. Competitive Analysis
- 12.1. Company Profiles
- 12.1.1 GUSS AG
- 12.1.1.1. Company Overview
- 12.1.1.2. Products
- 12.1.1.3. Company Financials
- 12.1.1.4. SWOT Analysis
- 12.1.2 H D Hudson Manufacturing Company
- 12.1.2.1. Company Overview
- 12.1.2.2. Products
- 12.1.2.3. Company Financials
- 12.1.2.4. SWOT Analysis
- 12.1.3 Deere & Company
- 12.1.3.1. Company Overview
- 12.1.3.2. Products
- 12.1.3.3. Company Financials
- 12.1.3.4. SWOT Analysis
- 12.1.4 ASPEE Agro Equipment Pvt Ltd
- 12.1.4.1. Company Overview
- 12.1.4.2. Products
- 12.1.4.3. Company Financials
- 12.1.4.4. SWOT Analysis
- 12.1.5 Hockley International
- 12.1.5.1. Company Overview
- 12.1.5.2. Products
- 12.1.5.3. Company Financials
- 12.1.5.4. SWOT Analysis
- 12.1.6 DJ
- 12.1.6.1. Company Overview
- 12.1.6.2. Products
- 12.1.6.3. Company Financials
- 12.1.6.4. SWOT Analysis
- 12.1.7 Kubota Corporation
- 12.1.7.1. Company Overview
- 12.1.7.2. Products
- 12.1.7.3. Company Financials
- 12.1.7.4. SWOT Analysis
- 12.1.8 Mahindra & Mahindra Ltd
- 12.1.8.1. Company Overview
- 12.1.8.2. Products
- 12.1.8.3. Company Financials
- 12.1.8.4. SWOT Analysis
- 12.1.9 Jacto Inc
- 12.1.9.1. Company Overview
- 12.1.9.2. Products
- 12.1.9.3. Company Financials
- 12.1.9.4. SWOT Analysis
- 12.1.10 GVM Inc
- 12.1.10.1. Company Overview
- 12.1.10.2. Products
- 12.1.10.3. Company Financials
- 12.1.10.4. SWOT Analysis
- 12.1.11 AGCO Corporation
- 12.1.11.1. Company Overview
- 12.1.11.2. Products
- 12.1.11.3. Company Financials
- 12.1.11.4. SWOT Analysis
- 12.1.1 GUSS AG
- 12.2. Market Entropy
- 12.2.1 Company's Key Areas Served
- 12.2.2 Recent Developments
- 12.3. Company Market Share Analysis 2025
- 12.3.1 Top 5 Companies Market Share Analysis
- 12.3.2 Top 3 Companies Market Share Analysis
- 12.4. List of Potential Customers
- 13. Research Methodology
List of Figures
- Figure 1: Global Crop Sprayers Industry Revenue Breakdown (billion, %) by Region 2025 & 2033
- Figure 2: North America Crop Sprayers Industry Revenue (billion), by Production Analysis 2025 & 2033
- Figure 3: North America Crop Sprayers Industry Revenue Share (%), by Production Analysis 2025 & 2033
- Figure 4: North America Crop Sprayers Industry Revenue (billion), by Consumption Analysis 2025 & 2033
- Figure 5: North America Crop Sprayers Industry Revenue Share (%), by Consumption Analysis 2025 & 2033
- Figure 6: North America Crop Sprayers Industry Revenue (billion), by Import Market Analysis (Value & Volume) 2025 & 2033
- Figure 7: North America Crop Sprayers Industry Revenue Share (%), by Import Market Analysis (Value & Volume) 2025 & 2033
- Figure 8: North America Crop Sprayers Industry Revenue (billion), by Export Market Analysis (Value & Volume) 2025 & 2033
- Figure 9: North America Crop Sprayers Industry Revenue Share (%), by Export Market Analysis (Value & Volume) 2025 & 2033
- Figure 10: North America Crop Sprayers Industry Revenue (billion), by Price Trend Analysis 2025 & 2033
- Figure 11: North America Crop Sprayers Industry Revenue Share (%), by Price Trend Analysis 2025 & 2033
- Figure 12: North America Crop Sprayers Industry Revenue (billion), by Country 2025 & 2033
- Figure 13: North America Crop Sprayers Industry Revenue Share (%), by Country 2025 & 2033
- Figure 14: South America Crop Sprayers Industry Revenue (billion), by Production Analysis 2025 & 2033
- Figure 15: South America Crop Sprayers Industry Revenue Share (%), by Production Analysis 2025 & 2033
- Figure 16: South America Crop Sprayers Industry Revenue (billion), by Consumption Analysis 2025 & 2033
- Figure 17: South America Crop Sprayers Industry Revenue Share (%), by Consumption Analysis 2025 & 2033
- Figure 18: South America Crop Sprayers Industry Revenue (billion), by Import Market Analysis (Value & Volume) 2025 & 2033
- Figure 19: South America Crop Sprayers Industry Revenue Share (%), by Import Market Analysis (Value & Volume) 2025 & 2033
- Figure 20: South America Crop Sprayers Industry Revenue (billion), by Export Market Analysis (Value & Volume) 2025 & 2033
- Figure 21: South America Crop Sprayers Industry Revenue Share (%), by Export Market Analysis (Value & Volume) 2025 & 2033
- Figure 22: South America Crop Sprayers Industry Revenue (billion), by Price Trend Analysis 2025 & 2033
- Figure 23: South America Crop Sprayers Industry Revenue Share (%), by Price Trend Analysis 2025 & 2033
- Figure 24: South America Crop Sprayers Industry Revenue (billion), by Country 2025 & 2033
- Figure 25: South America Crop Sprayers Industry Revenue Share (%), by Country 2025 & 2033
- Figure 26: Europe Crop Sprayers Industry Revenue (billion), by Production Analysis 2025 & 2033
- Figure 27: Europe Crop Sprayers Industry Revenue Share (%), by Production Analysis 2025 & 2033
- Figure 28: Europe Crop Sprayers Industry Revenue (billion), by Consumption Analysis 2025 & 2033
- Figure 29: Europe Crop Sprayers Industry Revenue Share (%), by Consumption Analysis 2025 & 2033
- Figure 30: Europe Crop Sprayers Industry Revenue (billion), by Import Market Analysis (Value & Volume) 2025 & 2033
- Figure 31: Europe Crop Sprayers Industry Revenue Share (%), by Import Market Analysis (Value & Volume) 2025 & 2033
- Figure 32: Europe Crop Sprayers Industry Revenue (billion), by Export Market Analysis (Value & Volume) 2025 & 2033
- Figure 33: Europe Crop Sprayers Industry Revenue Share (%), by Export Market Analysis (Value & Volume) 2025 & 2033
- Figure 34: Europe Crop Sprayers Industry Revenue (billion), by Price Trend Analysis 2025 & 2033
- Figure 35: Europe Crop Sprayers Industry Revenue Share (%), by Price Trend Analysis 2025 & 2033
- Figure 36: Europe Crop Sprayers Industry Revenue (billion), by Country 2025 & 2033
- Figure 37: Europe Crop Sprayers Industry Revenue Share (%), by Country 2025 & 2033
- Figure 38: Middle East & Africa Crop Sprayers Industry Revenue (billion), by Production Analysis 2025 & 2033
- Figure 39: Middle East & Africa Crop Sprayers Industry Revenue Share (%), by Production Analysis 2025 & 2033
- Figure 40: Middle East & Africa Crop Sprayers Industry Revenue (billion), by Consumption Analysis 2025 & 2033
- Figure 41: Middle East & Africa Crop Sprayers Industry Revenue Share (%), by Consumption Analysis 2025 & 2033
- Figure 42: Middle East & Africa Crop Sprayers Industry Revenue (billion), by Import Market Analysis (Value & Volume) 2025 & 2033
- Figure 43: Middle East & Africa Crop Sprayers Industry Revenue Share (%), by Import Market Analysis (Value & Volume) 2025 & 2033
- Figure 44: Middle East & Africa Crop Sprayers Industry Revenue (billion), by Export Market Analysis (Value & Volume) 2025 & 2033
- Figure 45: Middle East & Africa Crop Sprayers Industry Revenue Share (%), by Export Market Analysis (Value & Volume) 2025 & 2033
- Figure 46: Middle East & Africa Crop Sprayers Industry Revenue (billion), by Price Trend Analysis 2025 & 2033
- Figure 47: Middle East & Africa Crop Sprayers Industry Revenue Share (%), by Price Trend Analysis 2025 & 2033
- Figure 48: Middle East & Africa Crop Sprayers Industry Revenue (billion), by Country 2025 & 2033
- Figure 49: Middle East & Africa Crop Sprayers Industry Revenue Share (%), by Country 2025 & 2033
- Figure 50: Asia Pacific Crop Sprayers Industry Revenue (billion), by Production Analysis 2025 & 2033
- Figure 51: Asia Pacific Crop Sprayers Industry Revenue Share (%), by Production Analysis 2025 & 2033
- Figure 52: Asia Pacific Crop Sprayers Industry Revenue (billion), by Consumption Analysis 2025 & 2033
- Figure 53: Asia Pacific Crop Sprayers Industry Revenue Share (%), by Consumption Analysis 2025 & 2033
- Figure 54: Asia Pacific Crop Sprayers Industry Revenue (billion), by Import Market Analysis (Value & Volume) 2025 & 2033
- Figure 55: Asia Pacific Crop Sprayers Industry Revenue Share (%), by Import Market Analysis (Value & Volume) 2025 & 2033
- Figure 56: Asia Pacific Crop Sprayers Industry Revenue (billion), by Export Market Analysis (Value & Volume) 2025 & 2033
- Figure 57: Asia Pacific Crop Sprayers Industry Revenue Share (%), by Export Market Analysis (Value & Volume) 2025 & 2033
- Figure 58: Asia Pacific Crop Sprayers Industry Revenue (billion), by Price Trend Analysis 2025 & 2033
- Figure 59: Asia Pacific Crop Sprayers Industry Revenue Share (%), by Price Trend Analysis 2025 & 2033
- Figure 60: Asia Pacific Crop Sprayers Industry Revenue (billion), by Country 2025 & 2033
- Figure 61: Asia Pacific Crop Sprayers Industry Revenue Share (%), by Country 2025 & 2033
List of Tables
- Table 1: Global Crop Sprayers Industry Revenue billion Forecast, by Production Analysis 2020 & 2033
- Table 2: Global Crop Sprayers Industry Revenue billion Forecast, by Consumption Analysis 2020 & 2033
- Table 3: Global Crop Sprayers Industry Revenue billion Forecast, by Import Market Analysis (Value & Volume) 2020 & 2033
- Table 4: Global Crop Sprayers Industry Revenue billion Forecast, by Export Market Analysis (Value & Volume) 2020 & 2033
- Table 5: Global Crop Sprayers Industry Revenue billion Forecast, by Price Trend Analysis 2020 & 2033
- Table 6: Global Crop Sprayers Industry Revenue billion Forecast, by Region 2020 & 2033
- Table 7: Global Crop Sprayers Industry Revenue billion Forecast, by Production Analysis 2020 & 2033
- Table 8: Global Crop Sprayers Industry Revenue billion Forecast, by Consumption Analysis 2020 & 2033
- Table 9: Global Crop Sprayers Industry Revenue billion Forecast, by Import Market Analysis (Value & Volume) 2020 & 2033
- Table 10: Global Crop Sprayers Industry Revenue billion Forecast, by Export Market Analysis (Value & Volume) 2020 & 2033
- Table 11: Global Crop Sprayers Industry Revenue billion Forecast, by Price Trend Analysis 2020 & 2033
- Table 12: Global Crop Sprayers Industry Revenue billion Forecast, by Country 2020 & 2033
- Table 13: United States Crop Sprayers Industry Revenue (billion) Forecast, by Application 2020 & 2033
- Table 14: Canada Crop Sprayers Industry Revenue (billion) Forecast, by Application 2020 & 2033
- Table 15: Mexico Crop Sprayers Industry Revenue (billion) Forecast, by Application 2020 & 2033
- Table 16: Global Crop Sprayers Industry Revenue billion Forecast, by Production Analysis 2020 & 2033
- Table 17: Global Crop Sprayers Industry Revenue billion Forecast, by Consumption Analysis 2020 & 2033
- Table 18: Global Crop Sprayers Industry Revenue billion Forecast, by Import Market Analysis (Value & Volume) 2020 & 2033
- Table 19: Global Crop Sprayers Industry Revenue billion Forecast, by Export Market Analysis (Value & Volume) 2020 & 2033
- Table 20: Global Crop Sprayers Industry Revenue billion Forecast, by Price Trend Analysis 2020 & 2033
- Table 21: Global Crop Sprayers Industry Revenue billion Forecast, by Country 2020 & 2033
- Table 22: Brazil Crop Sprayers Industry Revenue (billion) Forecast, by Application 2020 & 2033
- Table 23: Argentina Crop Sprayers Industry Revenue (billion) Forecast, by Application 2020 & 2033
- Table 24: Rest of South America Crop Sprayers Industry Revenue (billion) Forecast, by Application 2020 & 2033
- Table 25: Global Crop Sprayers Industry Revenue billion Forecast, by Production Analysis 2020 & 2033
- Table 26: Global Crop Sprayers Industry Revenue billion Forecast, by Consumption Analysis 2020 & 2033
- Table 27: Global Crop Sprayers Industry Revenue billion Forecast, by Import Market Analysis (Value & Volume) 2020 & 2033
- Table 28: Global Crop Sprayers Industry Revenue billion Forecast, by Export Market Analysis (Value & Volume) 2020 & 2033
- Table 29: Global Crop Sprayers Industry Revenue billion Forecast, by Price Trend Analysis 2020 & 2033
- Table 30: Global Crop Sprayers Industry Revenue billion Forecast, by Country 2020 & 2033
- Table 31: United Kingdom Crop Sprayers Industry Revenue (billion) Forecast, by Application 2020 & 2033
- Table 32: Germany Crop Sprayers Industry Revenue (billion) Forecast, by Application 2020 & 2033
- Table 33: France Crop Sprayers Industry Revenue (billion) Forecast, by Application 2020 & 2033
- Table 34: Italy Crop Sprayers Industry Revenue (billion) Forecast, by Application 2020 & 2033
- Table 35: Spain Crop Sprayers Industry Revenue (billion) Forecast, by Application 2020 & 2033
- Table 36: Russia Crop Sprayers Industry Revenue (billion) Forecast, by Application 2020 & 2033
- Table 37: Benelux Crop Sprayers Industry Revenue (billion) Forecast, by Application 2020 & 2033
- Table 38: Nordics Crop Sprayers Industry Revenue (billion) Forecast, by Application 2020 & 2033
- Table 39: Rest of Europe Crop Sprayers Industry Revenue (billion) Forecast, by Application 2020 & 2033
- Table 40: Global Crop Sprayers Industry Revenue billion Forecast, by Production Analysis 2020 & 2033
- Table 41: Global Crop Sprayers Industry Revenue billion Forecast, by Consumption Analysis 2020 & 2033
- Table 42: Global Crop Sprayers Industry Revenue billion Forecast, by Import Market Analysis (Value & Volume) 2020 & 2033
- Table 43: Global Crop Sprayers Industry Revenue billion Forecast, by Export Market Analysis (Value & Volume) 2020 & 2033
- Table 44: Global Crop Sprayers Industry Revenue billion Forecast, by Price Trend Analysis 2020 & 2033
- Table 45: Global Crop Sprayers Industry Revenue billion Forecast, by Country 2020 & 2033
- Table 46: Turkey Crop Sprayers Industry Revenue (billion) Forecast, by Application 2020 & 2033
- Table 47: Israel Crop Sprayers Industry Revenue (billion) Forecast, by Application 2020 & 2033
- Table 48: GCC Crop Sprayers Industry Revenue (billion) Forecast, by Application 2020 & 2033
- Table 49: North Africa Crop Sprayers Industry Revenue (billion) Forecast, by Application 2020 & 2033
- Table 50: South Africa Crop Sprayers Industry Revenue (billion) Forecast, by Application 2020 & 2033
- Table 51: Rest of Middle East & Africa Crop Sprayers Industry Revenue (billion) Forecast, by Application 2020 & 2033
- Table 52: Global Crop Sprayers Industry Revenue billion Forecast, by Production Analysis 2020 & 2033
- Table 53: Global Crop Sprayers Industry Revenue billion Forecast, by Consumption Analysis 2020 & 2033
- Table 54: Global Crop Sprayers Industry Revenue billion Forecast, by Import Market Analysis (Value & Volume) 2020 & 2033
- Table 55: Global Crop Sprayers Industry Revenue billion Forecast, by Export Market Analysis (Value & Volume) 2020 & 2033
- Table 56: Global Crop Sprayers Industry Revenue billion Forecast, by Price Trend Analysis 2020 & 2033
- Table 57: Global Crop Sprayers Industry Revenue billion Forecast, by Country 2020 & 2033
- Table 58: China Crop Sprayers Industry Revenue (billion) Forecast, by Application 2020 & 2033
- Table 59: India Crop Sprayers Industry Revenue (billion) Forecast, by Application 2020 & 2033
- Table 60: Japan Crop Sprayers Industry Revenue (billion) Forecast, by Application 2020 & 2033
- Table 61: South Korea Crop Sprayers Industry Revenue (billion) Forecast, by Application 2020 & 2033
- Table 62: ASEAN Crop Sprayers Industry Revenue (billion) Forecast, by Application 2020 & 2033
- Table 63: Oceania Crop Sprayers Industry Revenue (billion) Forecast, by Application 2020 & 2033
- Table 64: Rest of Asia Pacific Crop Sprayers Industry Revenue (billion) Forecast, by Application 2020 & 2033
Frequently Asked Questions
1. What is the projected Compound Annual Growth Rate (CAGR) of the Crop Sprayers Industry?
The projected CAGR is approximately 3.5%.
2. Which companies are prominent players in the Crop Sprayers Industry?
Key companies in the market include GUSS AG, H D Hudson Manufacturing Company, Deere & Company, ASPEE Agro Equipment Pvt Ltd, Hockley International, DJ, Kubota Corporation, Mahindra & Mahindra Ltd, Jacto Inc, GVM Inc, AGCO Corporation.
3. What are the main segments of the Crop Sprayers Industry?
The market segments include Production Analysis, Consumption Analysis, Import Market Analysis (Value & Volume), Export Market Analysis (Value & Volume), Price Trend Analysis.
4. Can you provide details about the market size?
The market size is estimated to be USD 8.4 billion as of 2022.
5. What are some drivers contributing to market growth?
Low Availability of Skilled Labor; Technological Advancements.
6. What are the notable trends driving market growth?
Technological Developments in Spraying Equipment.
7. Are there any restraints impacting market growth?
Increasing Farm Expenditure; Security Concerns in Modern Farming Machinery.
8. Can you provide examples of recent developments in the market?
November 2022: John Deere announced the upcoming launch of C&Spray technology in Europe, which allows the identification of weeds and specific treatments. This system uses camera technology to detect color differences in the area. Cameras and other hardware components are built directly into the boom or machine frame.
9. What pricing options are available for accessing the report?
Pricing options include single-user, multi-user, and enterprise licenses priced at USD 4750, USD 5250, and USD 8750 respectively.
10. Is the market size provided in terms of value or volume?
The market size is provided in terms of value, measured in billion.
11. Are there any specific market keywords associated with the report?
Yes, the market keyword associated with the report is "Crop Sprayers Industry," which aids in identifying and referencing the specific market segment covered.
12. How do I determine which pricing option suits my needs best?
The pricing options vary based on user requirements and access needs. Individual users may opt for single-user licenses, while businesses requiring broader access may choose multi-user or enterprise licenses for cost-effective access to the report.
13. Are there any additional resources or data provided in the Crop Sprayers Industry report?
While the report offers comprehensive insights, it's advisable to review the specific contents or supplementary materials provided to ascertain if additional resources or data are available.
14. How can I stay updated on further developments or reports in the Crop Sprayers Industry?
To stay informed about further developments, trends, and reports in the Crop Sprayers Industry, consider subscribing to industry newsletters, following relevant companies and organizations, or regularly checking reputable industry news sources and publications.
Methodology
Step 1 - Identification of Relevant Samples Size from Population Database


Step 2 - Approaches for Defining Global Market Size (Value, Volume* & Price*)

Note*: In applicable scenarios
Step 3 - Data Sources
Primary Research
- Web Analytics
- Survey Reports
- Research Institute
- Latest Research Reports
- Opinion Leaders
Secondary Research
- Annual Reports
- White Paper
- Latest Press Release
- Industry Association
- Paid Database
- Investor Presentations

Step 4 - Data Triangulation
Involves using different sources of information in order to increase the validity of a study
These sources are likely to be stakeholders in a program - participants, other researchers, program staff, other community members, and so on.
Then we put all data in single framework & apply various statistical tools to find out the dynamic on the market.
During the analysis stage, feedback from the stakeholder groups would be compared to determine areas of agreement as well as areas of divergence