

Key Insights
The global Dried Figs market is projected to achieve a market size of $1.45 billion by 2025, driven by a Compound Annual Growth Rate (CAGR) of 5.1% through 2033. This expansion is fueled by increasing consumer demand for natural, healthy, and convenient food alternatives. Dried figs, rich in fiber, potassium, and magnesium, align with health-conscious trends and offer culinary versatility in various food applications. Advancements in drying and packaging technologies enhance shelf life and product appeal, while growing awareness of health benefits, amplified by online influencers, stimulates market penetration.
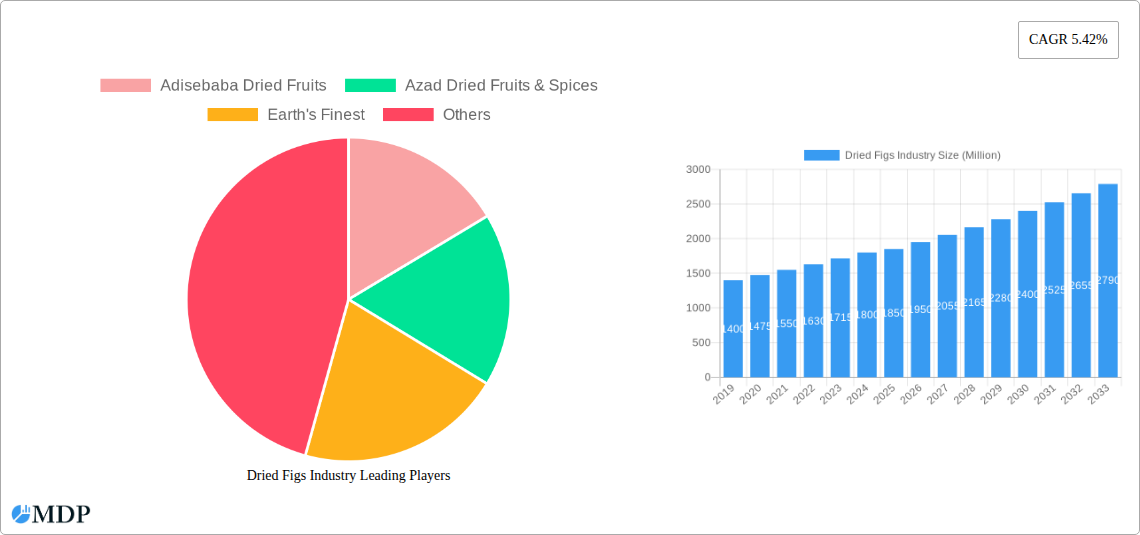
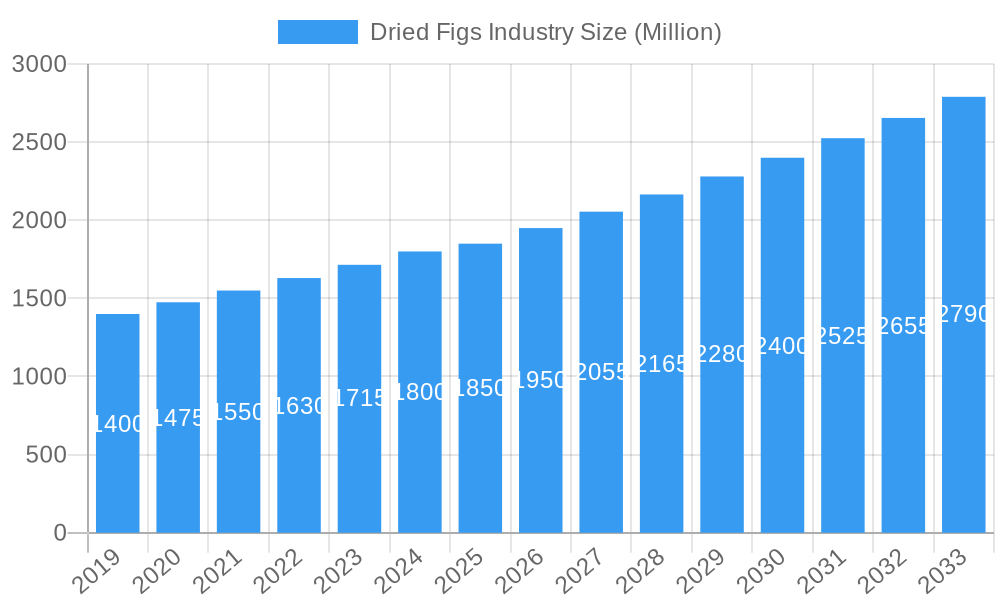
Dried Figs Industry Market Size (In Billion)
While production and consumption trends indicate strong growth, potential challenges include agricultural yield fluctuations due to weather and price volatility from supply-demand imbalances. Nevertheless, opportunities abound. The competitive landscape features key players like Adisebaba Dried Fruits and Azad Dried Fruits & Spices, focusing on quality control and traceability. Consumption analysis highlights a preference for premium, organic, and varietal dried figs. Import and export data reveal significant trade flows, with Asia Pacific emerging as a major consumption hub, complementing steady demand in Europe and North America. Pricing trends are expected to reflect a premium for high-quality, sustainably sourced dried figs, encouraging investment in advanced cultivation and processing.
Dried Figs Industry Company Market Share
This comprehensive report offers critical insights into the global Dried Figs Industry, covering market dynamics, growth drivers, and future opportunities from 2019 to 2033. With a base year of 2025, the report utilizes historical data (2019–2024) for accurate projections and analyzes dried fig production, consumption, international trade, and pricing trends to provide actionable intelligence for businesses.
Dried Figs Industry Market Dynamics & Concentration
The global Dried Figs Industry is characterized by moderate to high market concentration, with a significant portion of production and trade dominated by a few key players. Innovation drivers are primarily focused on value-added products, organic certifications, and functional food ingredients, catering to growing consumer demand for healthier snack options. Regulatory frameworks, particularly concerning food safety, import/export regulations, and organic standards, play a crucial role in market access and compliance. Product substitutes, such as other dried fruits like dates, apricots, and raisins, pose a competitive threat, necessitating differentiation through quality, origin, and unique product offerings. End-user trends point towards increased consumption in the health and wellness sector, confectionery, and bakery industries. Merger and acquisition (M&A) activities, while not as prevalent as in some other food sectors, are observed as companies seek to expand their product portfolios, market reach, and supply chain control. For instance, an estimated 5 M&A deals were recorded in the broader dried fruit industry in the last two years, indicating consolidation potential. The market share of leading dried fig producers can range from 10% to 25% depending on specific regional markets.
Dried Figs Industry Industry Trends & Analysis
The Dried Figs Industry is experiencing robust growth driven by an increasing global demand for natural, healthy, and convenient food products. The market penetration of dried figs is steadily rising, fueled by their rich nutritional profile, including fiber, minerals, and antioxidants. Consumers are increasingly seeking functional foods, leading to a surge in demand for organic, gluten-free, and sustainably sourced dried figs. Technological disruptions are primarily focused on improving processing techniques, extending shelf life, and enhancing product quality. Innovations in packaging are also playing a vital role, with a move towards more sustainable and resealable options to maintain freshness and convenience. The CAGR for the dried fig market is projected to be approximately 5.5% over the forecast period. Competitive dynamics are evolving, with established players focusing on expanding their geographical footprint and investing in branding, while new entrants are differentiating through niche products and online sales channels. The rising disposable incomes in emerging economies are also contributing to market expansion, as consumers have greater purchasing power for premium food items like dried figs. The global dried fig market size is estimated to be around $3,500 Million in 2025.
Leading Markets & Segments in Dried Figs Industry
Dominant Region & Country Analysis: The Mediterranean region, particularly Turkey, continues to be a dominant force in the global Dried Figs Industry, boasting significant production volumes and export capabilities. Other key producing countries include Greece, Iran, and the United States. This dominance is attributed to favorable climatic conditions, established cultivation practices, and extensive experience in processing and exporting.
Production Analysis:
- Key Drivers: Favorable climate and soil conditions, traditional farming expertise, government support for agricultural exports, and investment in modern processing facilities. Turkey alone accounts for an estimated 60% of global dried fig production, valued at approximately $1,800 Million.
Consumption Analysis:
- Key Drivers: Growing health consciousness among consumers, increasing popularity of plant-based diets, demand for natural sweeteners, and the use of dried figs in culinary applications (baking, confectionery, snacks). Europe and North America represent the largest consumption markets, with an estimated market size of $1,500 Million.
Import Market Analysis (Value & Volume):
- Key Drivers: Demand from countries with limited domestic production, preference for specific varieties, and the need for year-round availability. Germany, the UK, and the USA are leading importers, with import volumes estimated at 200,000 Metric Tons annually. The import market value is projected to reach $700 Million by 2025.
Export Market Analysis (Value & Volume):
- Key Drivers: High-quality production, competitive pricing, established trade relationships, and efficient logistics. Turkey remains the largest exporter, with export volumes anticipated to reach 250,000 Metric Tons, valued at $850 Million.
Price Trend Analysis:
- Key Drivers: Supply-demand balance, weather conditions affecting harvest yields, input costs (labor, energy), currency fluctuations, and quality variations. Prices are expected to see a moderate annual increase of 3-4% due to rising input costs and sustained demand. The estimated average price per kilogram is $3.50.
Dried Figs Industry Product Developments
Recent product developments in the Dried Figs Industry are increasingly focused on convenience and enhanced nutritional profiles. Innovations include the incorporation of dried figs into ready-to-eat snack bars, trail mixes, and breakfast cereals, catering to on-the-go consumption. The trend towards functional foods is driving the development of products fortified with probiotics and prebiotics, as exemplified by the introduction of "functional fruit" ranges featuring dried figs. Competitive advantages are being gained through organic certifications, sustainable sourcing practices, and the creation of unique flavor combinations that appeal to health-conscious consumers. These advancements aim to broaden the appeal of dried figs beyond traditional uses.
Key Drivers of Dried Figs Industry Growth
The global Dried Figs Industry is propelled by several key growth drivers. Firstly, the escalating consumer preference for healthy and natural food products significantly boosts demand. Secondly, the versatility of dried figs in culinary applications, from baking to savory dishes, expands their market reach. Thirdly, advancements in processing and preservation technologies ensure better quality and extended shelf life, making them more accessible globally. Finally, the increasing awareness of the health benefits associated with dried fig consumption, including their high fiber content and nutrient density, acts as a crucial catalyst for market expansion. The rising disposable incomes in developing economies also contribute to increased accessibility and demand for such premium food items.
Challenges in the Dried Figs Industry Market
Despite its growth potential, the Dried Figs Industry faces several challenges. Regulatory hurdles, including varying import standards and certifications across different countries, can impede market access. Supply chain disruptions, exacerbated by climate change affecting harvests and logistical complexities, pose a significant risk to consistent availability and pricing. Price volatility due to unpredictable yields and fluctuating input costs can impact profitability. Furthermore, intense competition from other dried fruits and snack alternatives requires continuous innovation and marketing efforts to maintain market share. The perishability of fresh figs and the need for controlled drying and storage also present logistical challenges.
Emerging Opportunities in Dried Figs Industry
Emerging opportunities in the Dried Figs Industry lie in tapping into the growing functional food market, with a focus on fortified and probiotic-enriched dried fig products. Strategic partnerships with health and wellness brands, as well as the food service industry, can unlock new distribution channels. Technological breakthroughs in sustainable farming and processing methods can enhance efficiency and reduce environmental impact, appealing to eco-conscious consumers. Furthermore, market expansion into untapped geographical regions, particularly in Asia and Africa, presents significant long-term growth potential. The development of innovative packaging solutions that enhance shelf life and convenience will also drive market penetration.
Leading Players in the Dried Figs Industry Sector
- Adisebaba Dried Fruits
- Azad Dried Fruits & Spices
- Earth's Finest
- King Arthur Baking Company
- Sun Maid Growers of California
- Valley Fig Growers
- Nature's Eats
- Sincerely Nuts
- Made in Nature
- Trader Joe's
Key Milestones in Dried Figs Industry Industry
- June 2023: At THAIFEX - Anuga Asia 2023, Turkey-based organic snacks brand Sunny Fruit introduced its latest "functional fruit" range, including Prebiotic Organic Dried Apricots, Prebiotic Organic Dried Figs, and Organic Fig & Walnut Balls with Added Probiotics and Prebiotics, highlighting innovation in health-focused offerings.
- February 2023: In India, the Karnataka state government implemented a district import action plan for all agricultural products, including figs. The Visvesvarya Trade Promotion Center (VTPC) drew this plan district-wise to capture potential, present status, and future prospects in domestic and international markets, indicating a strategic push for agricultural trade development.
Strategic Outlook for Dried Figs Industry Market
The strategic outlook for the Dried Figs Industry is positive, driven by sustained consumer demand for natural and healthy food options. Growth accelerators include continued innovation in product development, particularly in the functional and organic segments, and the expansion of distribution networks into emerging markets. Companies are advised to focus on building resilient supply chains, investing in sustainable practices, and leveraging digital platforms for direct-to-consumer sales. The increasing awareness of dried figs' nutritional benefits and their versatility in various culinary applications will continue to fuel market expansion, presenting significant opportunities for growth and profitability for stakeholders willing to adapt to evolving consumer preferences and market dynamics. The market is poised for steady growth, with an estimated market size of $4,500 Million by 2033.
Dried Figs Industry Segmentation
- 1. Production Analysis
- 2. Consumption Analysis
- 3. Import Market Analysis (Value & Volume)
- 4. Export Market Analysis (Value & Volume)
- 5. Price Trend Analysis
Dried Figs Industry Segmentation By Geography
-
1. North America
- 1.1. United States
- 1.2. Canada
- 1.3. Mexico
-
2. Europe
- 2.1. France
- 2.2. Germany
- 2.3. Russian Federation
- 2.4. United Kingdom
- 2.5. Italy
- 2.6. Switzerland
- 2.7. Greece
-
3. Asia Pacific
- 3.1. India
- 3.2. China
- 3.3. Australia
-
4. Middle East
- 4.1. Iran
- 4.2. United Arab Emirates
- 4.3. Saudi Arabia
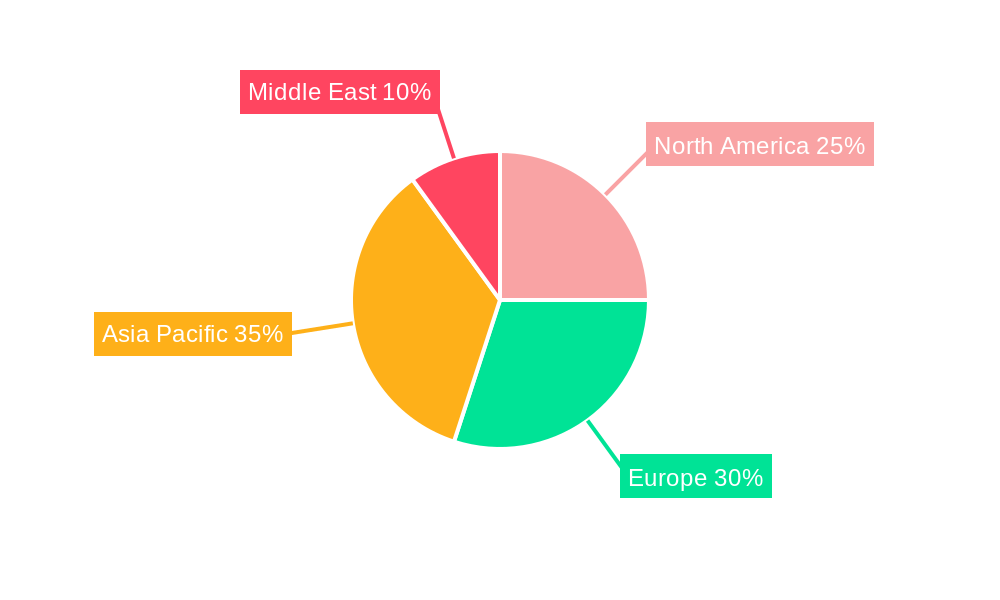
Dried Figs Industry Regional Market Share
Geographic Coverage of Dried Figs Industry
Dried Figs Industry REPORT HIGHLIGHTS
| Aspects | Details |
|---|---|
| Study Period | 2020-2034 |
| Base Year | 2025 |
| Estimated Year | 2026 |
| Forecast Period | 2026-2034 |
| Historical Period | 2020-2025 |
| Growth Rate | CAGR of 5.1% from 2020-2034 |
| Segmentation |
|
Table of Contents
- 1. Introduction
- 1.1. Research Scope
- 1.2. Market Segmentation
- 1.3. Research Objective
- 1.4. Definitions and Assumptions
- 2. Executive Summary
- 2.1. Market Snapshot
- 3. Market Dynamics
- 3.1. Market Drivers
- 3.2. Market Restrains
- 3.3. Market Trends
- 3.4. Market Opportunities
- 4. Market Factor Analysis
- 4.1. Porters Five Forces
- 4.1.1. Bargaining Power of Suppliers
- 4.1.2. Bargaining Power of Buyers
- 4.1.3. Threat of New Entrants
- 4.1.4. Threat of Substitutes
- 4.1.5. Competitive Rivalry
- 4.2. PESTEL analysis
- 4.3. BCG Analysis
- 4.3.1. Stars (High Growth, High Market Share)
- 4.3.2. Cash Cows (Low Growth, High Market Share)
- 4.3.3. Question Mark (High Growth, Low Market Share)
- 4.3.4. Dogs (Low Growth, Low Market Share)
- 4.4. Ansoff Matrix Analysis
- 4.5. Supply Chain Analysis
- 4.6. Regulatory Landscape
- 4.7. Current Market Potential and Opportunity Assessment (TAM–SAM–SOM Framework)
- 4.8. MDP Analyst Note
- 4.1. Porters Five Forces
- 5. Market Analysis, Insights and Forecast 2021-2033
- 5.1. Market Analysis, Insights and Forecast - by Production Analysis
- 5.2. Market Analysis, Insights and Forecast - by Consumption Analysis
- 5.3. Market Analysis, Insights and Forecast - by Import Market Analysis (Value & Volume)
- 5.4. Market Analysis, Insights and Forecast - by Export Market Analysis (Value & Volume)
- 5.5. Market Analysis, Insights and Forecast - by Price Trend Analysis
- 5.6. Market Analysis, Insights and Forecast - by Region
- 5.6.1. North America
- 5.6.2. Europe
- 5.6.3. Asia Pacific
- 5.6.4. Middle East
- 6. Global Dried Figs Industry Analysis, Insights and Forecast, 2021-2033
- 6.1. Market Analysis, Insights and Forecast - by Production Analysis
- 6.2. Market Analysis, Insights and Forecast - by Consumption Analysis
- 6.3. Market Analysis, Insights and Forecast - by Import Market Analysis (Value & Volume)
- 6.4. Market Analysis, Insights and Forecast - by Export Market Analysis (Value & Volume)
- 6.5. Market Analysis, Insights and Forecast - by Price Trend Analysis
- 7. North America Dried Figs Industry Analysis, Insights and Forecast, 2020-2032
- 7.1. Market Analysis, Insights and Forecast - by Production Analysis
- 7.2. Market Analysis, Insights and Forecast - by Consumption Analysis
- 7.3. Market Analysis, Insights and Forecast - by Import Market Analysis (Value & Volume)
- 7.4. Market Analysis, Insights and Forecast - by Export Market Analysis (Value & Volume)
- 7.5. Market Analysis, Insights and Forecast - by Price Trend Analysis
- 8. Europe Dried Figs Industry Analysis, Insights and Forecast, 2020-2032
- 8.1. Market Analysis, Insights and Forecast - by Production Analysis
- 8.2. Market Analysis, Insights and Forecast - by Consumption Analysis
- 8.3. Market Analysis, Insights and Forecast - by Import Market Analysis (Value & Volume)
- 8.4. Market Analysis, Insights and Forecast - by Export Market Analysis (Value & Volume)
- 8.5. Market Analysis, Insights and Forecast - by Price Trend Analysis
- 9. Asia Pacific Dried Figs Industry Analysis, Insights and Forecast, 2020-2032
- 9.1. Market Analysis, Insights and Forecast - by Production Analysis
- 9.2. Market Analysis, Insights and Forecast - by Consumption Analysis
- 9.3. Market Analysis, Insights and Forecast - by Import Market Analysis (Value & Volume)
- 9.4. Market Analysis, Insights and Forecast - by Export Market Analysis (Value & Volume)
- 9.5. Market Analysis, Insights and Forecast - by Price Trend Analysis
- 10. Middle East Dried Figs Industry Analysis, Insights and Forecast, 2020-2032
- 10.1. Market Analysis, Insights and Forecast - by Production Analysis
- 10.2. Market Analysis, Insights and Forecast - by Consumption Analysis
- 10.3. Market Analysis, Insights and Forecast - by Import Market Analysis (Value & Volume)
- 10.4. Market Analysis, Insights and Forecast - by Export Market Analysis (Value & Volume)
- 10.5. Market Analysis, Insights and Forecast - by Price Trend Analysis
- 11. Competitive Analysis
- 11.1. Company Profiles
- 11.1.1 Adisebaba Dried Fruits
- 11.1.1.1. Company Overview
- 11.1.1.2. Products
- 11.1.1.3. Company Financials
- 11.1.1.4. SWOT Analysis
- 11.1.2 Azad Dried Fruits & Spices
- 11.1.2.1. Company Overview
- 11.1.2.2. Products
- 11.1.2.3. Company Financials
- 11.1.2.4. SWOT Analysis
- 11.1.3 Earth's Finest
- 11.1.3.1. Company Overview
- 11.1.3.2. Products
- 11.1.3.3. Company Financials
- 11.1.3.4. SWOT Analysis
- 11.1.1 Adisebaba Dried Fruits
- 11.2. Market Entropy
- 11.2.1 Company's Key Areas Served
- 11.2.2 Recent Developments
- 11.3. Company Market Share Analysis 2025
- 11.3.1 Top 5 Companies Market Share Analysis
- 11.3.2 Top 3 Companies Market Share Analysis
- 11.4. List of Potential Customers
- 12. Research Methodology
List of Figures
- Figure 1: Global Dried Figs Industry Revenue Breakdown (billion, %) by Region 2025 & 2033
- Figure 2: North America Dried Figs Industry Revenue (billion), by Production Analysis 2025 & 2033
- Figure 3: North America Dried Figs Industry Revenue Share (%), by Production Analysis 2025 & 2033
- Figure 4: North America Dried Figs Industry Revenue (billion), by Consumption Analysis 2025 & 2033
- Figure 5: North America Dried Figs Industry Revenue Share (%), by Consumption Analysis 2025 & 2033
- Figure 6: North America Dried Figs Industry Revenue (billion), by Import Market Analysis (Value & Volume) 2025 & 2033
- Figure 7: North America Dried Figs Industry Revenue Share (%), by Import Market Analysis (Value & Volume) 2025 & 2033
- Figure 8: North America Dried Figs Industry Revenue (billion), by Export Market Analysis (Value & Volume) 2025 & 2033
- Figure 9: North America Dried Figs Industry Revenue Share (%), by Export Market Analysis (Value & Volume) 2025 & 2033
- Figure 10: North America Dried Figs Industry Revenue (billion), by Price Trend Analysis 2025 & 2033
- Figure 11: North America Dried Figs Industry Revenue Share (%), by Price Trend Analysis 2025 & 2033
- Figure 12: North America Dried Figs Industry Revenue (billion), by Country 2025 & 2033
- Figure 13: North America Dried Figs Industry Revenue Share (%), by Country 2025 & 2033
- Figure 14: Europe Dried Figs Industry Revenue (billion), by Production Analysis 2025 & 2033
- Figure 15: Europe Dried Figs Industry Revenue Share (%), by Production Analysis 2025 & 2033
- Figure 16: Europe Dried Figs Industry Revenue (billion), by Consumption Analysis 2025 & 2033
- Figure 17: Europe Dried Figs Industry Revenue Share (%), by Consumption Analysis 2025 & 2033
- Figure 18: Europe Dried Figs Industry Revenue (billion), by Import Market Analysis (Value & Volume) 2025 & 2033
- Figure 19: Europe Dried Figs Industry Revenue Share (%), by Import Market Analysis (Value & Volume) 2025 & 2033
- Figure 20: Europe Dried Figs Industry Revenue (billion), by Export Market Analysis (Value & Volume) 2025 & 2033
- Figure 21: Europe Dried Figs Industry Revenue Share (%), by Export Market Analysis (Value & Volume) 2025 & 2033
- Figure 22: Europe Dried Figs Industry Revenue (billion), by Price Trend Analysis 2025 & 2033
- Figure 23: Europe Dried Figs Industry Revenue Share (%), by Price Trend Analysis 2025 & 2033
- Figure 24: Europe Dried Figs Industry Revenue (billion), by Country 2025 & 2033
- Figure 25: Europe Dried Figs Industry Revenue Share (%), by Country 2025 & 2033
- Figure 26: Asia Pacific Dried Figs Industry Revenue (billion), by Production Analysis 2025 & 2033
- Figure 27: Asia Pacific Dried Figs Industry Revenue Share (%), by Production Analysis 2025 & 2033
- Figure 28: Asia Pacific Dried Figs Industry Revenue (billion), by Consumption Analysis 2025 & 2033
- Figure 29: Asia Pacific Dried Figs Industry Revenue Share (%), by Consumption Analysis 2025 & 2033
- Figure 30: Asia Pacific Dried Figs Industry Revenue (billion), by Import Market Analysis (Value & Volume) 2025 & 2033
- Figure 31: Asia Pacific Dried Figs Industry Revenue Share (%), by Import Market Analysis (Value & Volume) 2025 & 2033
- Figure 32: Asia Pacific Dried Figs Industry Revenue (billion), by Export Market Analysis (Value & Volume) 2025 & 2033
- Figure 33: Asia Pacific Dried Figs Industry Revenue Share (%), by Export Market Analysis (Value & Volume) 2025 & 2033
- Figure 34: Asia Pacific Dried Figs Industry Revenue (billion), by Price Trend Analysis 2025 & 2033
- Figure 35: Asia Pacific Dried Figs Industry Revenue Share (%), by Price Trend Analysis 2025 & 2033
- Figure 36: Asia Pacific Dried Figs Industry Revenue (billion), by Country 2025 & 2033
- Figure 37: Asia Pacific Dried Figs Industry Revenue Share (%), by Country 2025 & 2033
- Figure 38: Middle East Dried Figs Industry Revenue (billion), by Production Analysis 2025 & 2033
- Figure 39: Middle East Dried Figs Industry Revenue Share (%), by Production Analysis 2025 & 2033
- Figure 40: Middle East Dried Figs Industry Revenue (billion), by Consumption Analysis 2025 & 2033
- Figure 41: Middle East Dried Figs Industry Revenue Share (%), by Consumption Analysis 2025 & 2033
- Figure 42: Middle East Dried Figs Industry Revenue (billion), by Import Market Analysis (Value & Volume) 2025 & 2033
- Figure 43: Middle East Dried Figs Industry Revenue Share (%), by Import Market Analysis (Value & Volume) 2025 & 2033
- Figure 44: Middle East Dried Figs Industry Revenue (billion), by Export Market Analysis (Value & Volume) 2025 & 2033
- Figure 45: Middle East Dried Figs Industry Revenue Share (%), by Export Market Analysis (Value & Volume) 2025 & 2033
- Figure 46: Middle East Dried Figs Industry Revenue (billion), by Price Trend Analysis 2025 & 2033
- Figure 47: Middle East Dried Figs Industry Revenue Share (%), by Price Trend Analysis 2025 & 2033
- Figure 48: Middle East Dried Figs Industry Revenue (billion), by Country 2025 & 2033
- Figure 49: Middle East Dried Figs Industry Revenue Share (%), by Country 2025 & 2033
List of Tables
- Table 1: Global Dried Figs Industry Revenue billion Forecast, by Production Analysis 2020 & 2033
- Table 2: Global Dried Figs Industry Revenue billion Forecast, by Consumption Analysis 2020 & 2033
- Table 3: Global Dried Figs Industry Revenue billion Forecast, by Import Market Analysis (Value & Volume) 2020 & 2033
- Table 4: Global Dried Figs Industry Revenue billion Forecast, by Export Market Analysis (Value & Volume) 2020 & 2033
- Table 5: Global Dried Figs Industry Revenue billion Forecast, by Price Trend Analysis 2020 & 2033
- Table 6: Global Dried Figs Industry Revenue billion Forecast, by Region 2020 & 2033
- Table 7: Global Dried Figs Industry Revenue billion Forecast, by Production Analysis 2020 & 2033
- Table 8: Global Dried Figs Industry Revenue billion Forecast, by Consumption Analysis 2020 & 2033
- Table 9: Global Dried Figs Industry Revenue billion Forecast, by Import Market Analysis (Value & Volume) 2020 & 2033
- Table 10: Global Dried Figs Industry Revenue billion Forecast, by Export Market Analysis (Value & Volume) 2020 & 2033
- Table 11: Global Dried Figs Industry Revenue billion Forecast, by Price Trend Analysis 2020 & 2033
- Table 12: Global Dried Figs Industry Revenue billion Forecast, by Country 2020 & 2033
- Table 13: United States Dried Figs Industry Revenue (billion) Forecast, by Application 2020 & 2033
- Table 14: Canada Dried Figs Industry Revenue (billion) Forecast, by Application 2020 & 2033
- Table 15: Mexico Dried Figs Industry Revenue (billion) Forecast, by Application 2020 & 2033
- Table 16: Global Dried Figs Industry Revenue billion Forecast, by Production Analysis 2020 & 2033
- Table 17: Global Dried Figs Industry Revenue billion Forecast, by Consumption Analysis 2020 & 2033
- Table 18: Global Dried Figs Industry Revenue billion Forecast, by Import Market Analysis (Value & Volume) 2020 & 2033
- Table 19: Global Dried Figs Industry Revenue billion Forecast, by Export Market Analysis (Value & Volume) 2020 & 2033
- Table 20: Global Dried Figs Industry Revenue billion Forecast, by Price Trend Analysis 2020 & 2033
- Table 21: Global Dried Figs Industry Revenue billion Forecast, by Country 2020 & 2033
- Table 22: France Dried Figs Industry Revenue (billion) Forecast, by Application 2020 & 2033
- Table 23: Germany Dried Figs Industry Revenue (billion) Forecast, by Application 2020 & 2033
- Table 24: Russian Federation Dried Figs Industry Revenue (billion) Forecast, by Application 2020 & 2033
- Table 25: United Kingdom Dried Figs Industry Revenue (billion) Forecast, by Application 2020 & 2033
- Table 26: Italy Dried Figs Industry Revenue (billion) Forecast, by Application 2020 & 2033
- Table 27: Switzerland Dried Figs Industry Revenue (billion) Forecast, by Application 2020 & 2033
- Table 28: Greece Dried Figs Industry Revenue (billion) Forecast, by Application 2020 & 2033
- Table 29: Global Dried Figs Industry Revenue billion Forecast, by Production Analysis 2020 & 2033
- Table 30: Global Dried Figs Industry Revenue billion Forecast, by Consumption Analysis 2020 & 2033
- Table 31: Global Dried Figs Industry Revenue billion Forecast, by Import Market Analysis (Value & Volume) 2020 & 2033
- Table 32: Global Dried Figs Industry Revenue billion Forecast, by Export Market Analysis (Value & Volume) 2020 & 2033
- Table 33: Global Dried Figs Industry Revenue billion Forecast, by Price Trend Analysis 2020 & 2033
- Table 34: Global Dried Figs Industry Revenue billion Forecast, by Country 2020 & 2033
- Table 35: India Dried Figs Industry Revenue (billion) Forecast, by Application 2020 & 2033
- Table 36: China Dried Figs Industry Revenue (billion) Forecast, by Application 2020 & 2033
- Table 37: Australia Dried Figs Industry Revenue (billion) Forecast, by Application 2020 & 2033
- Table 38: Global Dried Figs Industry Revenue billion Forecast, by Production Analysis 2020 & 2033
- Table 39: Global Dried Figs Industry Revenue billion Forecast, by Consumption Analysis 2020 & 2033
- Table 40: Global Dried Figs Industry Revenue billion Forecast, by Import Market Analysis (Value & Volume) 2020 & 2033
- Table 41: Global Dried Figs Industry Revenue billion Forecast, by Export Market Analysis (Value & Volume) 2020 & 2033
- Table 42: Global Dried Figs Industry Revenue billion Forecast, by Price Trend Analysis 2020 & 2033
- Table 43: Global Dried Figs Industry Revenue billion Forecast, by Country 2020 & 2033
- Table 44: Iran Dried Figs Industry Revenue (billion) Forecast, by Application 2020 & 2033
- Table 45: United Arab Emirates Dried Figs Industry Revenue (billion) Forecast, by Application 2020 & 2033
- Table 46: Saudi Arabia Dried Figs Industry Revenue (billion) Forecast, by Application 2020 & 2033
Frequently Asked Questions
1. What is the projected Compound Annual Growth Rate (CAGR) of the Dried Figs Industry?
The projected CAGR is approximately 5.1%.
2. Which companies are prominent players in the Dried Figs Industry?
Key companies in the market include Adisebaba Dried Fruits , Azad Dried Fruits & Spices, Earth's Finest .
3. What are the main segments of the Dried Figs Industry?
The market segments include Production Analysis, Consumption Analysis, Import Market Analysis (Value & Volume), Export Market Analysis (Value & Volume), Price Trend Analysis.
4. Can you provide details about the market size?
The market size is estimated to be USD 1.45 billion as of 2022.
5. What are some drivers contributing to market growth?
Rise in Percentage of Area Harvested Under Almond Cultivation; Demand for Healthy Snacking Options.
6. What are the notable trends driving market growth?
Rising Per Capita Consumption from High-income Economies.
7. Are there any restraints impacting market growth?
Water Scarcity in Almond Producing Regions; Drop in the Prices of Almonds.
8. Can you provide examples of recent developments in the market?
June 2023: At the recent THAIFEX - Anuga Asia 2023, Turkey-based organic snacks brand Sunny Fruit introduced its latest "functional fruit" range, including Prebiotic Organic Dried Apricots, Prebiotic Organic Dried Figs, and Organic Fig & Walnut Balls with Added Probiotics and Prebiotics.
9. What pricing options are available for accessing the report?
Pricing options include single-user, multi-user, and enterprise licenses priced at USD 4750, USD 5250, and USD 8750 respectively.
10. Is the market size provided in terms of value or volume?
The market size is provided in terms of value, measured in billion.
11. Are there any specific market keywords associated with the report?
Yes, the market keyword associated with the report is "Dried Figs Industry," which aids in identifying and referencing the specific market segment covered.
12. How do I determine which pricing option suits my needs best?
The pricing options vary based on user requirements and access needs. Individual users may opt for single-user licenses, while businesses requiring broader access may choose multi-user or enterprise licenses for cost-effective access to the report.
13. Are there any additional resources or data provided in the Dried Figs Industry report?
While the report offers comprehensive insights, it's advisable to review the specific contents or supplementary materials provided to ascertain if additional resources or data are available.
14. How can I stay updated on further developments or reports in the Dried Figs Industry?
To stay informed about further developments, trends, and reports in the Dried Figs Industry, consider subscribing to industry newsletters, following relevant companies and organizations, or regularly checking reputable industry news sources and publications.
Methodology
Step 1 - Identification of Relevant Samples Size from Population Database


Step 2 - Approaches for Defining Global Market Size (Value, Volume* & Price*)

Note*: In applicable scenarios
Step 3 - Data Sources
Primary Research
- Web Analytics
- Survey Reports
- Research Institute
- Latest Research Reports
- Opinion Leaders
Secondary Research
- Annual Reports
- White Paper
- Latest Press Release
- Industry Association
- Paid Database
- Investor Presentations

Step 4 - Data Triangulation
Involves using different sources of information in order to increase the validity of a study
These sources are likely to be stakeholders in a program - participants, other researchers, program staff, other community members, and so on.
Then we put all data in single framework & apply various statistical tools to find out the dynamic on the market.
During the analysis stage, feedback from the stakeholder groups would be compared to determine areas of agreement as well as areas of divergence