

Key Insights
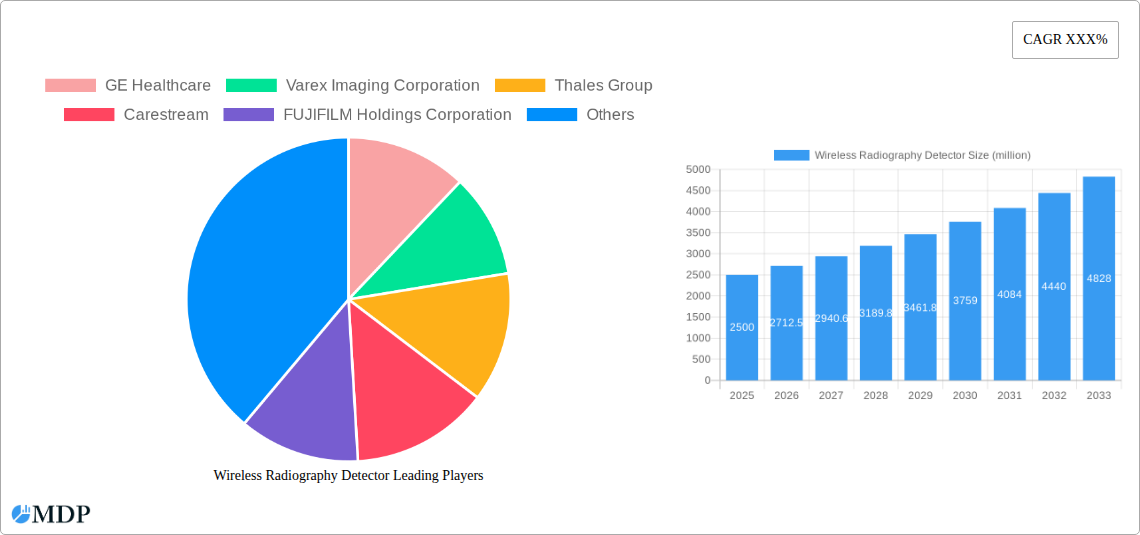
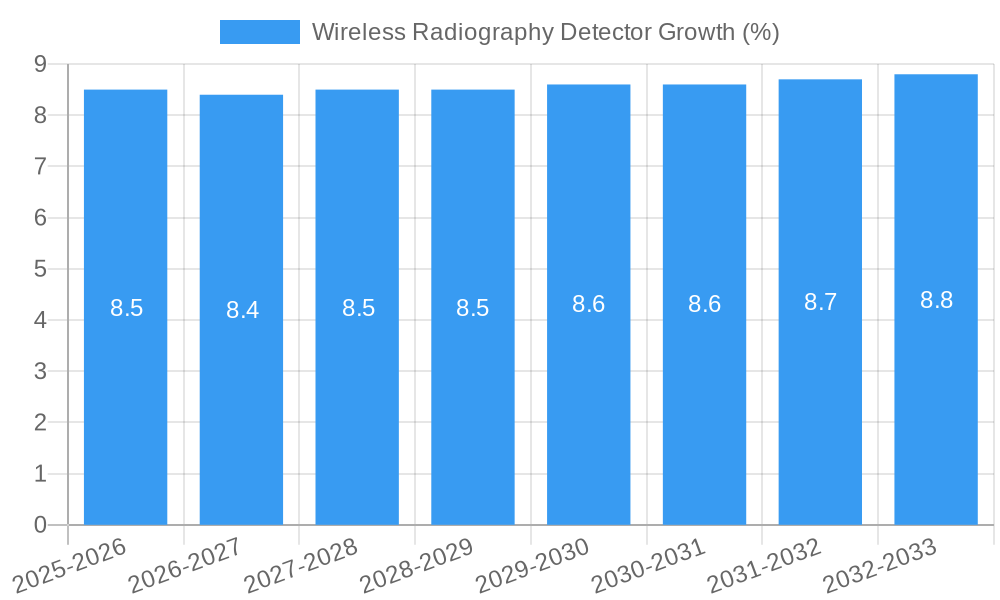
The global wireless radiography detector market is experiencing robust growth, projected to reach an estimated USD 2,500 million by 2025, with a Compound Annual Growth Rate (CAGR) of approximately 8.5% anticipated over the forecast period of 2025-2033. This expansion is largely propelled by the increasing demand for advanced diagnostic imaging solutions across healthcare facilities, driven by factors such as the rising prevalence of chronic diseases and the aging global population, which necessitate more frequent and sophisticated imaging procedures. Furthermore, the technological advancements in digital radiography, including enhanced image quality, reduced radiation exposure, and improved workflow efficiency offered by wireless detectors, are key stimulants for market growth. The convenience and flexibility offered by wireless technology significantly reduce setup time and enable easier patient positioning, thereby enhancing overall diagnostic capabilities and patient comfort.
The market is segmented by application into Fixed Digital Radiography and Mobile Digital Radiography, with the former currently holding a larger share due to widespread adoption in established radiology departments. However, the mobile digital radiography segment is poised for substantial growth, fueled by the increasing deployment of portable X-ray systems in critical care units, emergency rooms, and remote healthcare settings. By type, the Amorphous Silicon (A-Si) detectors are dominant, known for their excellent performance and cost-effectiveness, while Flexible Cassette detectors are emerging as a significant innovation, offering enhanced adaptability for various imaging scenarios. Key players such as GE Healthcare, Varex Imaging Corporation, and FUJIFILM Holdings Corporation are heavily investing in research and development to introduce next-generation wireless radiography detectors, further shaping the competitive landscape. However, the market faces challenges such as high initial investment costs for advanced systems and the need for robust cybersecurity measures to protect sensitive patient data, which could moderately restrain the pace of adoption in certain regions.
Wireless Radiography Detector Market Dynamics & Concentration
The global Wireless Radiography Detector market exhibits a moderate to high concentration, with key players like GE Healthcare, Varex Imaging Corporation, Thales Group, Carestream, and FUJIFILM Holdings Corporation holding significant market share. These industry giants, alongside other prominent entities such as Canon, Analogic Corporation, AGFA Healthcare, KONICA MINOLTA, Villa Sistemi Medicali, iRay Technology, Idetec Medical Imaging, Vieworks, and Atlaim, actively drive innovation and market expansion. The market is propelled by a confluence of factors including the increasing demand for advanced diagnostic imaging solutions, growing adoption of digital radiography systems, and the continuous pursuit of enhanced patient care and workflow efficiency in healthcare settings. Regulatory frameworks, particularly those focused on imaging safety and data integrity, play a crucial role in shaping market entry and product development.
- Market Share: Leading companies collectively account for over 60% of the global market revenue.
- Innovation Drivers: Miniaturization, improved detector sensitivity, enhanced wireless connectivity, and AI integration in image analysis are key innovation drivers.
- Regulatory Frameworks: FDA approvals, CE marking, and country-specific radiation safety standards are critical for market access.
- Product Substitutes: While direct substitutes are limited, advancements in alternative imaging modalities like MRI and CT scans can indirectly influence demand.
- End-User Trends: Hospitals and diagnostic imaging centers are increasingly investing in wireless radiography detectors for improved mobility and reduced patient discomfort.
- M&A Activities: The past five years have seen approximately 8 significant M&A deals valued at over 500 million dollars, aimed at consolidating market presence and acquiring new technologies.
Wireless Radiography Detector Industry Trends & Analysis
The Wireless Radiography Detector market is experiencing robust growth, driven by several compelling factors. A primary catalyst is the escalating global burden of diseases requiring diagnostic imaging, such as cancer, cardiovascular conditions, and musculoskeletal disorders, which necessitates advanced and accessible imaging technologies. The shift from traditional film-based radiography to digital radiography (DR) systems is a fundamental trend, with wireless detectors offering significant advantages in terms of workflow efficiency, reduced radiation exposure, and enhanced image quality. This transition is further accelerated by government initiatives and healthcare reforms promoting the adoption of digital healthcare solutions and improving diagnostic capabilities.
Technological advancements are at the forefront of market evolution. The development of amorphous silicon (A-Si) detectors has been a cornerstone, offering a balance of performance and cost-effectiveness. Continuous improvements in scintillator materials and pixel electronics are leading to higher spatial resolution, superior contrast detectability, and lower noise levels, enabling more accurate diagnoses. The integration of wireless connectivity, eliminating cumbersome cables, significantly enhances the flexibility and mobility of radiography equipment. This is particularly beneficial in critical care settings, emergency rooms, and for bedside imaging of immobile patients. Furthermore, the burgeoning field of artificial intelligence (AI) is revolutionizing image acquisition and interpretation. AI algorithms are being developed to assist in image optimization, artifact reduction, and even preliminary diagnostic analysis, thereby improving radiologist productivity and diagnostic accuracy.
Consumer preferences are also evolving. Healthcare providers are increasingly prioritizing solutions that offer a faster return on investment, improved patient throughput, and a superior patient experience. Wireless radiography detectors contribute to all these aspects. The reduction in procedure time and the elimination of physical film processing lead to quicker turnaround times for diagnoses. Moreover, the less invasive nature of digital radiography and the ease of image sharing and storage contribute to a more patient-centric approach. The competitive landscape is characterized by intense innovation and strategic partnerships. Companies are investing heavily in R&D to develop next-generation detectors with enhanced features like larger field-of-view, improved dose efficiency, and longer battery life. The market penetration of wireless radiography detectors, while significant, still presents substantial growth opportunities, especially in emerging economies where the adoption of advanced medical technologies is gaining momentum. The projected Compound Annual Growth Rate (CAGR) for the Wireless Radiography Detector market is estimated to be around 15.5% during the forecast period.
Leading Markets & Segments in Wireless Radiography Detector
The global Wireless Radiography Detector market is characterized by strong performance across various applications and detector types, with a clear dominance emerging in specific segments. Fixed Digital Radiography stands out as the leading application, driven by the widespread adoption of fixed X-ray rooms in hospitals, outpatient clinics, and imaging centers worldwide. These installations benefit immensely from the seamless integration of wireless detectors, which streamline patient positioning, reduce setup time, and optimize radiologist workflow. The enhanced imaging capabilities of fixed DR systems, coupled with the flexibility offered by wireless connectivity, make them the preferred choice for general radiography needs, including chest X-rays, skeletal imaging, and abdominal examinations.
The Type: A-Si (Amorphous Silicon) detectors are currently the most prevalent and dominant technology within the wireless radiography detector market. This dominance is attributed to their established reliability, superior image quality for a wide range of diagnostic applications, and a mature manufacturing ecosystem that ensures competitive pricing. Amorphous silicon technology has undergone significant refinement, offering excellent spatial resolution, high Detective Quantum Efficiency (DQE), and robust performance, making them suitable for both fixed and mobile radiography systems. The continuous innovation in A-Si detector design, including improved pixel arrays and advanced readout electronics, further solidifies their market leadership.
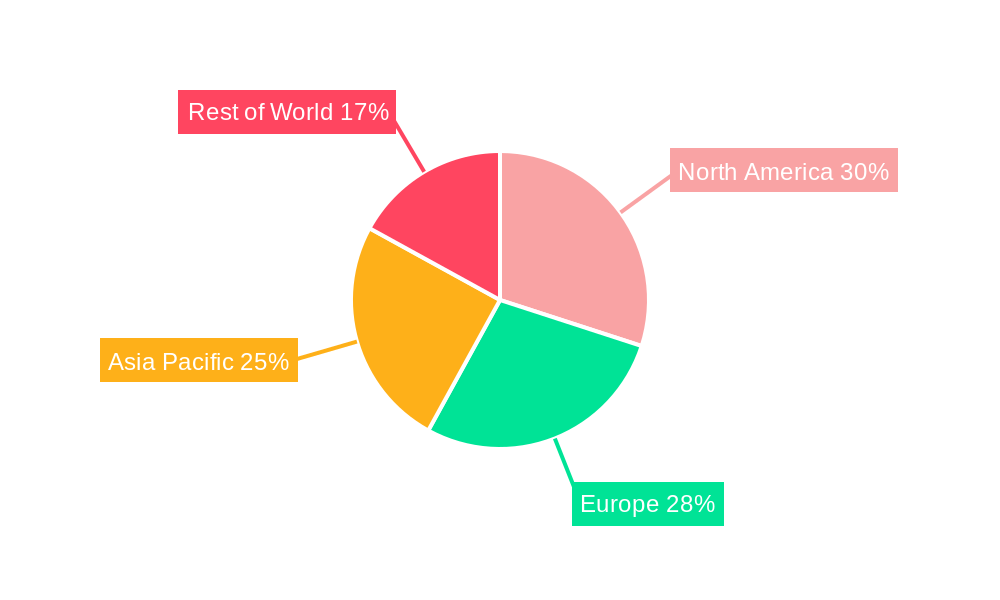
- Dominant Region: North America currently leads the global market for Wireless Radiography Detectors, propelled by a robust healthcare infrastructure, high healthcare expenditure, and early adoption of advanced medical technologies. The region's strong emphasis on value-based care and the continuous drive for improved patient outcomes further fuel the demand for sophisticated diagnostic imaging solutions.
- Dominant Country: The United States, within North America, represents the largest single market for wireless radiography detectors. This is underpinned by a dense network of hospitals and imaging facilities, significant investment in healthcare IT, and a favorable reimbursement landscape for digital radiography procedures.
- Key Drivers for Fixed Digital Radiography Dominance:
- Workflow Efficiency: Wireless detectors significantly reduce cable management and allow for quicker patient throughput in busy radiology departments.
- Image Quality: Advanced A-Si detectors provide excellent image detail, crucial for accurate diagnosis in various anatomical regions.
- Technological Advancement: Continuous innovation in detector technology, including higher DQE and lower noise, enhances diagnostic confidence.
- Cost-Effectiveness: While initial investment can be substantial, the long-term operational benefits and reduced need for consumables make fixed DR systems economically attractive.
- Key Drivers for A-Si Detector Dominance:
- Proven Reliability and Performance: A-Si technology has a long track record of delivering consistent and high-quality imaging results.
- Cost-Benefit Ratio: A-Si detectors offer a favorable balance between performance and price, making them accessible to a broader range of healthcare providers.
- Mature Manufacturing Ecosystem: The established production lines and supply chains for A-Si components contribute to consistent availability and competitive pricing.
- Versatility: A-Si detectors are adaptable for various radiography applications, including both fixed and mobile systems.
While Mobile Digital Radiography is a rapidly growing segment, particularly for point-of-care imaging, and Flexible Cassette detectors are gaining traction for their portability and ease of use in confined spaces, the sheer volume of installations and the foundational role of fixed DR systems, powered by A-Si technology, currently establish their dominance in the global Wireless Radiography Detector market.
Wireless Radiography Detector Product Developments
Recent product developments in the Wireless Radiography Detector market are focused on enhancing image quality, improving user experience, and expanding application versatility. Innovations in detector materials and read-out electronics are yielding higher resolution and improved dose efficiency, leading to clearer images with reduced patient radiation exposure. The integration of advanced wireless communication protocols ensures faster data transfer and more reliable connectivity, crucial for high-volume imaging environments. Furthermore, the development of thinner, lighter, and more robust detector designs is enhancing portability and ease of use, particularly for mobile radiography units. Some manufacturers are also integrating AI-powered image processing capabilities directly into the detectors, offering real-time image enhancement and potentially assisting in preliminary diagnostic assessments. These advancements collectively aim to streamline clinical workflows, improve diagnostic accuracy, and contribute to better patient outcomes, solidifying the competitive advantage of leading players.
Key Drivers of Wireless Radiography Detector Growth
The Wireless Radiography Detector market is experiencing significant growth, fueled by several potent drivers. The increasing global prevalence of chronic diseases and the aging population are escalating the demand for advanced diagnostic imaging solutions. Technological advancements, particularly in detector efficiency, image processing, and wireless connectivity, are making digital radiography more accessible and effective. Government initiatives promoting digital healthcare infrastructure and improved patient care standards further incentivize adoption. The pursuit of operational efficiency in healthcare settings, by reducing procedure times and enhancing radiologist productivity, also plays a crucial role.
- Technological Advancements: Enhanced resolution, DQE, and wireless capabilities.
- Increasing Disease Prevalence: Rising incidence of cancer, cardiovascular diseases, and orthopedic conditions.
- Government Initiatives: Digital health policies and reimbursement for DR.
- Demand for Workflow Efficiency: Streamlining patient throughput and radiologist productivity.
- Aging Population: Increased need for diagnostic imaging services.
Challenges in the Wireless Radiography Detector Market
Despite the promising growth trajectory, the Wireless Radiography Detector market faces several significant challenges. The high initial cost of advanced wireless detector systems can be a substantial barrier for smaller healthcare facilities, particularly in price-sensitive emerging markets. Stringent regulatory approvals and the need for compliance with evolving safety and data privacy standards (e.g., HIPAA, GDPR) can lengthen product development cycles and increase costs. Fierce competition among established players and emerging manufacturers, coupled with potential price wars, can impact profit margins. Supply chain disruptions, as witnessed in recent years, can affect the availability of critical components, leading to production delays.
- High Initial Investment Costs: Affecting adoption in resource-limited settings.
- Stringent Regulatory Hurdles: Requiring extensive testing and approvals.
- Intense Competition: Leading to pricing pressures.
- Supply Chain Vulnerabilities: Potential for component shortages and production delays.
Emerging Opportunities in Wireless Radiography Detector
The Wireless Radiography Detector market is ripe with emerging opportunities that promise to shape its future growth. The integration of Artificial Intelligence (AI) and Machine Learning (ML) into radiography workflows presents a significant avenue. AI algorithms can enhance image quality, automate image analysis, reduce diagnostic errors, and optimize radiation dose. The growing demand for portable and point-of-care imaging solutions, especially in rural areas and during public health crises, opens up opportunities for compact and user-friendly wireless detectors. Furthermore, strategic partnerships between detector manufacturers and AI software developers can lead to comprehensive imaging solutions. Expansion into emerging economies with developing healthcare infrastructures, where the transition to digital radiography is still in its early stages, offers substantial market penetration potential.
Leading Players in the Wireless Radiography Detector Sector
- GE Healthcare
- Varex Imaging Corporation
- Thales Group
- Carestream
- FUJIFILM Holdings Corporation
- Canon
- Analogic Corporation
- AGFA Healthcare
- KONICA MINOLTA
- Villa Sistemi Medicali
- iRay Technology
- Idetec Medical Imaging
- Vieworks
- Atlaim
Key Milestones in Wireless Radiography Detector Industry
- 2019: Launch of enhanced A-Si detectors with improved DQE by Varex Imaging Corporation.
- 2020: Thales Group's acquisition of a key component supplier, strengthening its supply chain.
- 2021: GE Healthcare introduces AI-powered image reconstruction software for its wireless detectors.
- 2022: Carestream launches a new generation of ultra-lightweight flexible cassette detectors.
- 2023: FUJIFILM Holdings Corporation announces a strategic partnership with a leading AI imaging analytics company.
- 2024: iRay Technology unveils a new high-resolution wireless detector with extended battery life, targeting specialized imaging applications.
Strategic Outlook for Wireless Radiography Detector Market
The strategic outlook for the Wireless Radiography Detector market is exceptionally positive, driven by continuous innovation and expanding applications. The convergence of advanced detector technology with AI and machine learning is poised to create highly intelligent and efficient diagnostic tools. Manufacturers are expected to focus on developing detectors that offer superior image quality at lower radiation doses, catering to the growing demand for patient safety and diagnostic accuracy. The increasing adoption of integrated PACS (Picture Archiving and Communication System) and RIS (Radiology Information System) solutions will further enhance the value proposition of wireless detectors by enabling seamless data management and workflow integration. Strategic collaborations and potential mergers and acquisitions will continue to shape the competitive landscape, driving consolidation and fostering the development of more comprehensive imaging solutions. The market's growth trajectory suggests a sustained expansion, particularly in regions with developing healthcare infrastructure and a rising demand for advanced medical diagnostics.
Wireless Radiography Detector Segmentation
-
1. Application
- 1.1. Fixed Digital Radiography
- 1.2. Mobile Digital Radiography
-
2. Type
- 2.1. A-Si(Amorphous Silicon)
- 2.2. Flexible Cassette
Wireless Radiography Detector Segmentation By Geography
-
1. North America
- 1.1. United States
- 1.2. Canada
- 1.3. Mexico
-
2. South America
- 2.1. Brazil
- 2.2. Argentina
- 2.3. Rest of South America
-
3. Europe
- 3.1. United Kingdom
- 3.2. Germany
- 3.3. France
- 3.4. Italy
- 3.5. Spain
- 3.6. Russia
- 3.7. Benelux
- 3.8. Nordics
- 3.9. Rest of Europe
-
4. Middle East & Africa
- 4.1. Turkey
- 4.2. Israel
- 4.3. GCC
- 4.4. North Africa
- 4.5. South Africa
- 4.6. Rest of Middle East & Africa
-
5. Asia Pacific
- 5.1. China
- 5.2. India
- 5.3. Japan
- 5.4. South Korea
- 5.5. ASEAN
- 5.6. Oceania
- 5.7. Rest of Asia Pacific
Wireless Radiography Detector REPORT HIGHLIGHTS
| Aspects | Details |
|---|---|
| Study Period | 2019-2033 |
| Base Year | 2024 |
| Estimated Year | 2025 |
| Forecast Period | 2025-2033 |
| Historical Period | 2019-2024 |
| Growth Rate | CAGR of XXX% from 2019-2033 |
| Segmentation |
|
Table of Contents
- 1. Introduction
- 1.1. Research Scope
- 1.2. Market Segmentation
- 1.3. Research Methodology
- 1.4. Definitions and Assumptions
- 2. Executive Summary
- 2.1. Introduction
- 3. Market Dynamics
- 3.1. Introduction
- 3.2. Market Drivers
- 3.3. Market Restrains
- 3.4. Market Trends
- 4. Market Factor Analysis
- 4.1. Porters Five Forces
- 4.2. Supply/Value Chain
- 4.3. PESTEL analysis
- 4.4. Market Entropy
- 4.5. Patent/Trademark Analysis
- 5. Global Wireless Radiography Detector Analysis, Insights and Forecast, 2019-2031
- 5.1. Market Analysis, Insights and Forecast - by Application
- 5.1.1. Fixed Digital Radiography
- 5.1.2. Mobile Digital Radiography
- 5.2. Market Analysis, Insights and Forecast - by Type
- 5.2.1. A-Si(Amorphous Silicon)
- 5.2.2. Flexible Cassette
- 5.3. Market Analysis, Insights and Forecast - by Region
- 5.3.1. North America
- 5.3.2. South America
- 5.3.3. Europe
- 5.3.4. Middle East & Africa
- 5.3.5. Asia Pacific
- 5.1. Market Analysis, Insights and Forecast - by Application
- 6. North America Wireless Radiography Detector Analysis, Insights and Forecast, 2019-2031
- 6.1. Market Analysis, Insights and Forecast - by Application
- 6.1.1. Fixed Digital Radiography
- 6.1.2. Mobile Digital Radiography
- 6.2. Market Analysis, Insights and Forecast - by Type
- 6.2.1. A-Si(Amorphous Silicon)
- 6.2.2. Flexible Cassette
- 6.1. Market Analysis, Insights and Forecast - by Application
- 7. South America Wireless Radiography Detector Analysis, Insights and Forecast, 2019-2031
- 7.1. Market Analysis, Insights and Forecast - by Application
- 7.1.1. Fixed Digital Radiography
- 7.1.2. Mobile Digital Radiography
- 7.2. Market Analysis, Insights and Forecast - by Type
- 7.2.1. A-Si(Amorphous Silicon)
- 7.2.2. Flexible Cassette
- 7.1. Market Analysis, Insights and Forecast - by Application
- 8. Europe Wireless Radiography Detector Analysis, Insights and Forecast, 2019-2031
- 8.1. Market Analysis, Insights and Forecast - by Application
- 8.1.1. Fixed Digital Radiography
- 8.1.2. Mobile Digital Radiography
- 8.2. Market Analysis, Insights and Forecast - by Type
- 8.2.1. A-Si(Amorphous Silicon)
- 8.2.2. Flexible Cassette
- 8.1. Market Analysis, Insights and Forecast - by Application
- 9. Middle East & Africa Wireless Radiography Detector Analysis, Insights and Forecast, 2019-2031
- 9.1. Market Analysis, Insights and Forecast - by Application
- 9.1.1. Fixed Digital Radiography
- 9.1.2. Mobile Digital Radiography
- 9.2. Market Analysis, Insights and Forecast - by Type
- 9.2.1. A-Si(Amorphous Silicon)
- 9.2.2. Flexible Cassette
- 9.1. Market Analysis, Insights and Forecast - by Application
- 10. Asia Pacific Wireless Radiography Detector Analysis, Insights and Forecast, 2019-2031
- 10.1. Market Analysis, Insights and Forecast - by Application
- 10.1.1. Fixed Digital Radiography
- 10.1.2. Mobile Digital Radiography
- 10.2. Market Analysis, Insights and Forecast - by Type
- 10.2.1. A-Si(Amorphous Silicon)
- 10.2.2. Flexible Cassette
- 10.1. Market Analysis, Insights and Forecast - by Application
- 11. Competitive Analysis
- 11.1. Global Market Share Analysis 2024
- 11.2. Company Profiles
- 11.2.1 GE Healthcare
- 11.2.1.1. Overview
- 11.2.1.2. Products
- 11.2.1.3. SWOT Analysis
- 11.2.1.4. Recent Developments
- 11.2.1.5. Financials (Based on Availability)
- 11.2.2 Varex Imaging Corporation
- 11.2.2.1. Overview
- 11.2.2.2. Products
- 11.2.2.3. SWOT Analysis
- 11.2.2.4. Recent Developments
- 11.2.2.5. Financials (Based on Availability)
- 11.2.3 Thales Group
- 11.2.3.1. Overview
- 11.2.3.2. Products
- 11.2.3.3. SWOT Analysis
- 11.2.3.4. Recent Developments
- 11.2.3.5. Financials (Based on Availability)
- 11.2.4 Carestream
- 11.2.4.1. Overview
- 11.2.4.2. Products
- 11.2.4.3. SWOT Analysis
- 11.2.4.4. Recent Developments
- 11.2.4.5. Financials (Based on Availability)
- 11.2.5 FUJIFILM Holdings Corporation
- 11.2.5.1. Overview
- 11.2.5.2. Products
- 11.2.5.3. SWOT Analysis
- 11.2.5.4. Recent Developments
- 11.2.5.5. Financials (Based on Availability)
- 11.2.6 Canon
- 11.2.6.1. Overview
- 11.2.6.2. Products
- 11.2.6.3. SWOT Analysis
- 11.2.6.4. Recent Developments
- 11.2.6.5. Financials (Based on Availability)
- 11.2.7 Analogic Corporation
- 11.2.7.1. Overview
- 11.2.7.2. Products
- 11.2.7.3. SWOT Analysis
- 11.2.7.4. Recent Developments
- 11.2.7.5. Financials (Based on Availability)
- 11.2.8 AGFA Healthcare
- 11.2.8.1. Overview
- 11.2.8.2. Products
- 11.2.8.3. SWOT Analysis
- 11.2.8.4. Recent Developments
- 11.2.8.5. Financials (Based on Availability)
- 11.2.9 KONICA MINOLTA
- 11.2.9.1. Overview
- 11.2.9.2. Products
- 11.2.9.3. SWOT Analysis
- 11.2.9.4. Recent Developments
- 11.2.9.5. Financials (Based on Availability)
- 11.2.10 Villa Sistemi Medicali
- 11.2.10.1. Overview
- 11.2.10.2. Products
- 11.2.10.3. SWOT Analysis
- 11.2.10.4. Recent Developments
- 11.2.10.5. Financials (Based on Availability)
- 11.2.11 iRay Technology
- 11.2.11.1. Overview
- 11.2.11.2. Products
- 11.2.11.3. SWOT Analysis
- 11.2.11.4. Recent Developments
- 11.2.11.5. Financials (Based on Availability)
- 11.2.12 Idetec Medical Imaging
- 11.2.12.1. Overview
- 11.2.12.2. Products
- 11.2.12.3. SWOT Analysis
- 11.2.12.4. Recent Developments
- 11.2.12.5. Financials (Based on Availability)
- 11.2.13 Vieworks
- 11.2.13.1. Overview
- 11.2.13.2. Products
- 11.2.13.3. SWOT Analysis
- 11.2.13.4. Recent Developments
- 11.2.13.5. Financials (Based on Availability)
- 11.2.14 Atlaim
- 11.2.14.1. Overview
- 11.2.14.2. Products
- 11.2.14.3. SWOT Analysis
- 11.2.14.4. Recent Developments
- 11.2.14.5. Financials (Based on Availability)
- 11.2.1 GE Healthcare
List of Figures
- Figure 1: Global Wireless Radiography Detector Revenue Breakdown (million, %) by Region 2024 & 2032
- Figure 2: Global Wireless Radiography Detector Volume Breakdown (K, %) by Region 2024 & 2032
- Figure 3: North America Wireless Radiography Detector Revenue (million), by Application 2024 & 2032
- Figure 4: North America Wireless Radiography Detector Volume (K), by Application 2024 & 2032
- Figure 5: North America Wireless Radiography Detector Revenue Share (%), by Application 2024 & 2032
- Figure 6: North America Wireless Radiography Detector Volume Share (%), by Application 2024 & 2032
- Figure 7: North America Wireless Radiography Detector Revenue (million), by Type 2024 & 2032
- Figure 8: North America Wireless Radiography Detector Volume (K), by Type 2024 & 2032
- Figure 9: North America Wireless Radiography Detector Revenue Share (%), by Type 2024 & 2032
- Figure 10: North America Wireless Radiography Detector Volume Share (%), by Type 2024 & 2032
- Figure 11: North America Wireless Radiography Detector Revenue (million), by Country 2024 & 2032
- Figure 12: North America Wireless Radiography Detector Volume (K), by Country 2024 & 2032
- Figure 13: North America Wireless Radiography Detector Revenue Share (%), by Country 2024 & 2032
- Figure 14: North America Wireless Radiography Detector Volume Share (%), by Country 2024 & 2032
- Figure 15: South America Wireless Radiography Detector Revenue (million), by Application 2024 & 2032
- Figure 16: South America Wireless Radiography Detector Volume (K), by Application 2024 & 2032
- Figure 17: South America Wireless Radiography Detector Revenue Share (%), by Application 2024 & 2032
- Figure 18: South America Wireless Radiography Detector Volume Share (%), by Application 2024 & 2032
- Figure 19: South America Wireless Radiography Detector Revenue (million), by Type 2024 & 2032
- Figure 20: South America Wireless Radiography Detector Volume (K), by Type 2024 & 2032
- Figure 21: South America Wireless Radiography Detector Revenue Share (%), by Type 2024 & 2032
- Figure 22: South America Wireless Radiography Detector Volume Share (%), by Type 2024 & 2032
- Figure 23: South America Wireless Radiography Detector Revenue (million), by Country 2024 & 2032
- Figure 24: South America Wireless Radiography Detector Volume (K), by Country 2024 & 2032
- Figure 25: South America Wireless Radiography Detector Revenue Share (%), by Country 2024 & 2032
- Figure 26: South America Wireless Radiography Detector Volume Share (%), by Country 2024 & 2032
- Figure 27: Europe Wireless Radiography Detector Revenue (million), by Application 2024 & 2032
- Figure 28: Europe Wireless Radiography Detector Volume (K), by Application 2024 & 2032
- Figure 29: Europe Wireless Radiography Detector Revenue Share (%), by Application 2024 & 2032
- Figure 30: Europe Wireless Radiography Detector Volume Share (%), by Application 2024 & 2032
- Figure 31: Europe Wireless Radiography Detector Revenue (million), by Type 2024 & 2032
- Figure 32: Europe Wireless Radiography Detector Volume (K), by Type 2024 & 2032
- Figure 33: Europe Wireless Radiography Detector Revenue Share (%), by Type 2024 & 2032
- Figure 34: Europe Wireless Radiography Detector Volume Share (%), by Type 2024 & 2032
- Figure 35: Europe Wireless Radiography Detector Revenue (million), by Country 2024 & 2032
- Figure 36: Europe Wireless Radiography Detector Volume (K), by Country 2024 & 2032
- Figure 37: Europe Wireless Radiography Detector Revenue Share (%), by Country 2024 & 2032
- Figure 38: Europe Wireless Radiography Detector Volume Share (%), by Country 2024 & 2032
- Figure 39: Middle East & Africa Wireless Radiography Detector Revenue (million), by Application 2024 & 2032
- Figure 40: Middle East & Africa Wireless Radiography Detector Volume (K), by Application 2024 & 2032
- Figure 41: Middle East & Africa Wireless Radiography Detector Revenue Share (%), by Application 2024 & 2032
- Figure 42: Middle East & Africa Wireless Radiography Detector Volume Share (%), by Application 2024 & 2032
- Figure 43: Middle East & Africa Wireless Radiography Detector Revenue (million), by Type 2024 & 2032
- Figure 44: Middle East & Africa Wireless Radiography Detector Volume (K), by Type 2024 & 2032
- Figure 45: Middle East & Africa Wireless Radiography Detector Revenue Share (%), by Type 2024 & 2032
- Figure 46: Middle East & Africa Wireless Radiography Detector Volume Share (%), by Type 2024 & 2032
- Figure 47: Middle East & Africa Wireless Radiography Detector Revenue (million), by Country 2024 & 2032
- Figure 48: Middle East & Africa Wireless Radiography Detector Volume (K), by Country 2024 & 2032
- Figure 49: Middle East & Africa Wireless Radiography Detector Revenue Share (%), by Country 2024 & 2032
- Figure 50: Middle East & Africa Wireless Radiography Detector Volume Share (%), by Country 2024 & 2032
- Figure 51: Asia Pacific Wireless Radiography Detector Revenue (million), by Application 2024 & 2032
- Figure 52: Asia Pacific Wireless Radiography Detector Volume (K), by Application 2024 & 2032
- Figure 53: Asia Pacific Wireless Radiography Detector Revenue Share (%), by Application 2024 & 2032
- Figure 54: Asia Pacific Wireless Radiography Detector Volume Share (%), by Application 2024 & 2032
- Figure 55: Asia Pacific Wireless Radiography Detector Revenue (million), by Type 2024 & 2032
- Figure 56: Asia Pacific Wireless Radiography Detector Volume (K), by Type 2024 & 2032
- Figure 57: Asia Pacific Wireless Radiography Detector Revenue Share (%), by Type 2024 & 2032
- Figure 58: Asia Pacific Wireless Radiography Detector Volume Share (%), by Type 2024 & 2032
- Figure 59: Asia Pacific Wireless Radiography Detector Revenue (million), by Country 2024 & 2032
- Figure 60: Asia Pacific Wireless Radiography Detector Volume (K), by Country 2024 & 2032
- Figure 61: Asia Pacific Wireless Radiography Detector Revenue Share (%), by Country 2024 & 2032
- Figure 62: Asia Pacific Wireless Radiography Detector Volume Share (%), by Country 2024 & 2032
List of Tables
- Table 1: Global Wireless Radiography Detector Revenue million Forecast, by Region 2019 & 2032
- Table 2: Global Wireless Radiography Detector Volume K Forecast, by Region 2019 & 2032
- Table 3: Global Wireless Radiography Detector Revenue million Forecast, by Application 2019 & 2032
- Table 4: Global Wireless Radiography Detector Volume K Forecast, by Application 2019 & 2032
- Table 5: Global Wireless Radiography Detector Revenue million Forecast, by Type 2019 & 2032
- Table 6: Global Wireless Radiography Detector Volume K Forecast, by Type 2019 & 2032
- Table 7: Global Wireless Radiography Detector Revenue million Forecast, by Region 2019 & 2032
- Table 8: Global Wireless Radiography Detector Volume K Forecast, by Region 2019 & 2032
- Table 9: Global Wireless Radiography Detector Revenue million Forecast, by Application 2019 & 2032
- Table 10: Global Wireless Radiography Detector Volume K Forecast, by Application 2019 & 2032
- Table 11: Global Wireless Radiography Detector Revenue million Forecast, by Type 2019 & 2032
- Table 12: Global Wireless Radiography Detector Volume K Forecast, by Type 2019 & 2032
- Table 13: Global Wireless Radiography Detector Revenue million Forecast, by Country 2019 & 2032
- Table 14: Global Wireless Radiography Detector Volume K Forecast, by Country 2019 & 2032
- Table 15: United States Wireless Radiography Detector Revenue (million) Forecast, by Application 2019 & 2032
- Table 16: United States Wireless Radiography Detector Volume (K) Forecast, by Application 2019 & 2032
- Table 17: Canada Wireless Radiography Detector Revenue (million) Forecast, by Application 2019 & 2032
- Table 18: Canada Wireless Radiography Detector Volume (K) Forecast, by Application 2019 & 2032
- Table 19: Mexico Wireless Radiography Detector Revenue (million) Forecast, by Application 2019 & 2032
- Table 20: Mexico Wireless Radiography Detector Volume (K) Forecast, by Application 2019 & 2032
- Table 21: Global Wireless Radiography Detector Revenue million Forecast, by Application 2019 & 2032
- Table 22: Global Wireless Radiography Detector Volume K Forecast, by Application 2019 & 2032
- Table 23: Global Wireless Radiography Detector Revenue million Forecast, by Type 2019 & 2032
- Table 24: Global Wireless Radiography Detector Volume K Forecast, by Type 2019 & 2032
- Table 25: Global Wireless Radiography Detector Revenue million Forecast, by Country 2019 & 2032
- Table 26: Global Wireless Radiography Detector Volume K Forecast, by Country 2019 & 2032
- Table 27: Brazil Wireless Radiography Detector Revenue (million) Forecast, by Application 2019 & 2032
- Table 28: Brazil Wireless Radiography Detector Volume (K) Forecast, by Application 2019 & 2032
- Table 29: Argentina Wireless Radiography Detector Revenue (million) Forecast, by Application 2019 & 2032
- Table 30: Argentina Wireless Radiography Detector Volume (K) Forecast, by Application 2019 & 2032
- Table 31: Rest of South America Wireless Radiography Detector Revenue (million) Forecast, by Application 2019 & 2032
- Table 32: Rest of South America Wireless Radiography Detector Volume (K) Forecast, by Application 2019 & 2032
- Table 33: Global Wireless Radiography Detector Revenue million Forecast, by Application 2019 & 2032
- Table 34: Global Wireless Radiography Detector Volume K Forecast, by Application 2019 & 2032
- Table 35: Global Wireless Radiography Detector Revenue million Forecast, by Type 2019 & 2032
- Table 36: Global Wireless Radiography Detector Volume K Forecast, by Type 2019 & 2032
- Table 37: Global Wireless Radiography Detector Revenue million Forecast, by Country 2019 & 2032
- Table 38: Global Wireless Radiography Detector Volume K Forecast, by Country 2019 & 2032
- Table 39: United Kingdom Wireless Radiography Detector Revenue (million) Forecast, by Application 2019 & 2032
- Table 40: United Kingdom Wireless Radiography Detector Volume (K) Forecast, by Application 2019 & 2032
- Table 41: Germany Wireless Radiography Detector Revenue (million) Forecast, by Application 2019 & 2032
- Table 42: Germany Wireless Radiography Detector Volume (K) Forecast, by Application 2019 & 2032
- Table 43: France Wireless Radiography Detector Revenue (million) Forecast, by Application 2019 & 2032
- Table 44: France Wireless Radiography Detector Volume (K) Forecast, by Application 2019 & 2032
- Table 45: Italy Wireless Radiography Detector Revenue (million) Forecast, by Application 2019 & 2032
- Table 46: Italy Wireless Radiography Detector Volume (K) Forecast, by Application 2019 & 2032
- Table 47: Spain Wireless Radiography Detector Revenue (million) Forecast, by Application 2019 & 2032
- Table 48: Spain Wireless Radiography Detector Volume (K) Forecast, by Application 2019 & 2032
- Table 49: Russia Wireless Radiography Detector Revenue (million) Forecast, by Application 2019 & 2032
- Table 50: Russia Wireless Radiography Detector Volume (K) Forecast, by Application 2019 & 2032
- Table 51: Benelux Wireless Radiography Detector Revenue (million) Forecast, by Application 2019 & 2032
- Table 52: Benelux Wireless Radiography Detector Volume (K) Forecast, by Application 2019 & 2032
- Table 53: Nordics Wireless Radiography Detector Revenue (million) Forecast, by Application 2019 & 2032
- Table 54: Nordics Wireless Radiography Detector Volume (K) Forecast, by Application 2019 & 2032
- Table 55: Rest of Europe Wireless Radiography Detector Revenue (million) Forecast, by Application 2019 & 2032
- Table 56: Rest of Europe Wireless Radiography Detector Volume (K) Forecast, by Application 2019 & 2032
- Table 57: Global Wireless Radiography Detector Revenue million Forecast, by Application 2019 & 2032
- Table 58: Global Wireless Radiography Detector Volume K Forecast, by Application 2019 & 2032
- Table 59: Global Wireless Radiography Detector Revenue million Forecast, by Type 2019 & 2032
- Table 60: Global Wireless Radiography Detector Volume K Forecast, by Type 2019 & 2032
- Table 61: Global Wireless Radiography Detector Revenue million Forecast, by Country 2019 & 2032
- Table 62: Global Wireless Radiography Detector Volume K Forecast, by Country 2019 & 2032
- Table 63: Turkey Wireless Radiography Detector Revenue (million) Forecast, by Application 2019 & 2032
- Table 64: Turkey Wireless Radiography Detector Volume (K) Forecast, by Application 2019 & 2032
- Table 65: Israel Wireless Radiography Detector Revenue (million) Forecast, by Application 2019 & 2032
- Table 66: Israel Wireless Radiography Detector Volume (K) Forecast, by Application 2019 & 2032
- Table 67: GCC Wireless Radiography Detector Revenue (million) Forecast, by Application 2019 & 2032
- Table 68: GCC Wireless Radiography Detector Volume (K) Forecast, by Application 2019 & 2032
- Table 69: North Africa Wireless Radiography Detector Revenue (million) Forecast, by Application 2019 & 2032
- Table 70: North Africa Wireless Radiography Detector Volume (K) Forecast, by Application 2019 & 2032
- Table 71: South Africa Wireless Radiography Detector Revenue (million) Forecast, by Application 2019 & 2032
- Table 72: South Africa Wireless Radiography Detector Volume (K) Forecast, by Application 2019 & 2032
- Table 73: Rest of Middle East & Africa Wireless Radiography Detector Revenue (million) Forecast, by Application 2019 & 2032
- Table 74: Rest of Middle East & Africa Wireless Radiography Detector Volume (K) Forecast, by Application 2019 & 2032
- Table 75: Global Wireless Radiography Detector Revenue million Forecast, by Application 2019 & 2032
- Table 76: Global Wireless Radiography Detector Volume K Forecast, by Application 2019 & 2032
- Table 77: Global Wireless Radiography Detector Revenue million Forecast, by Type 2019 & 2032
- Table 78: Global Wireless Radiography Detector Volume K Forecast, by Type 2019 & 2032
- Table 79: Global Wireless Radiography Detector Revenue million Forecast, by Country 2019 & 2032
- Table 80: Global Wireless Radiography Detector Volume K Forecast, by Country 2019 & 2032
- Table 81: China Wireless Radiography Detector Revenue (million) Forecast, by Application 2019 & 2032
- Table 82: China Wireless Radiography Detector Volume (K) Forecast, by Application 2019 & 2032
- Table 83: India Wireless Radiography Detector Revenue (million) Forecast, by Application 2019 & 2032
- Table 84: India Wireless Radiography Detector Volume (K) Forecast, by Application 2019 & 2032
- Table 85: Japan Wireless Radiography Detector Revenue (million) Forecast, by Application 2019 & 2032
- Table 86: Japan Wireless Radiography Detector Volume (K) Forecast, by Application 2019 & 2032
- Table 87: South Korea Wireless Radiography Detector Revenue (million) Forecast, by Application 2019 & 2032
- Table 88: South Korea Wireless Radiography Detector Volume (K) Forecast, by Application 2019 & 2032
- Table 89: ASEAN Wireless Radiography Detector Revenue (million) Forecast, by Application 2019 & 2032
- Table 90: ASEAN Wireless Radiography Detector Volume (K) Forecast, by Application 2019 & 2032
- Table 91: Oceania Wireless Radiography Detector Revenue (million) Forecast, by Application 2019 & 2032
- Table 92: Oceania Wireless Radiography Detector Volume (K) Forecast, by Application 2019 & 2032
- Table 93: Rest of Asia Pacific Wireless Radiography Detector Revenue (million) Forecast, by Application 2019 & 2032
- Table 94: Rest of Asia Pacific Wireless Radiography Detector Volume (K) Forecast, by Application 2019 & 2032
Frequently Asked Questions
1. What is the projected Compound Annual Growth Rate (CAGR) of the Wireless Radiography Detector?
The projected CAGR is approximately XXX%.
2. Which companies are prominent players in the Wireless Radiography Detector?
Key companies in the market include GE Healthcare, Varex Imaging Corporation, Thales Group, Carestream, FUJIFILM Holdings Corporation, Canon, Analogic Corporation, AGFA Healthcare, KONICA MINOLTA, Villa Sistemi Medicali, iRay Technology, Idetec Medical Imaging, Vieworks, Atlaim.
3. What are the main segments of the Wireless Radiography Detector?
The market segments include Application, Type.
4. Can you provide details about the market size?
The market size is estimated to be USD XXX million as of 2022.
5. What are some drivers contributing to market growth?
N/A
6. What are the notable trends driving market growth?
N/A
7. Are there any restraints impacting market growth?
N/A
8. Can you provide examples of recent developments in the market?
N/A
9. What pricing options are available for accessing the report?
Pricing options include single-user, multi-user, and enterprise licenses priced at USD 3950.00, USD 5925.00, and USD 7900.00 respectively.
10. Is the market size provided in terms of value or volume?
The market size is provided in terms of value, measured in million and volume, measured in K.
11. Are there any specific market keywords associated with the report?
Yes, the market keyword associated with the report is "Wireless Radiography Detector," which aids in identifying and referencing the specific market segment covered.
12. How do I determine which pricing option suits my needs best?
The pricing options vary based on user requirements and access needs. Individual users may opt for single-user licenses, while businesses requiring broader access may choose multi-user or enterprise licenses for cost-effective access to the report.
13. Are there any additional resources or data provided in the Wireless Radiography Detector report?
While the report offers comprehensive insights, it's advisable to review the specific contents or supplementary materials provided to ascertain if additional resources or data are available.
14. How can I stay updated on further developments or reports in the Wireless Radiography Detector?
To stay informed about further developments, trends, and reports in the Wireless Radiography Detector, consider subscribing to industry newsletters, following relevant companies and organizations, or regularly checking reputable industry news sources and publications.
Methodology
Step 1 - Identification of Relevant Samples Size from Population Database


Step 2 - Approaches for Defining Global Market Size (Value, Volume* & Price*)

Note*: In applicable scenarios
Step 3 - Data Sources
Primary Research
- Web Analytics
- Survey Reports
- Research Institute
- Latest Research Reports
- Opinion Leaders
Secondary Research
- Annual Reports
- White Paper
- Latest Press Release
- Industry Association
- Paid Database
- Investor Presentations

Step 4 - Data Triangulation
Involves using different sources of information in order to increase the validity of a study
These sources are likely to be stakeholders in a program - participants, other researchers, program staff, other community members, and so on.
Then we put all data in single framework & apply various statistical tools to find out the dynamic on the market.
During the analysis stage, feedback from the stakeholder groups would be compared to determine areas of agreement as well as areas of divergence
